0995
Detecting in vivo Mitochondrial Dysfunction with 4D Oxy-wavelet MRI in Kainic Acid Induced Temporal Lobe Epilepsy1Department of Bioengineering, Swanson School of Engineering, University of Pittsburgh, Pittsburgh, PA, United States, 2Department of Developmental Biology, School of Medicine, University of Pittsburgh, Pittsburgh, PA, United States, 3Rangos Research Center Small Animal Imaging Core, Children's Hospital of Pittsburgh of UPMC, Pittsburgh, PA, United States, 4Rangos Research Center Animal Imaging Core, Children's Hospital of Pittsburgh of UPMC, Pittsburgh, PA, United States, 5Department of Pediatrics, University of Pittsburgh, School of Medicine, Pittsburgh, PA, United States, 6Rangos Research Center Small Animal Imaging Core, University of Pittsburgh, Pittsburgh, PA, United States, 7Department of Pediatrics, School of Medicine, University of Pittsburgh, Pittsburgh, PA, United States, 8Allegheny Health Network Research Institue, Allegheny General Hospital, Pittsburgh, PA, United States, 9Biomedical Imaging Research Institue, Cedars-Sinai Medical Center, Los Angeles, CA, United States
Synopsis
Keywords: Epilepsy, Metabolism, fMRI, Hypoxia
Intractable temporal lobe epilepsy, often acquired after status epilepticus (SE) injury, greatly reduces quality of life. There is an unmet need for a non-invasive method to track progression from SE to epilepsy, which would allow early intervention to prevent irreversible damage to the brain. Mitochondrial dysfunction is becoming a recognized marker of epileptogenesis. Here, we established a novel functional MRI methodology, the 4D Oxy-wavelet MRI, capable of in vivo detection of mitochondrial dysfunction underlying post-SE epileptogenesis in a spatial specific manner. This non-invasive method may aid early detection of subclinical epileptogenesis and serve as a biomarker for therapeutic efficacy.Background
Temporal lobe epilepsy (TLE), the most frequent form of acquired epilepsy, is typically initiated by brain injury, such as status epilepticus (SE)[1], followed by a latent period wherein molecular and cellular remodeling occurs leading to chronic epilepsy. However, there are major knowledge gaps in disease thresholds and a lack of sensitive in vivo tools to detect and monitor the subclinical epileptogenesis process for early intervention before epilepsy is established.Mitochondrial dysfunction[2-9] is increasingly recognized as an inciting factor for TLE[3, 9], not only acutely after SE[1, 10], but also contributing to epileptogenesis[5] for refractory TLE[11]. However, it is lacking a sensitive and quantitative tool that can detect mitochondrial dysfunction underlying the epileptogenesis processes in a spatial specific manner.
We have established a 4D functional MRI (fMRI) capable of 3D isotropic MRI time-series to simultaneously capture fast dynamic blood oxygenation level dependent (BOLD) signals in the same anatomical scan with both high-spatial and high-temporal resolution (voxel size: 0.00047 mm3, frame rate: 14 ms) using sub-Nyquist sparse sampling. We leverage the fact that acute [12-16] adaptation to hypoxia requires intact mitochondrial functions, to probe mitochondrial dysfunctions, called 4D Oxy-wavelet MRI. We first tested its capability in detecting mitochondrial dysfunction inflicted by mitochondrial inhibitors rotenone and 2,4-dinitrophenol (DNP). We then tested its preclinical efficacy in mitochondrial dysfunction underlying post-SE epileptogenesis.
Methods
Animal ModelMitochondrial dysfunctions were induced in Sprague-Dawley rats with acute doses of rotenone (50mg/kg BW) or DNP (5 mg/kg BW). Additionally, multiple low doses of kainic acid (KA, 5 mg/kg BW) were used to elicit SE. Age-matched sham control rats were subjected to the same protocol.
4D Oxy-wavelet MRI
We use a hybrid low-rank [17] and sparse [18] model to measure a dynamic BOLD image $$$\rho(\mathbf{r},t)$$$ (for spatial position $$$\mathbf{r}$$$ and time $$$t$$$) from undersampled $$$(\mathbf{k},t)$$$ -space data. The low-rank model expresses the image as the outer product of a set of $$$L$$$ basis images $$$\{\psi_\ell(\mathbf{r})\}_{\ell=1}^L$$$ and $$$L$$$ temporal functions $$$\{\varphi_\ell(t)\}_{\ell=1}^L$$$:$$\rho(\mathbf{r},t)=\sum_{\ell=1}^L\psi_\ell(\mathbf{r})\varphi_\ell(t)$$ This model exploits correlation of images over time[19] and when transform sparsity[20] of $$$\{\psi_\ell(\mathbf{r})\}_{\ell=1}^L$$$ is additionally enforced during image reconstruction. This allows for fMRI with high spatiotemporal resolution; furthermore, it can assess oxygen attenuation during the same single scan.
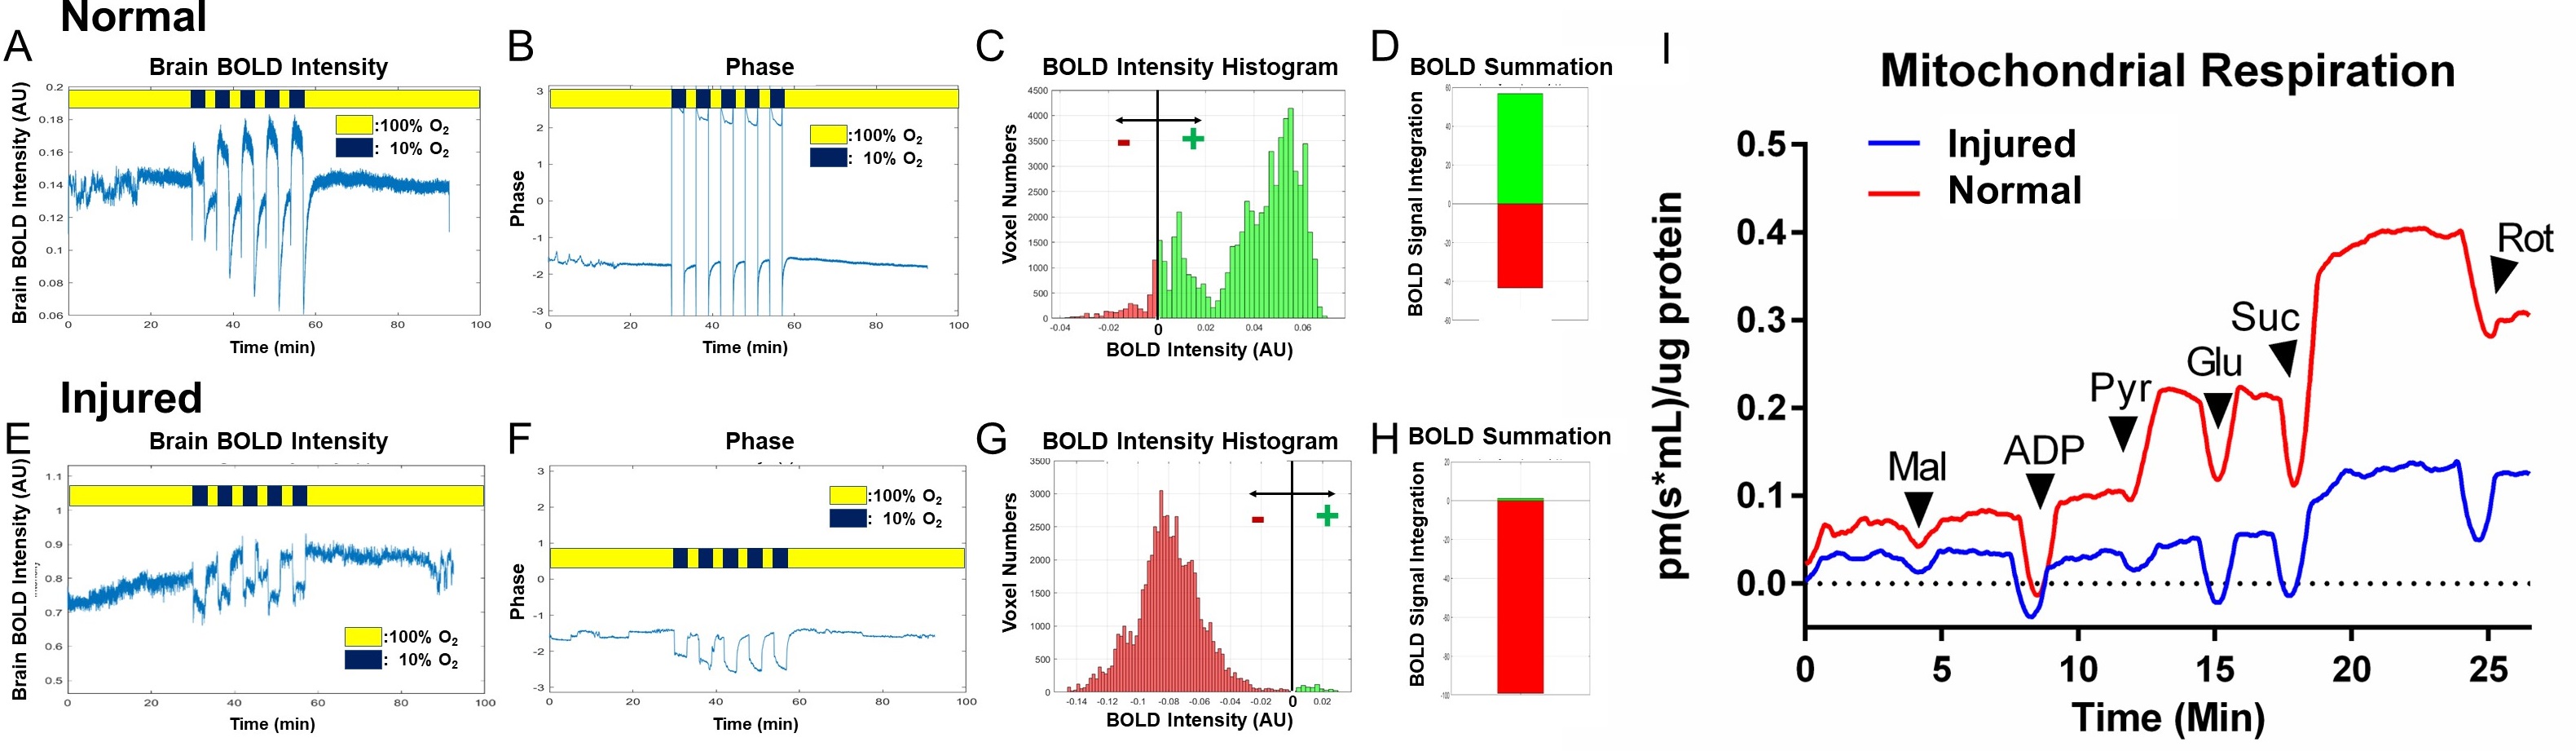
We have successfully established a pipeline for probing brain mitochondrial function by transient short bursts (3 minutes) of hypoxia (10% O2) via inhalation in a fetal irradiation injury model (Figs.1-2). The normal brains (Fig.1A-D) with intact mitochondrial functions can overcome the bursts of hypoxia (Fig.1AB dark blue) to quickly adjust to a higher oxygenation state after initial transient BOLD signal drop (Fig.1A), with most voxels showing higher than baseline BOLD levels (Fig.1CD, green). On the other hand, injured brains (Fig.1E-H) showed decreased BOLD signal (Fig.1E), unable to cope with the hypoxic environment, with most voxels showing BOLD levels lower than baseline (Fig.1GH, red). The exact timing of the input oxygen events was determined by the global phases (Fig.1B, F). The 4D Oxy-wavelet signals were validated with Oroboros mitochondrial assays with brain lysates (Fig.1I). The injured brains showed low mitochondrial functions.
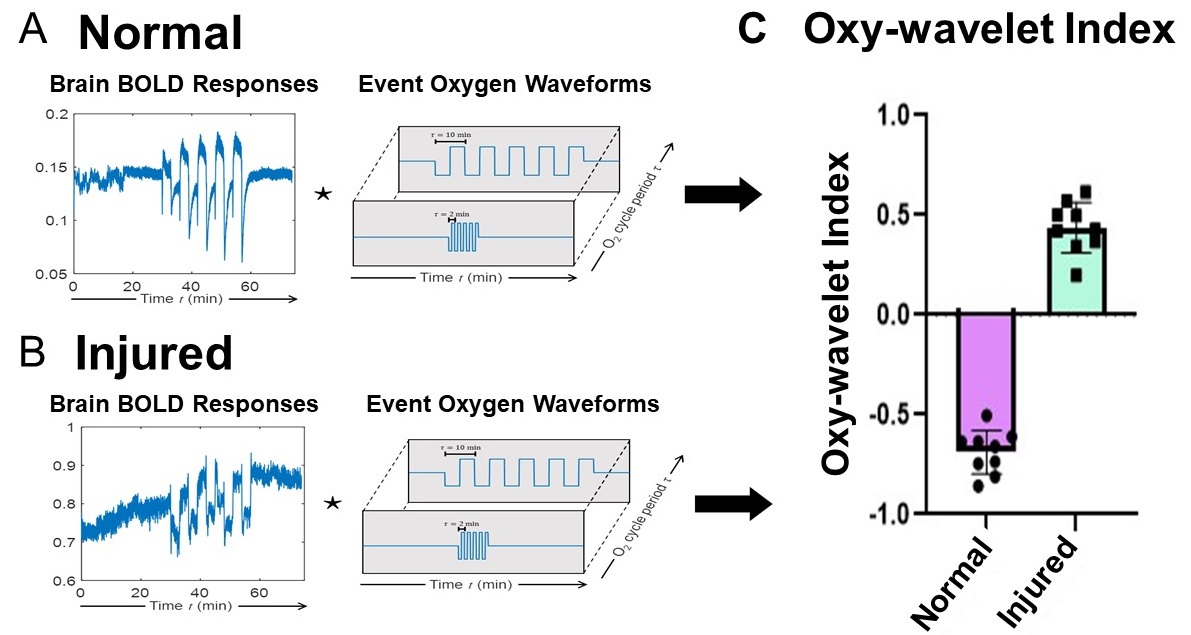
We also developed an automated time-frequency analysis scheme (Fig.2) for 4D Oxy-wavelet MRI. Our BOLD signal is event-driven, following the oscillations of the hypoxia challenge; the event waveform resembles a square wave. Convolving the BOLD signal by template event waveforms at several oscillation frequencies will produce a wavelet-like feature space revealing various details (Fig.2A,B). Positive Oxy-wavelet indexes (Fig.2C green) represent the passive inability to maintain oxygen homeostasis during hypoxia resulting from poor mitochondrial function. Conversely, negative Oxy-wavelet indexes (Fig.2C purple) represent the ability for active compensation during oscillating hypoxia challenges, indicating good mitochondrial function.
The rat brain 4D Oxy-wavelet signals were parcellated into 242 Regions of Interests (ROIs) based on the SIGMA rat brain atlas[21]. The BOLD signals from each ROI were processed with this established pipeline (Figs.1-2).
In vitro Oroboros Mitochondrial Assay
4D Oxy-wavelet MRI results were validated by the Oroboros mitochondrial functional assay (Fig.1I). Freshly harvested brain homogenates were mixed with tricarboxylic acid cycle substrates and inhibitors to mitochondrial complex I and II in a stepwise fashion where oxygen consumption was measured at each step.
Results
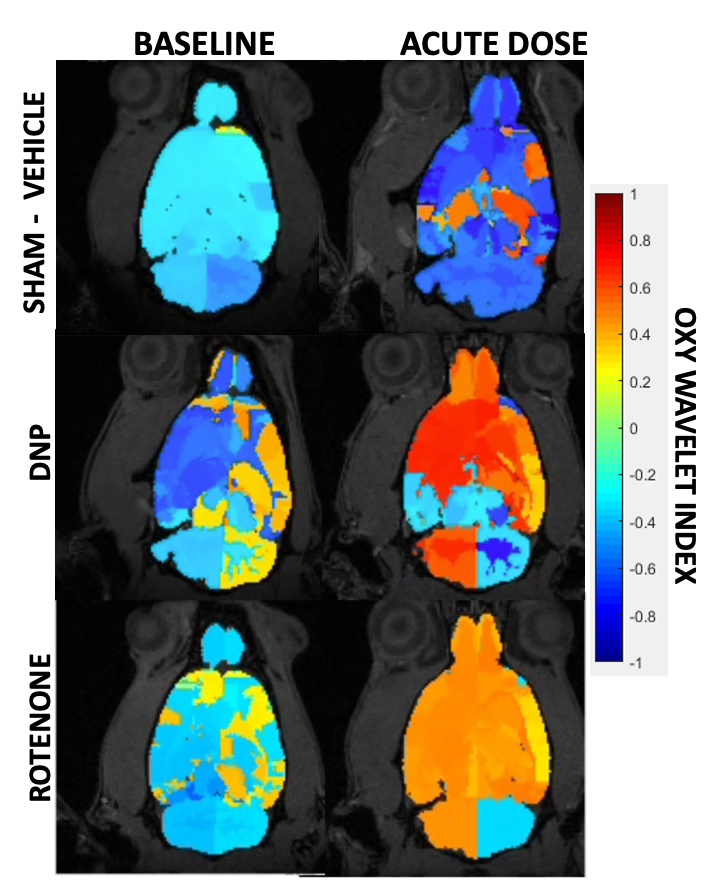
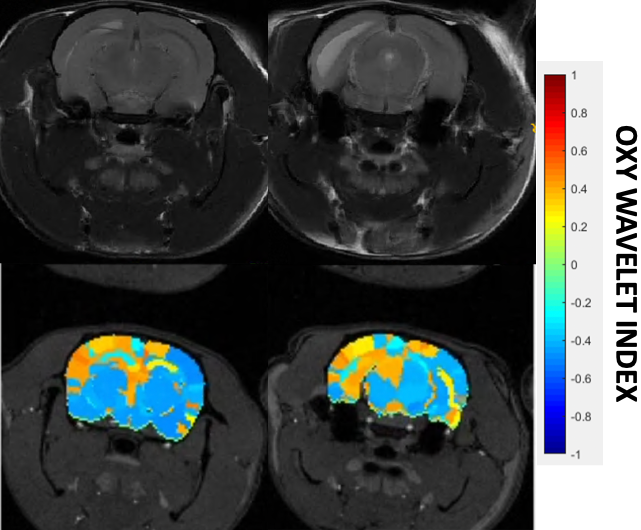
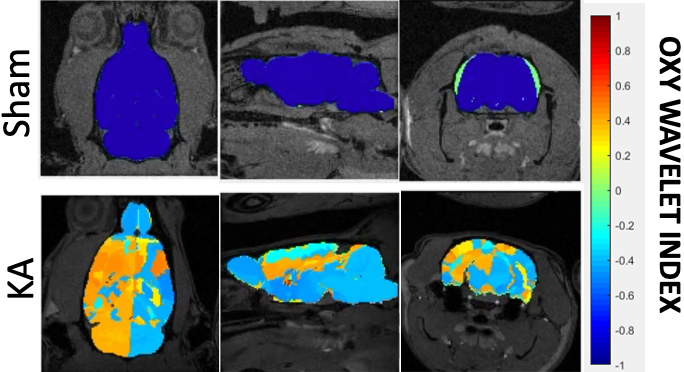
After treatments of mitochondrial inhibitors DNP or rotenone (Fig.3) to disrupt mitochondrial functions, affected brain regions showed passive inability to maintain oxygen homeostasis during hypoxia challenges, resulting in positive Oxy-wavelet indexes. 4D Oxy-wavelet MRI showed disruption in both cortical and deep-brain regions including the olfactory regions, the motor cortex, the somatosensory areas, as well as the corpus collosum and hippocampal regions (Fig. 3). The 4D Oxy-wavelet MRI results were validated with Oroboros assays.Furthermore, after acute KA administration to cause SE, T2-weighted RARE showed hyperintensity in the affected regions (Fig.4). Positive Oxy-wavelet indexes (Fig.5) reflecting mitochondrial dysfunction were seen in hippocampus, fimbria, amygdala and piriform cortex, the brain regions known to be affected by KA-induced SE[22, 23]. Our data showed that 4D Oxy-wavelet MRI can detect regional mitochondrial dysfunction caused by SE-inducing KA.
Conclusion
4D Oxy-wavelet MRI can successfully monitor and identify loci of mitochondrial dysfunction in a spatial specific manner in intact live brains. This can potentially aid early detection of epileptogenesis and be a surrogate biomarker for testing preclinical therapeutic efficacy.Acknowledgements
No acknowledgement found.References
1. Walker, M.C., Pathophysiology of status epilepticus. Neurosci Lett, 2018. 667: p. 84-91.
2. Folbergrova, J. and W.S. Kunz, Mitochondrial dysfunction in epilepsy. Mitochondrion, 2012. 12(1): p. 35-40.
3. Kudin, A.P., et al., Mitochondrial involvement in temporal lobe epilepsy. Exp Neurol, 2009. 218(2): p. 326-32.
4. Zsurka, G. and W.S. Kunz, Mitochondrial dysfunction and seizures: the neuronal energy crisis. Lancet Neurol, 2015. 14(9): p. 956-66.
5. Kunz, W.S., The role of mitochondria in epileptogenesis. Curr Opin Neurol, 2002. 15(2): p. 179-84.
6. Rowley, S. and M. Patel, Mitochondrial involvement and oxidative stress in temporal lobe epilepsy. Free Radic Biol Med, 2013. 62: p. 121-131.
7. Waldbaum, S. and M. Patel, Mitochondrial dysfunction and oxidative stress: a contributing link to acquired epilepsy? J Bioenerg Biomembr, 2010. 42(6): p. 449-55.
8. Cloix, J.F. and T. Hevor, Epilepsy, regulation of brain energy metabolism and neurotransmission. Curr Med Chem, 2009. 16(7): p. 841-53.
9. Kunz, W.S., et al., Mitochondrial complex I deficiency in the epileptic focus of patients with temporal lobe epilepsy. Ann Neurol, 2000. 48(5): p. 766-73.
10. Rahman, S., Mitochondrial diseases and status epilepticus. Epilepsia, 2018. 59 Suppl 2: p. 70-77.
11. Wu, M., et al., Mitophagy in Refractory Temporal Lobe Epilepsy Patients with Hippocampal Sclerosis. Cell Mol Neurobiol, 2018. 38(2): p. 479-486.
12. Marshall, J.M., The Joan Mott Prize Lecture. The integrated response to hypoxia: from circulation to cells. Exp Physiol, 1999. 84(3): p. 449-70.
13. Giussani, D.A., The fetal brain sparing response to hypoxia: physiological mechanisms. J Physiol, 2016. 594(5): p. 1215-30.
14. Lee, P., N.S. Chandel, and M.C. Simon, Cellular adaptation to hypoxia through hypoxia inducible factors and beyond. Nat Rev Mol Cell Biol, 2020. 21(5): p. 268-283.
15. Holmes, A.P., et al., Is Carotid Body Physiological O(2) Sensitivity Determined by a Unique Mitochondrial Phenotype? Front Physiol, 2018. 9: p. 562.
16. Michiels, C., Physiological and pathological responses to hypoxia. Am J Pathol, 2004. 164(6): p. 1875-82.
17. Christodoulou, A.G., et al., High-resolution cardiovascular MRI by integrating parallel imaging with low-rank and sparse modeling. IEEE Trans Biomed Eng, 2013. 60(11): p. 3083-92.
18. Zhao, B., et al., Image reconstruction from highly undersampled (k, t)-space data with joint partial separability and sparsity constraints. IEEE Trans Med Imaging, 2012. 31(9): p. 1809-20.
19. Liang, Z.-P., Spatiotemporal imaging with partially separable functions. Proc IEEE Int Symp Biomed Imaging, 2007: p. 988-991.
20. Lustig, M., D. Donoho, and J.M. Pauly, Sparse MRI: The application of compressed sensing for rapid MR imaging. Magn Reson Med, 2007. 58(6): p. 1182-95.
21. Barrière, D.A., et al., The SIGMA rat brain templates and atlases for multimodal MRI data analysis and visualization. Nat Commun, 2019. 10(1): p. 5699.
22. Pearce, P.S., et al., Metabolic injury in a variable rat model of post-status epilepticus. Epilepsia, 2016. 57(12): p. 1978-1986.
23. Wu, Y., et al., Metabolic changes in early poststatus epilepticus measured by MR spectroscopy in rats. J Cereb Blood Flow Metab, 2015. 35(11): p. 1862-70.
Figures