0994
Automated Surfaced-based Detection of Focal Cortical Dysplasia using MR Fingerprinting1Epilepsy Center, Neurological Institute, Cleveland Clinic, Cleveland, OH, United States, 2Biomedical Engineering, Case Western Reserve University, Cleveland, OH, United States, 3Quantitative Health Science, Cleveland Clinic, Cleveland, OH, United States, 4University College London Great Ormond Street Institute for Child Health, London, United Kingdom, 5Wellcome Centre for Human Neuroimaging, London, United Kingdom, 6Imaging Institute, Cleveland Clinic, Cleveland, OH, United States, 7Neuropathology, University Hospitals Erlangen, Erlangen, Germany
Synopsis
Keywords: Epilepsy, MR Fingerprinting
Focal cortical dysplasia (FCD) is a common pathology in medically intractable focal epilepsy and often difficult to detect by visual inspection of conventional MRI. We developed a framework for automatic FCD detection using surface-based processing of conventional MRI and MR fingerprinting data. Thirty-six patients with FCD and 48 healthy controls were included. Improved vertex-wise and cluster-wise performance was seen when MRF and FLAIR features were added to T1w data. A second-stage cluster-wise classifier showed efficacy to reduce false-positive clusters. Interim results of patient-level sensitivity of 76% and low false-positive clusters in controls supported potential clinical applicability of the proposed framework.Introduction
Focal cortical dysplasia (FCD) is a common pathology in intractable focal epilepsy. Subtle FCDs can be difficult to detect by visual inspection of conventional clinical MRI. MR fingerprinting (MRF) is an advanced quantitative MR technique that allows for the efficient acquisition of multiparametric tissue maps1. The quantitative nature of MRF makes it well-suited for reflecting tissue property changes in epileptic lesions. Here, we aimed to develop a framework for automatic FCD detection using surface-based morphometric processing of conventional T1-weighted (T1w), fluid-attenuated inversion recovery (FLAIR), and MRF data.Methods
Patient recruitment: We included 36 patients with medically intractable focal epilepsy and FCD (histologically confirmed in 29, radiologically confirmed in 7) who underwent pre-surgical evaluation at the Cleveland Clinic Epilepsy Center. 3D FLAIR images were available in 29 of the 36 patients. Forty-eight healthy controls (HCs) were also included.MRI data acquisition: High-resolution 3D whole-brain MRF scans (1 mm3 isotropic voxels) were performed using a Siemens 3T Prisma scanner2. Dictionary-based reconstruction of the MRF T1 and T2 maps was performed. T1w images were synthesized from the MRF T1 maps, which were perfectly aligned with the T1 and T2 maps. A clinical 3D T1w whole-brain magnetization-prepared rapid acquisition with gradient echo (MPRAGE) scan was acquired with the following parameters: resolution = 0.5 x 0.5 x 0.9 mm3, repetition time (TR) = 1900 ms, echo time (TE) = 2.57 ms, inversion time (TI) = 1100 ms, 192 slices and scan time = 3 min 53 sec. 3D FLAIR was acquired with TR of 5000 ms, TE of 393 ms, slice thickness 1mm, and scan time of 7 min 37 sec.
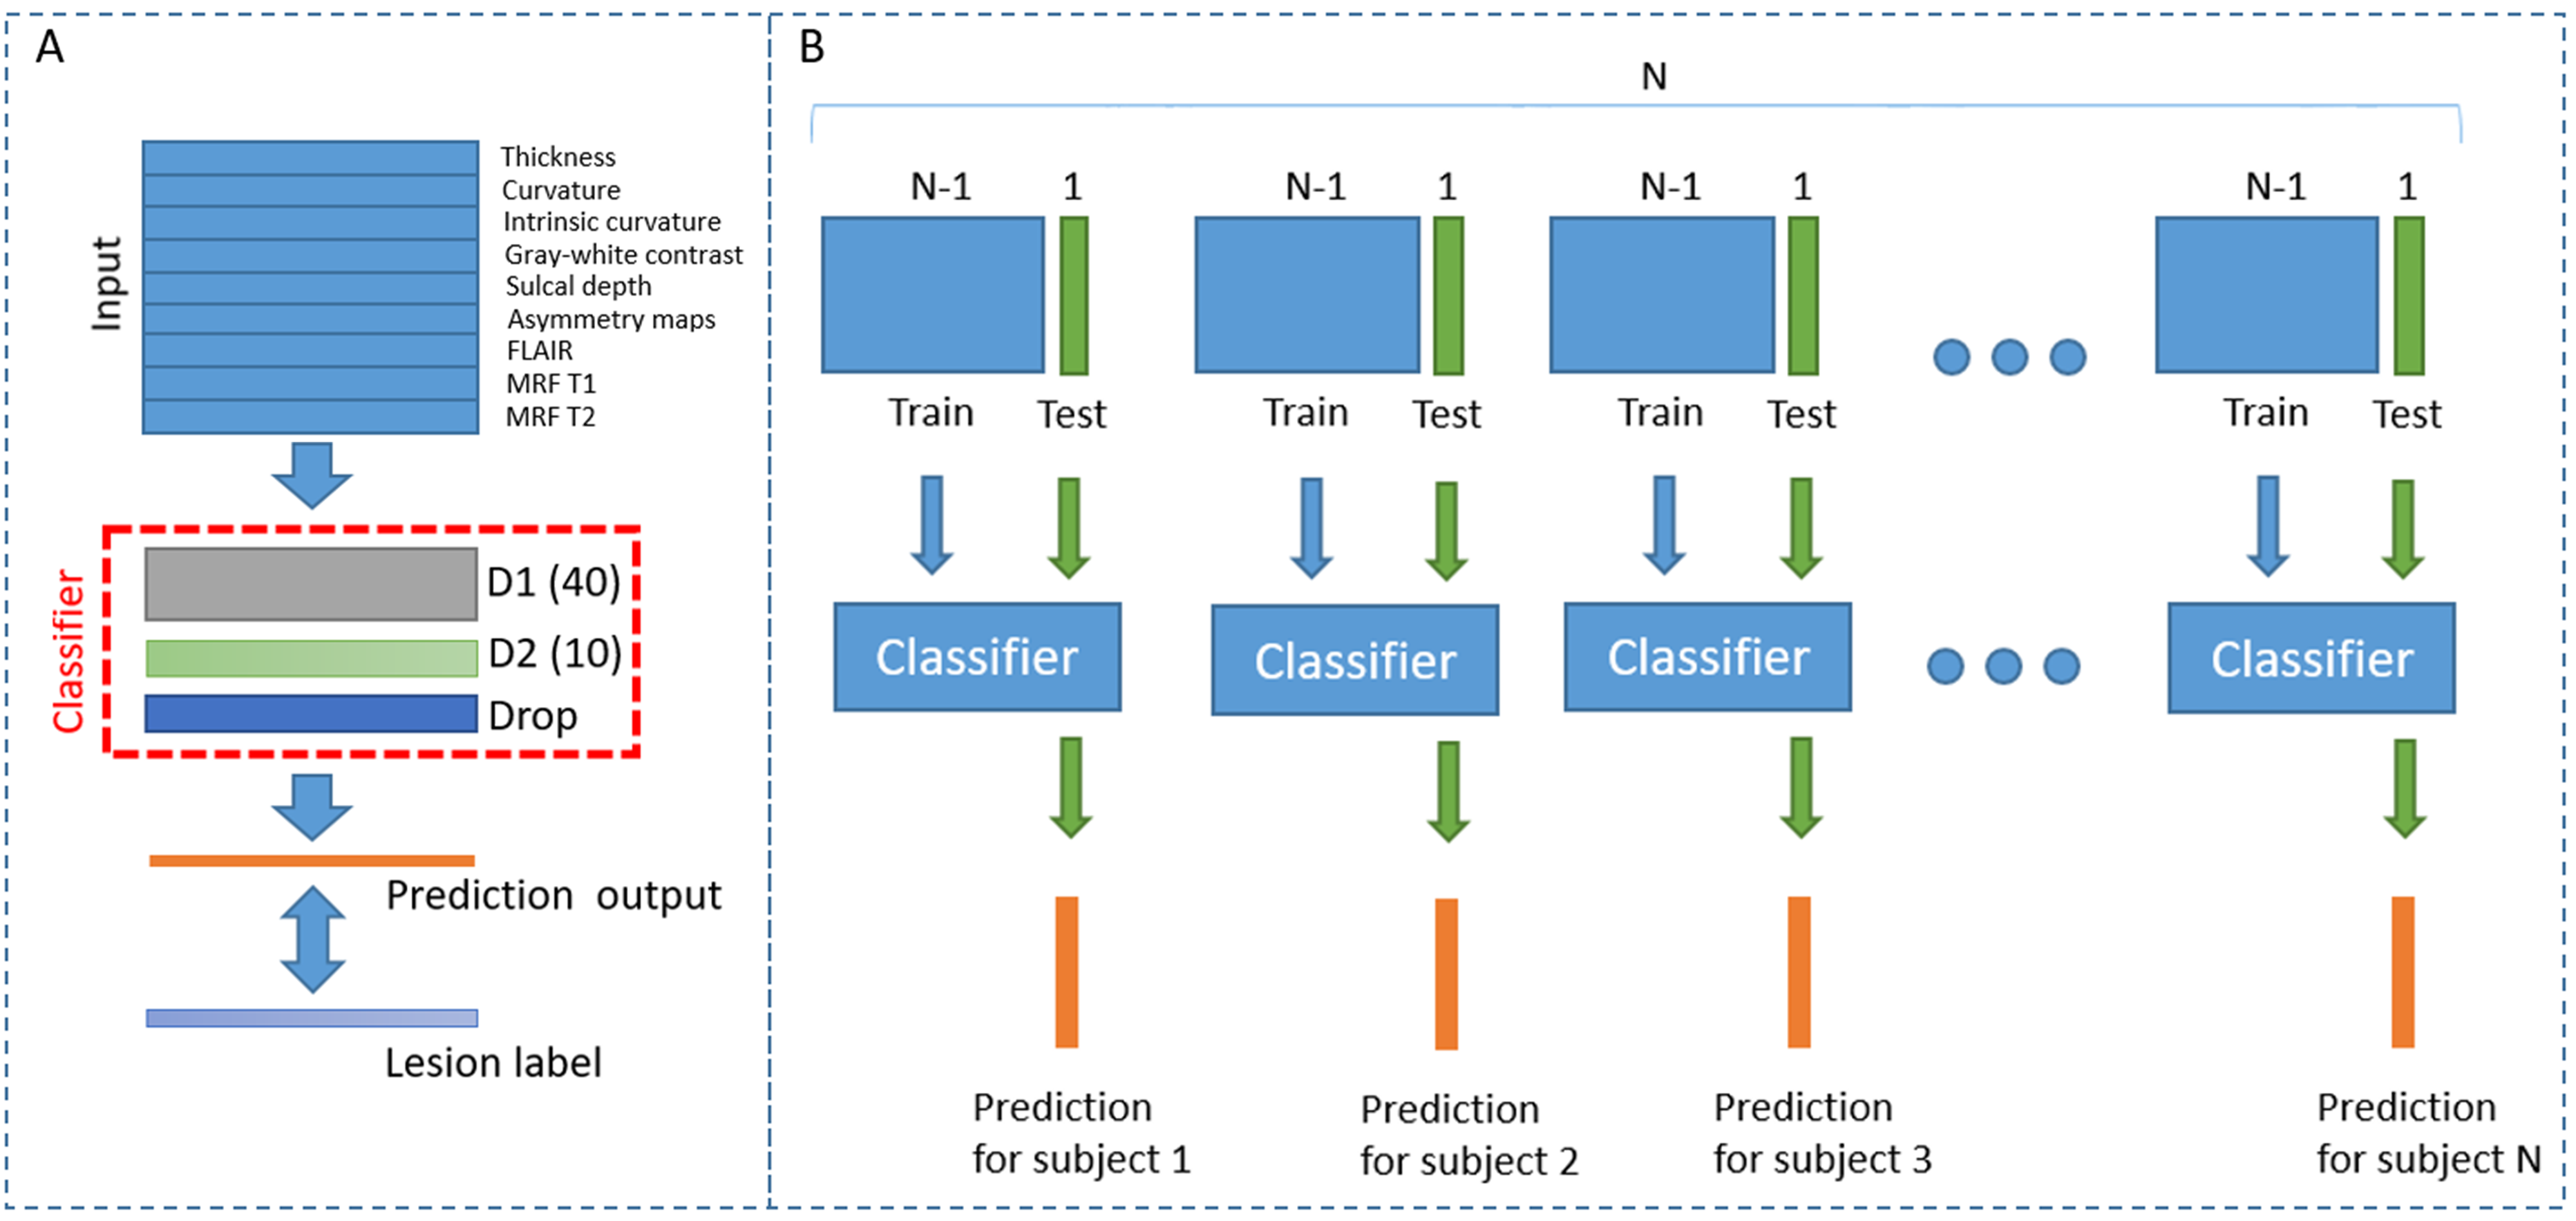
MRI data processing: Freesurfer “recon-all” was performed on T1w MPRAGE images. The MRF T1 and T2 maps as well as 3D FLAIR were registered to the T1w images using SyN in Advanced Normalization Tools (ANTs)3 and sampled at 25%, 50%, and 75% of the cortical thickness, as well as at the gray-white matter boundary and 0.5 and 1 mm into the white matter. Lesion ROI was manually created on MRF T1w images and registered to the same space. We utilized the Multi-center Epilepsy Lesion Detection (MELD) pipeline4,5 to generate surface-based morphometric (SBM) features, including thickness, mean curvature, intrinsic curvature, gray-white contrast, sulcal depth, and asymmetry maps of these features.
Normalization procedures with intra-subject, intra-hemispheric, and inter-subject z-scoring using the HCs were performed. Consistent with the MELD pipeline, the neural network models with 2 hidden layers with 40 and 10 nodes were trained using patient and HC data. Nested leave-one-out (LOO) cross-validation was used to assess lesion detection performance on the vertex level (Figure 1). Surfaced-level clustering was applied to the predicted output with a threshold decided by the training cohort. True-positive (TP) clusters were defined as the clusters that overlapped with the lesion label, and false-positive (FP) clusters were defined as the clusters outside of the lesion label or the existence of any positive clusters in HCs.
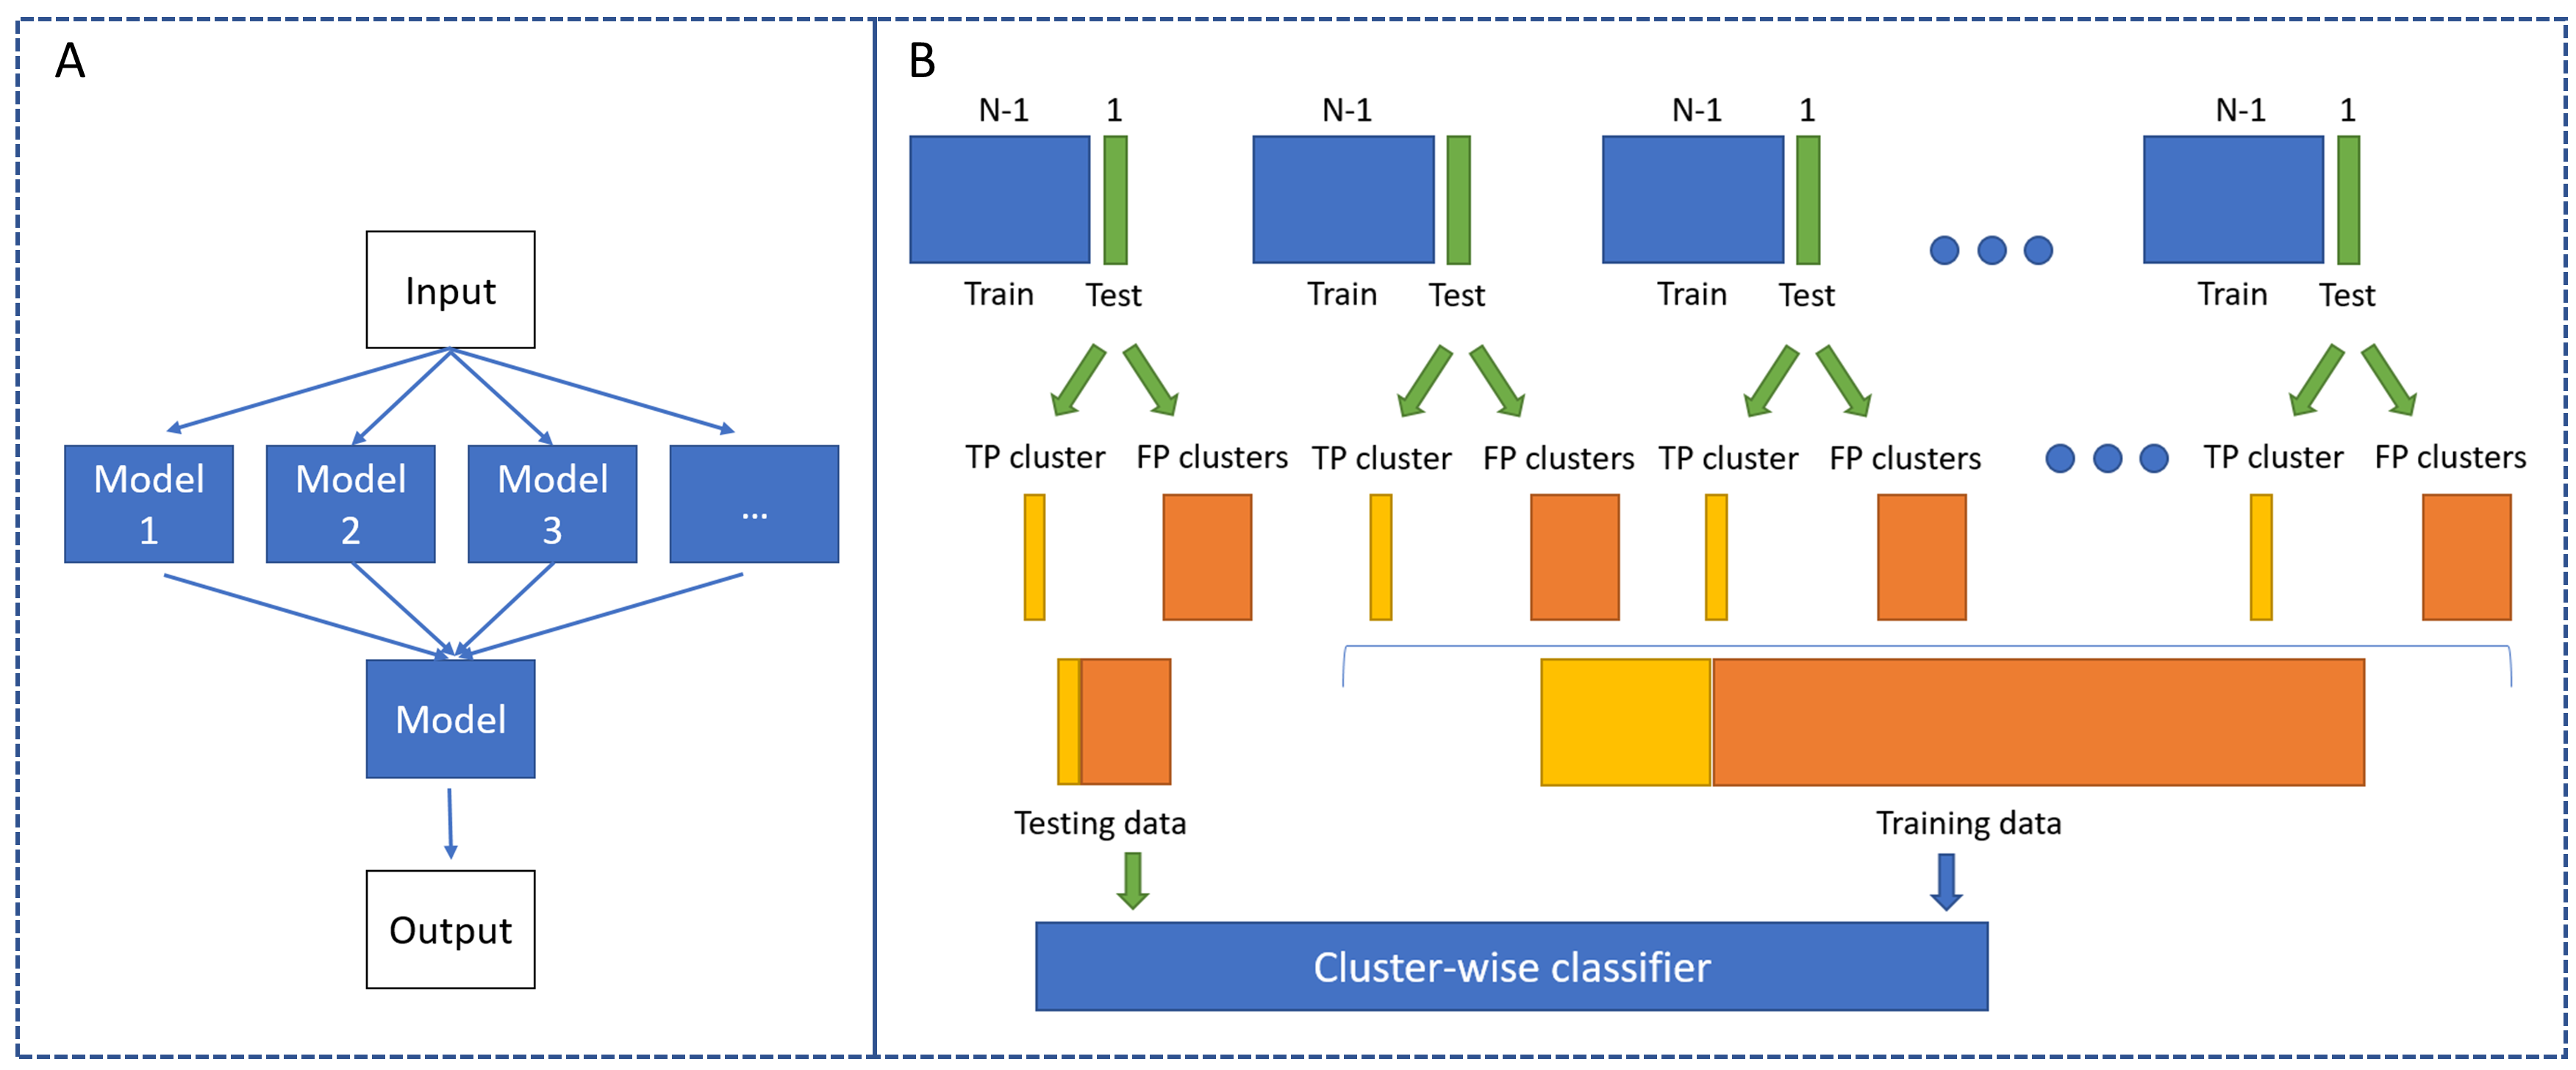
To reduce FP findings, a second-stage cluster-wise classifier was trained to suppress the FP clusters and maintain the true-positive clusters based on the Random Undersampling Boosting (RUSBoost) ensemble algorithm, using the mean, max, and standard deviation values of features within each cluster as input. LOO cross-validation was then applied to assess lesion detection performance on the cluster level (Figure 2).
Results
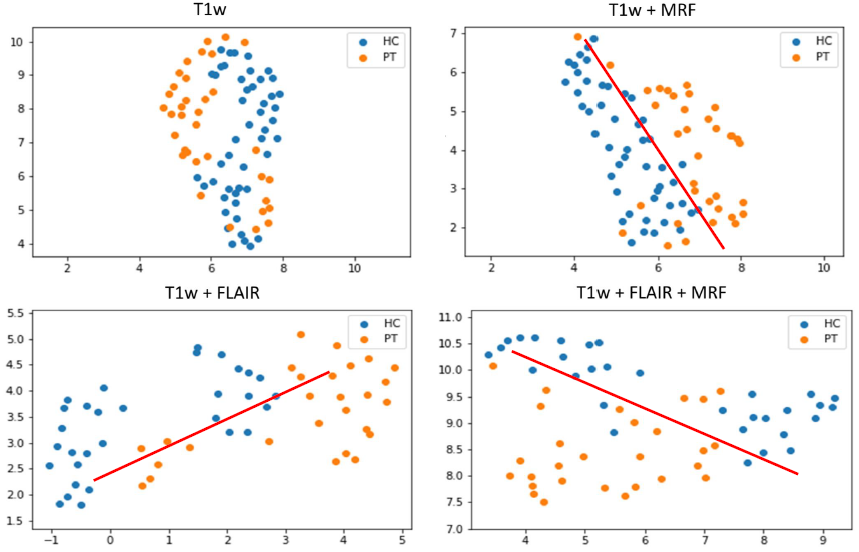
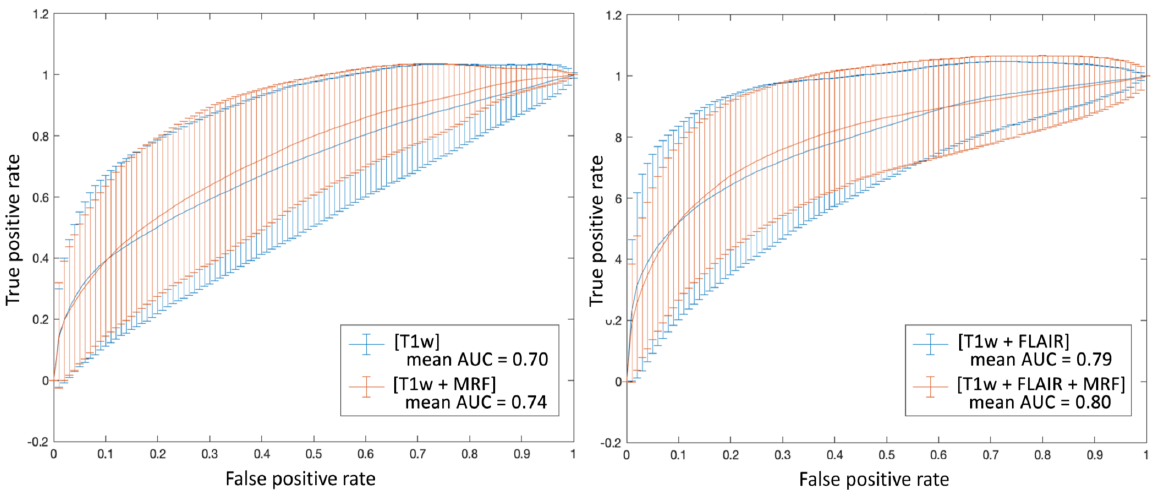
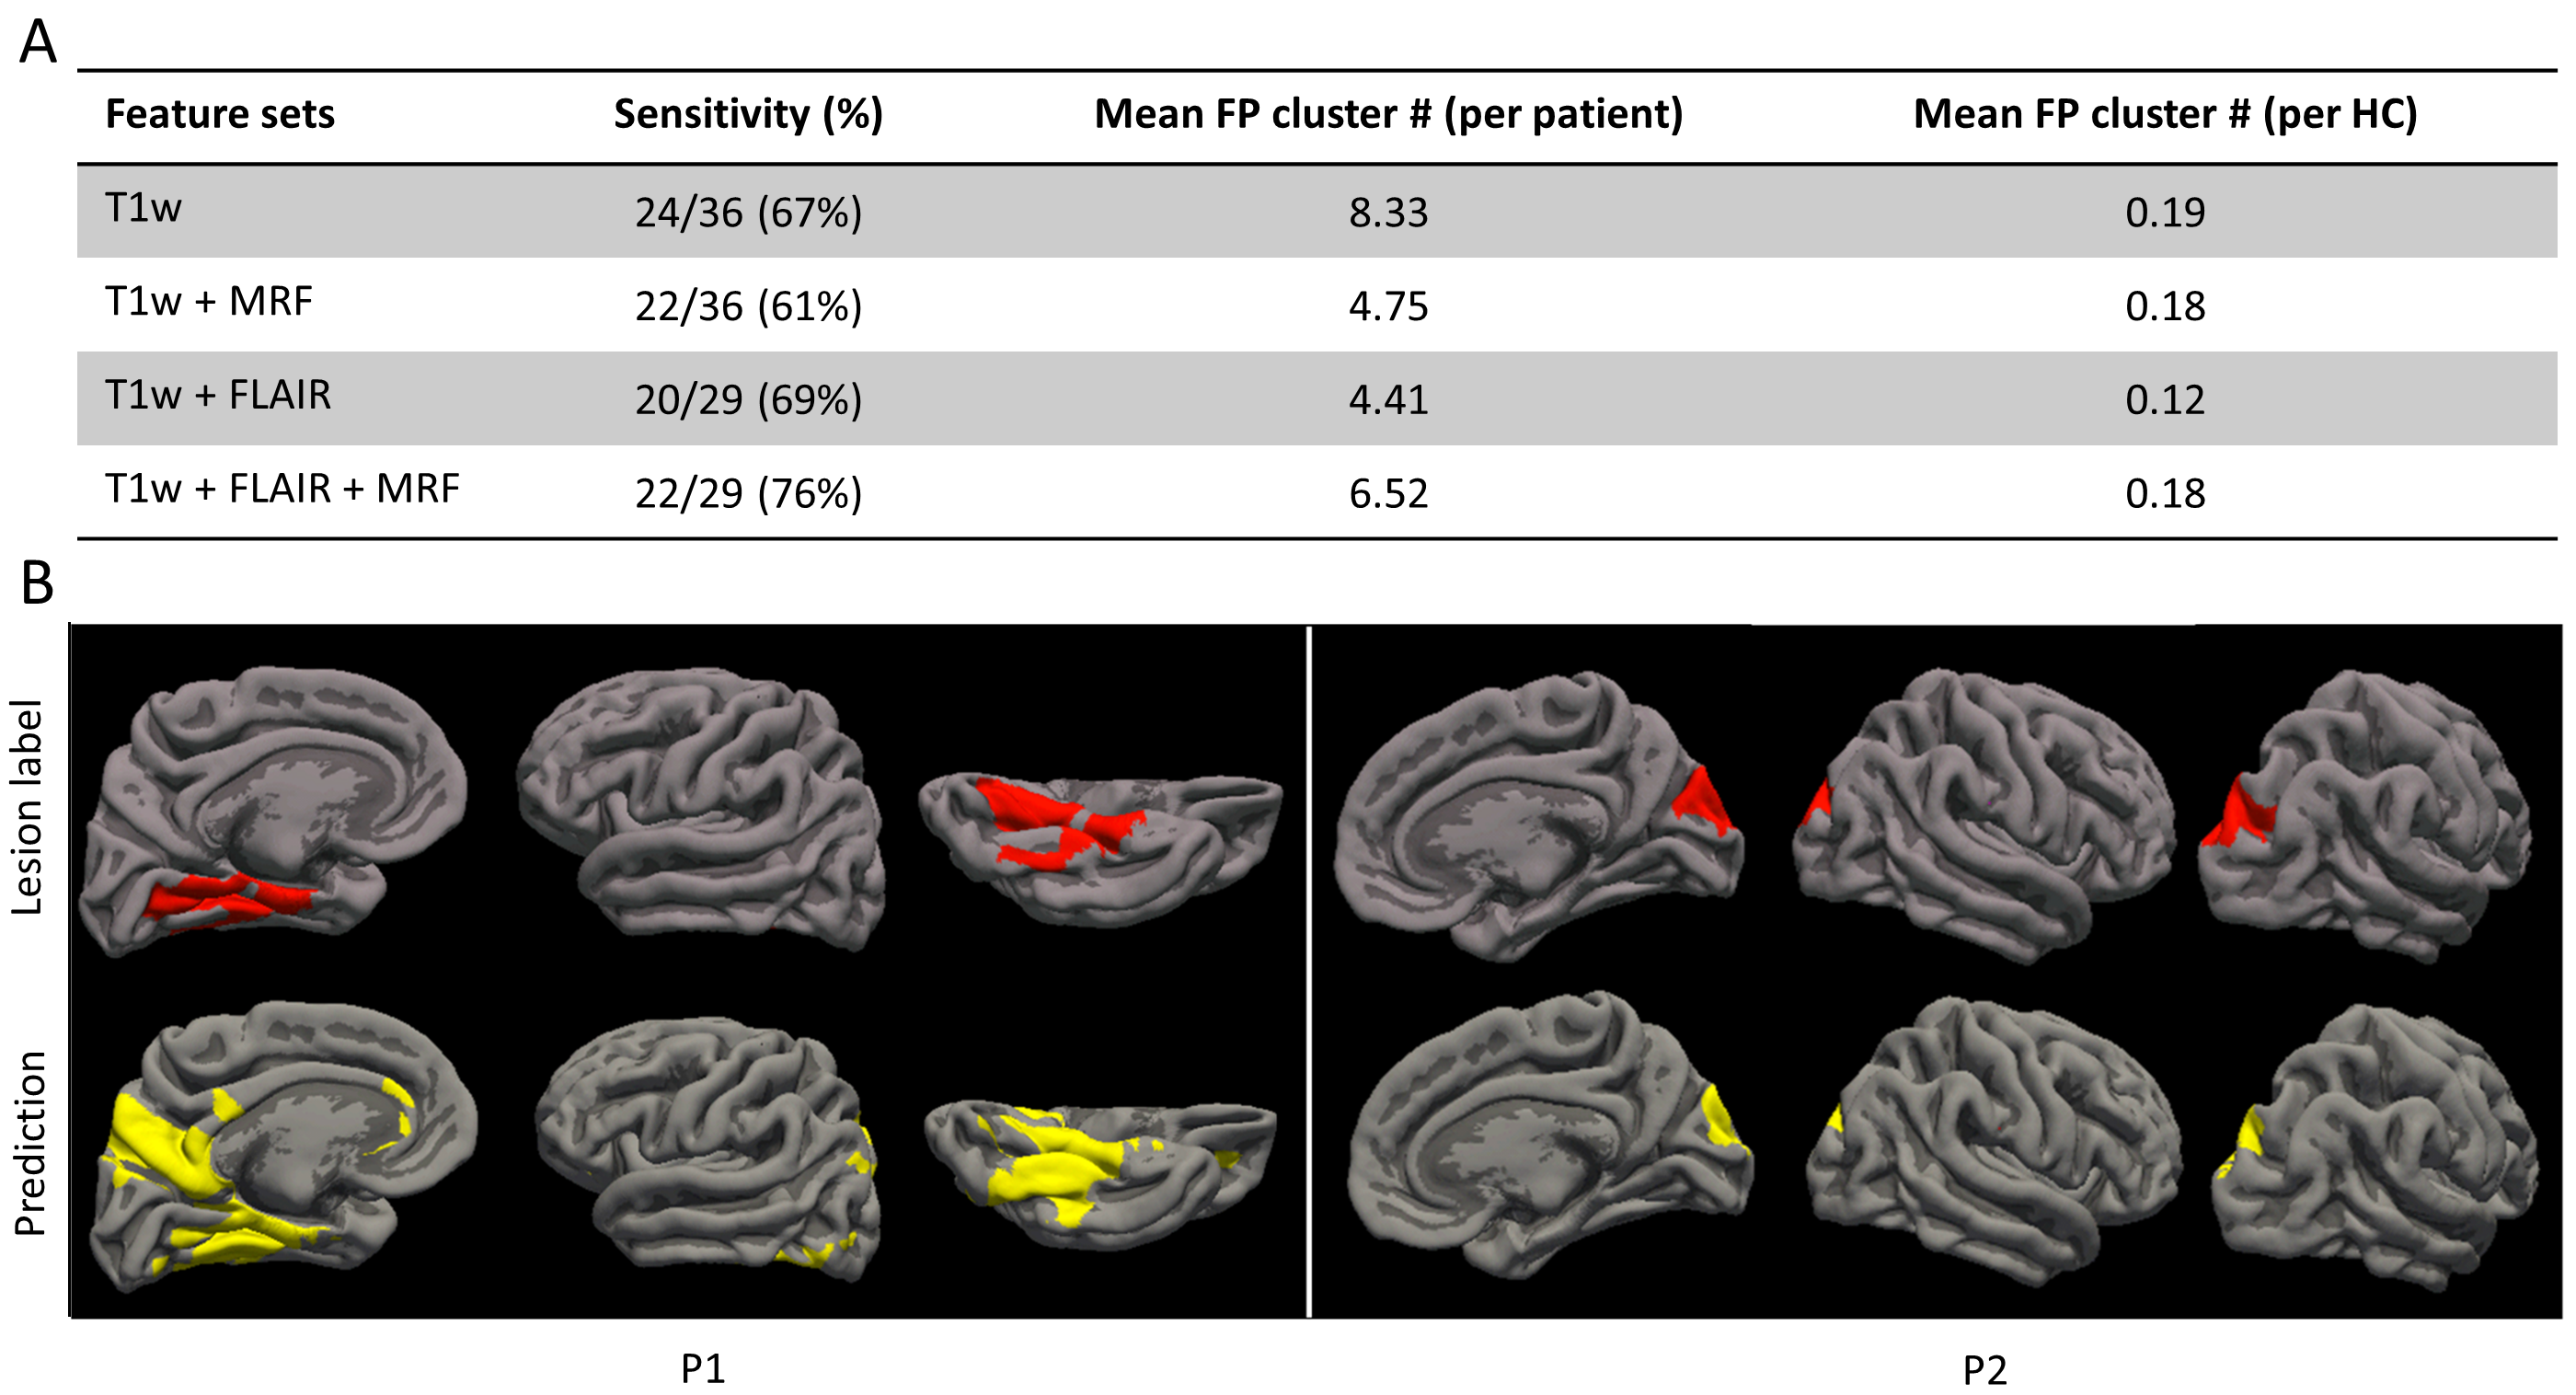
Figure 3 compares features from different feature sets using the uniform manifold approximation and projection (UMAP) algorithm. The best separation of patients from HCs is seen from MRF and FLAIR features. Figure 4 shows the area-under-curve (AUC) of receiver operating characteristic (ROC) plots for vertex-level model performances. A mean AUC of 0.70 was seen based on T1w features. When MRF features were added to the T1w features, the mean AUC was 0.74. When FLAIR features were added to the T1w features, the mean AUC was 0.79. The best performance was shown by using all features including T1w, FLAIR, and MRF, with a mean AUC of 0.8.Figure 5A shows cluster-wise performance following the second-stage classifier. Sensitivity was 67% based on T1w features alone, with 8.33 FP clusters per patient. With MRF features implemented, the sensitivity was 61%, with a reduced, 4.75 FP clusters per patient. With FLAIR features added, the sensitivity is 69%, with 4.41 FP clusters per patient. When T1w, MRF, and FLAIR were all implemented, the highest sensitivity was achieved at 76%, with 6.52 FP clusters per patient. Low FP clusters in HCs were seen in all feature sets. Figure 5B shows individual-level lesion detection for two example patients whose lesion overlapped with prediction output (P1: mMCD; P2: FCD IIb; both histologically confirmed).
Conclusion
Our study attempted for the first time to build a surface-based morphometric processing platform for automatic FCD detection using MRF data. The results showed that implementing MRF as well as FLAIR features with T1w features improved vertex-level prediction performance based on the neural network classifier. The 2nd-stage cluster-wise classifier showed efficacy to suppress FP clusters. Interim results of patient-level sensitivity of 76% and low false-positive clusters in controls supported the potential clinical applicability of the proposed framework. Work is ongoing to continue improving sensitivity and reducing FP clusters on the patient level.Acknowledgements
This study was supported by NIH R01 NS109439 and R21 EB026764.References
1. Ma D, Gulani V, Seiberlich N, et al. Magnetic resonance fingerprinting. Nature. 2013;495(7440):187-192.
2. Ma D, Jones SE, Deshmane A, et al. Development of high-resolution 3D MR fingerprinting for detection and characterization of epileptic lesions. J Magn Reson Imaging. 2019;49(5):1333-1346.
3. Avants B, Gee JC. Geodesic estimation for large deformation anatomical shape averaging and interpolation. Neuroimage. 2004;23(SUPPL. 1):S139-150. doi:10.1016/j.neuroimage.2004.07.010
4. Spitzer H, Ripart M, Whitaker K, et al. Interpretable surface-based detection of focal cortical dysplasias: a Multi-centre Epilepsy Lesion Detection study. Brain. Published online 2022:1-13. doi:10.1093/brain/awac224
5. Wagstyl K, Whitaker K, Raznahan A, et al. Atlas of lesion locations and postsurgical seizure freedom in focal cortical dysplasia: A MELD study. Epilepsia. 2022;63(1):61-74. doi:10.1111/epi.17130
Figures