0993
Quantitative MRI Interpretable 100D Feature Space of Knee Osteoarthritis1Department of Radiology and Biomedical Imaging, UCSF; University of California Berkeley–University of California San Francisco Graduate Program in Bioengineering, University of California, San Francisco; University of California Berkeley, San Francisco, CA, United States, 2Department of Radiology and Biomedical Imaging, UCSF, University of California, San Francisco, San Francisco, CA, United States
Synopsis
Keywords: Osteoarthritis, MSK, statistical shape modeling, cartilage thickness, cartilage T2, meniscus
While the Osteoarthritis Initiative data has been explored in independent studies, to our knowledge, never has such a comprehensive analysis been completed, investigating morphology of femur, patella, tibia, menisci, for biomarkers: cartilage thickness, cartilage T2, bone shape, and meniscus shape. With 4,796 subjects from the OAI, this study utilizes an automatic statistical shape modeling technique to create a 100D interpretable space of biomarker-tissue PC modes, which can be disseminated using an innovative opensource app. In combination with Image Twin and Clinical Twin analyses, variations in morphology, as well as clinical metadata, were identified as being significantly associated with osteoarthritis incidence.
INTRODUCTION
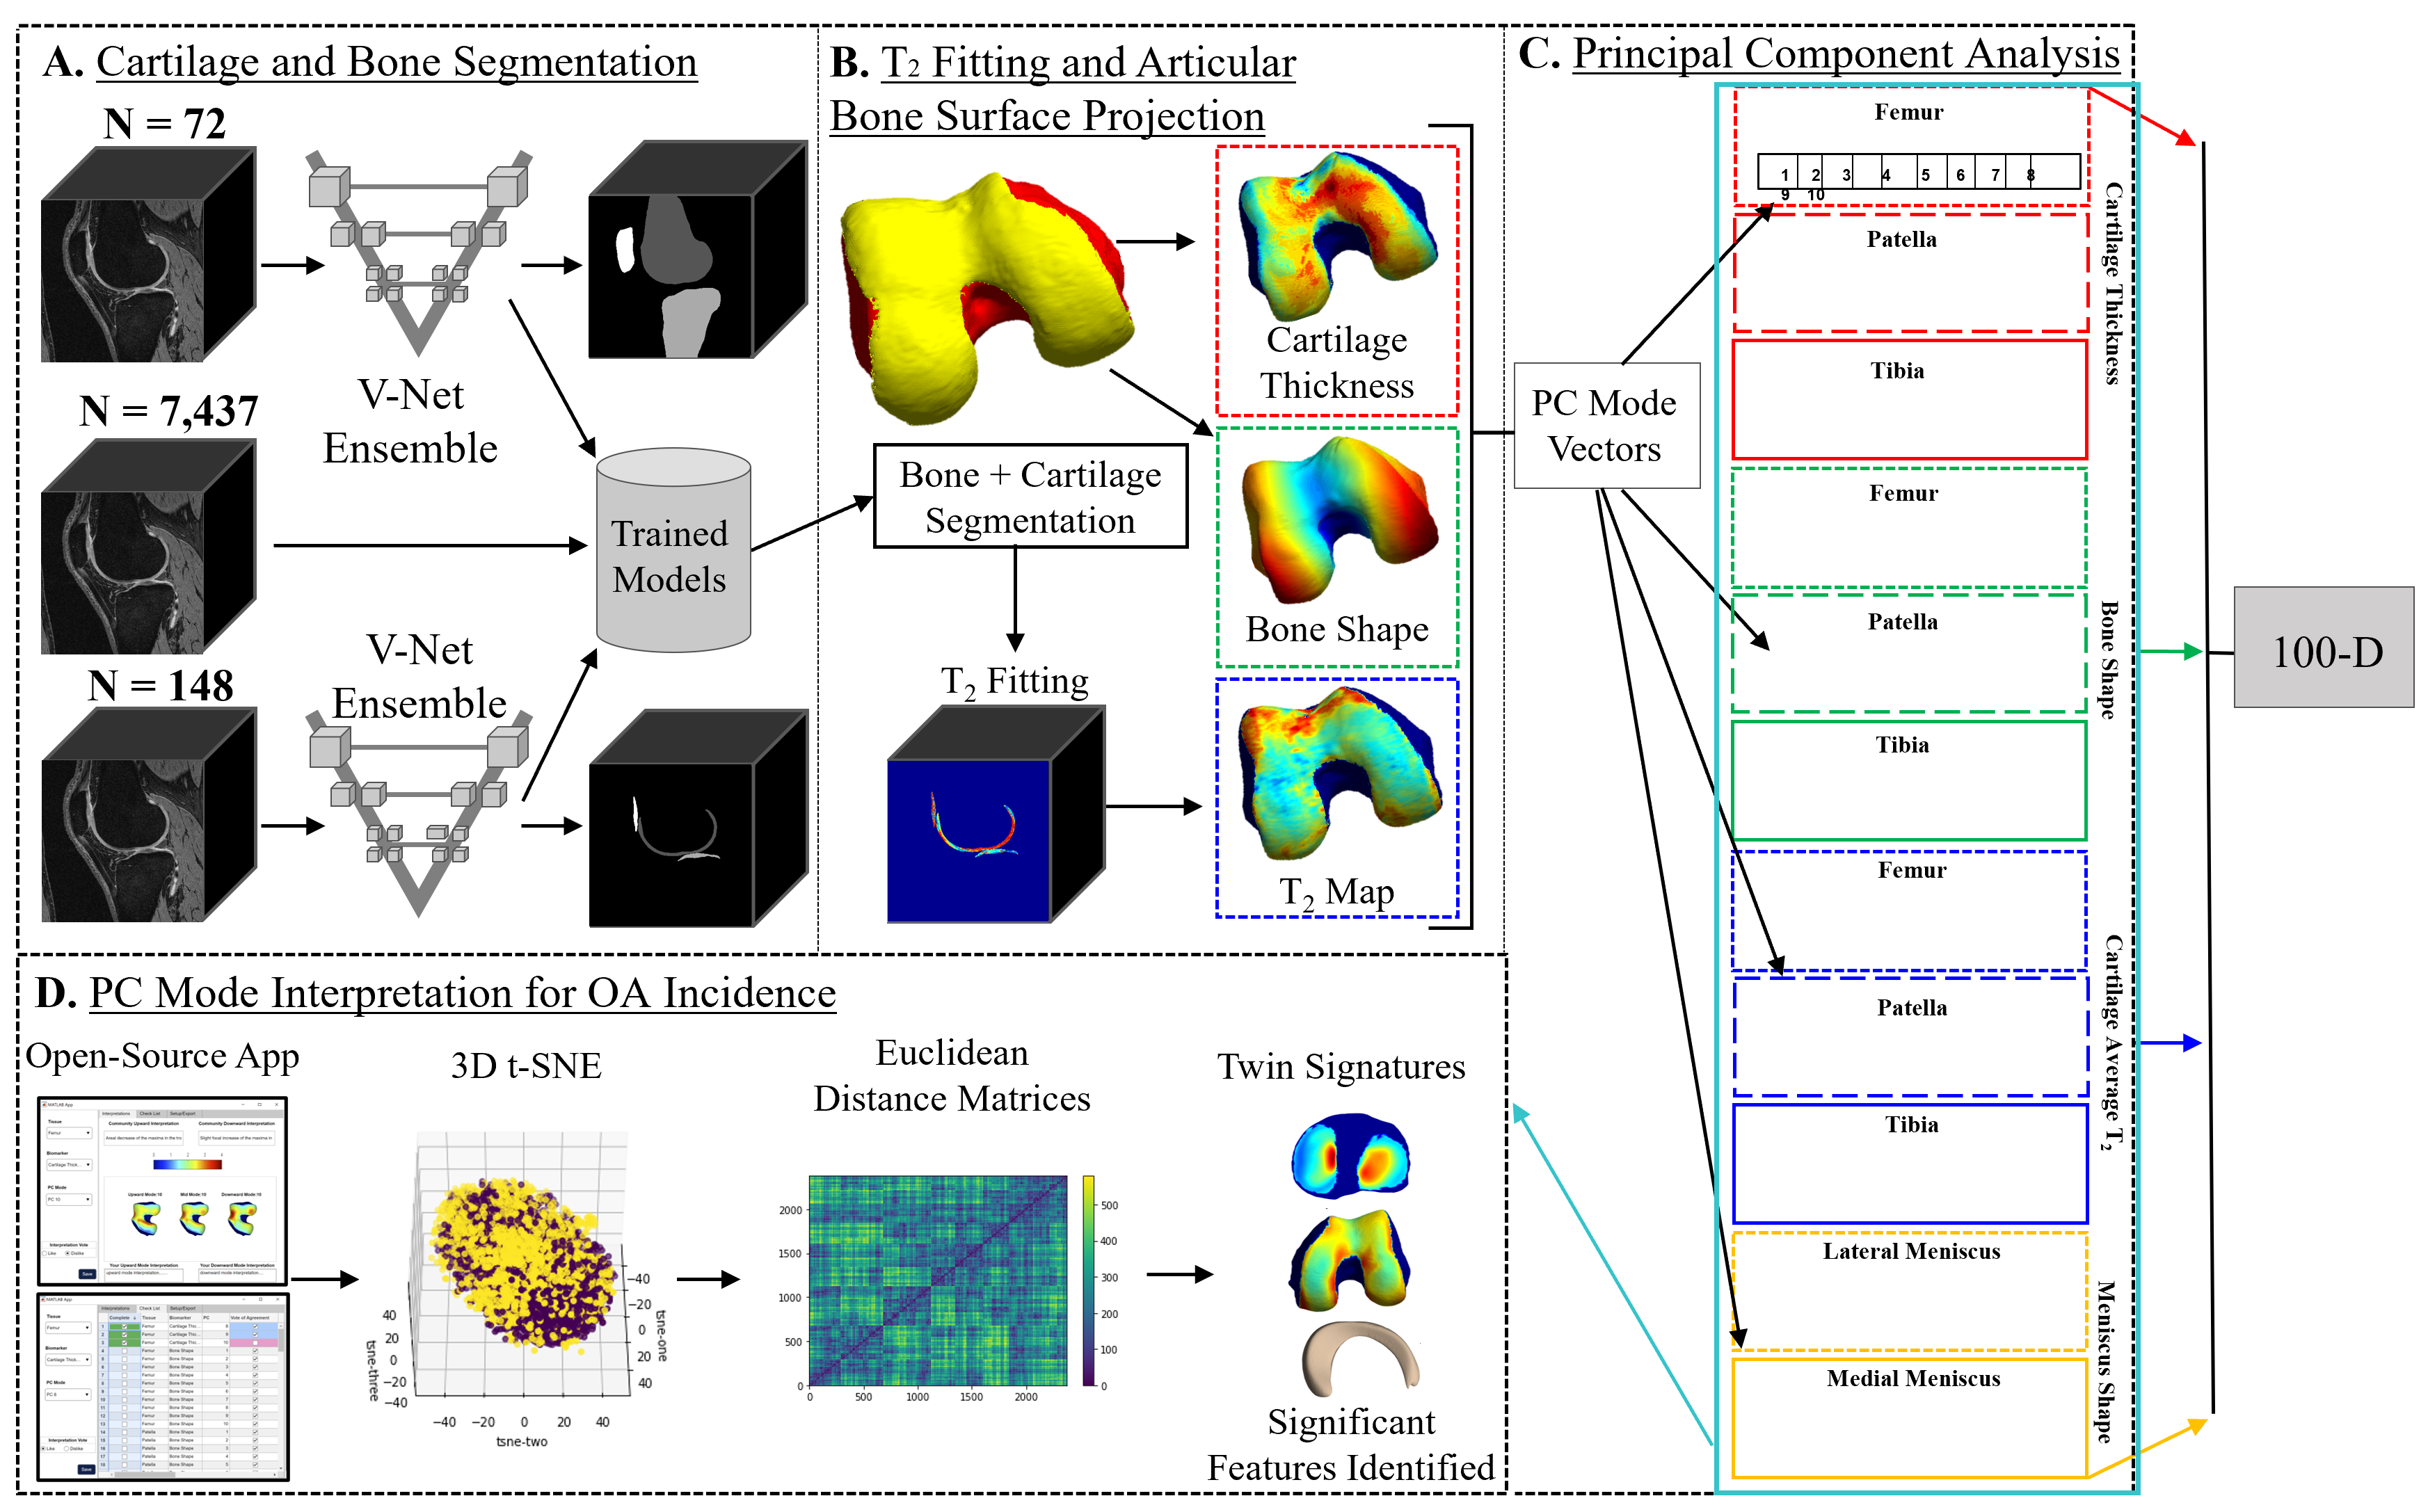
This study uses fully automatic Deep Learning segmentation and Principal Component Analysis (PCA) dimensionality reduction technique to identify variations in femur, patella, tibia, and meniscus morphology and relaxometry as precursors to the development of OA. We analyzed local pattern of multiple biomarkers including cartilage thickness, bone and meniscus shape, and T2 relaxation time of the cartilage of the entire Osteoarthritis initiative dataset (n = 4,796 subjects, 59,836 knee MRI). This study investigates the profile of subjects with identical multidimensional imaging or clinical signature.METHODS
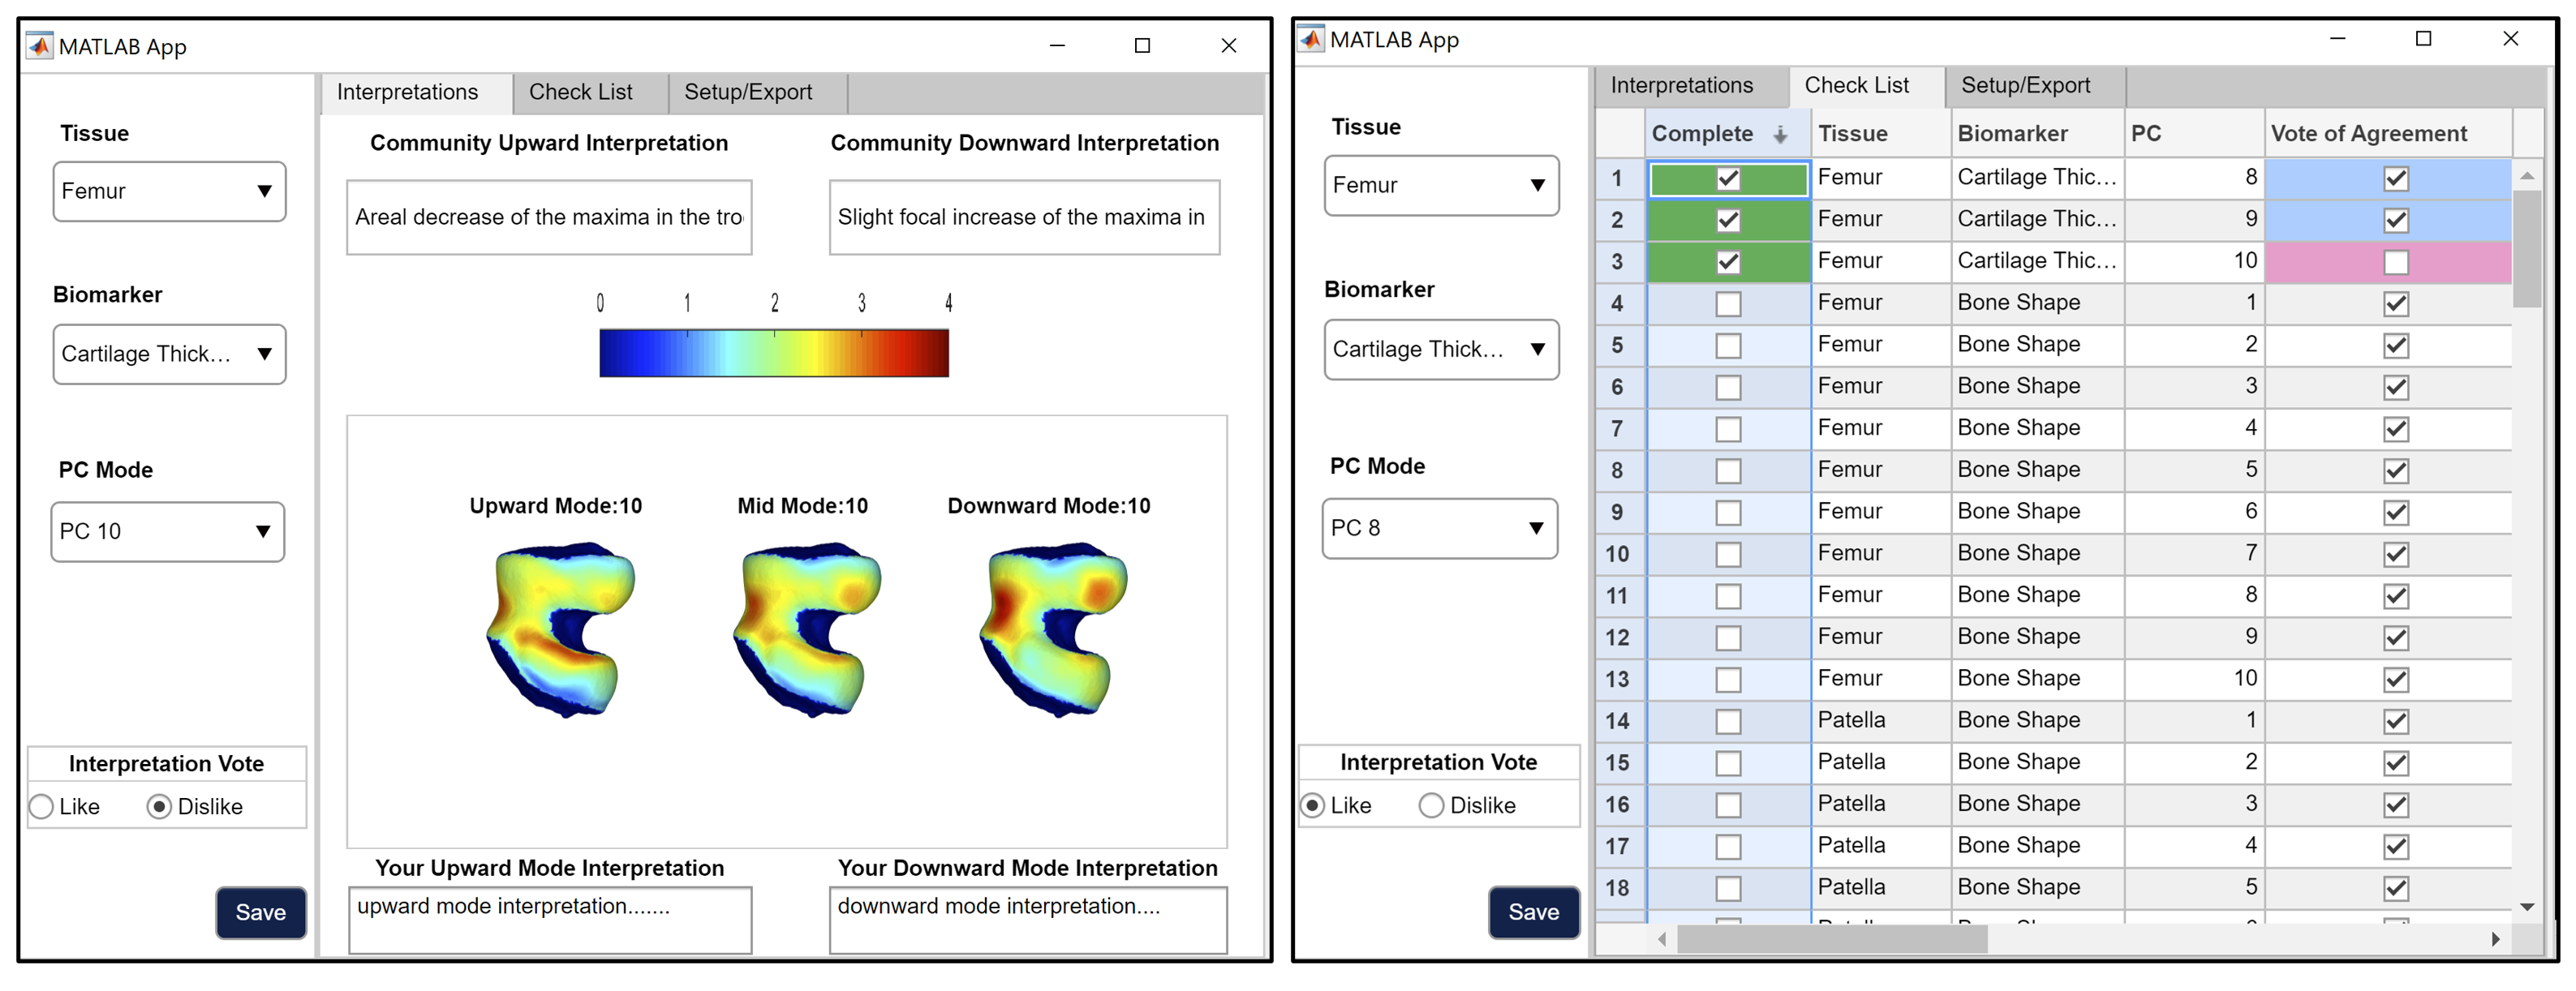
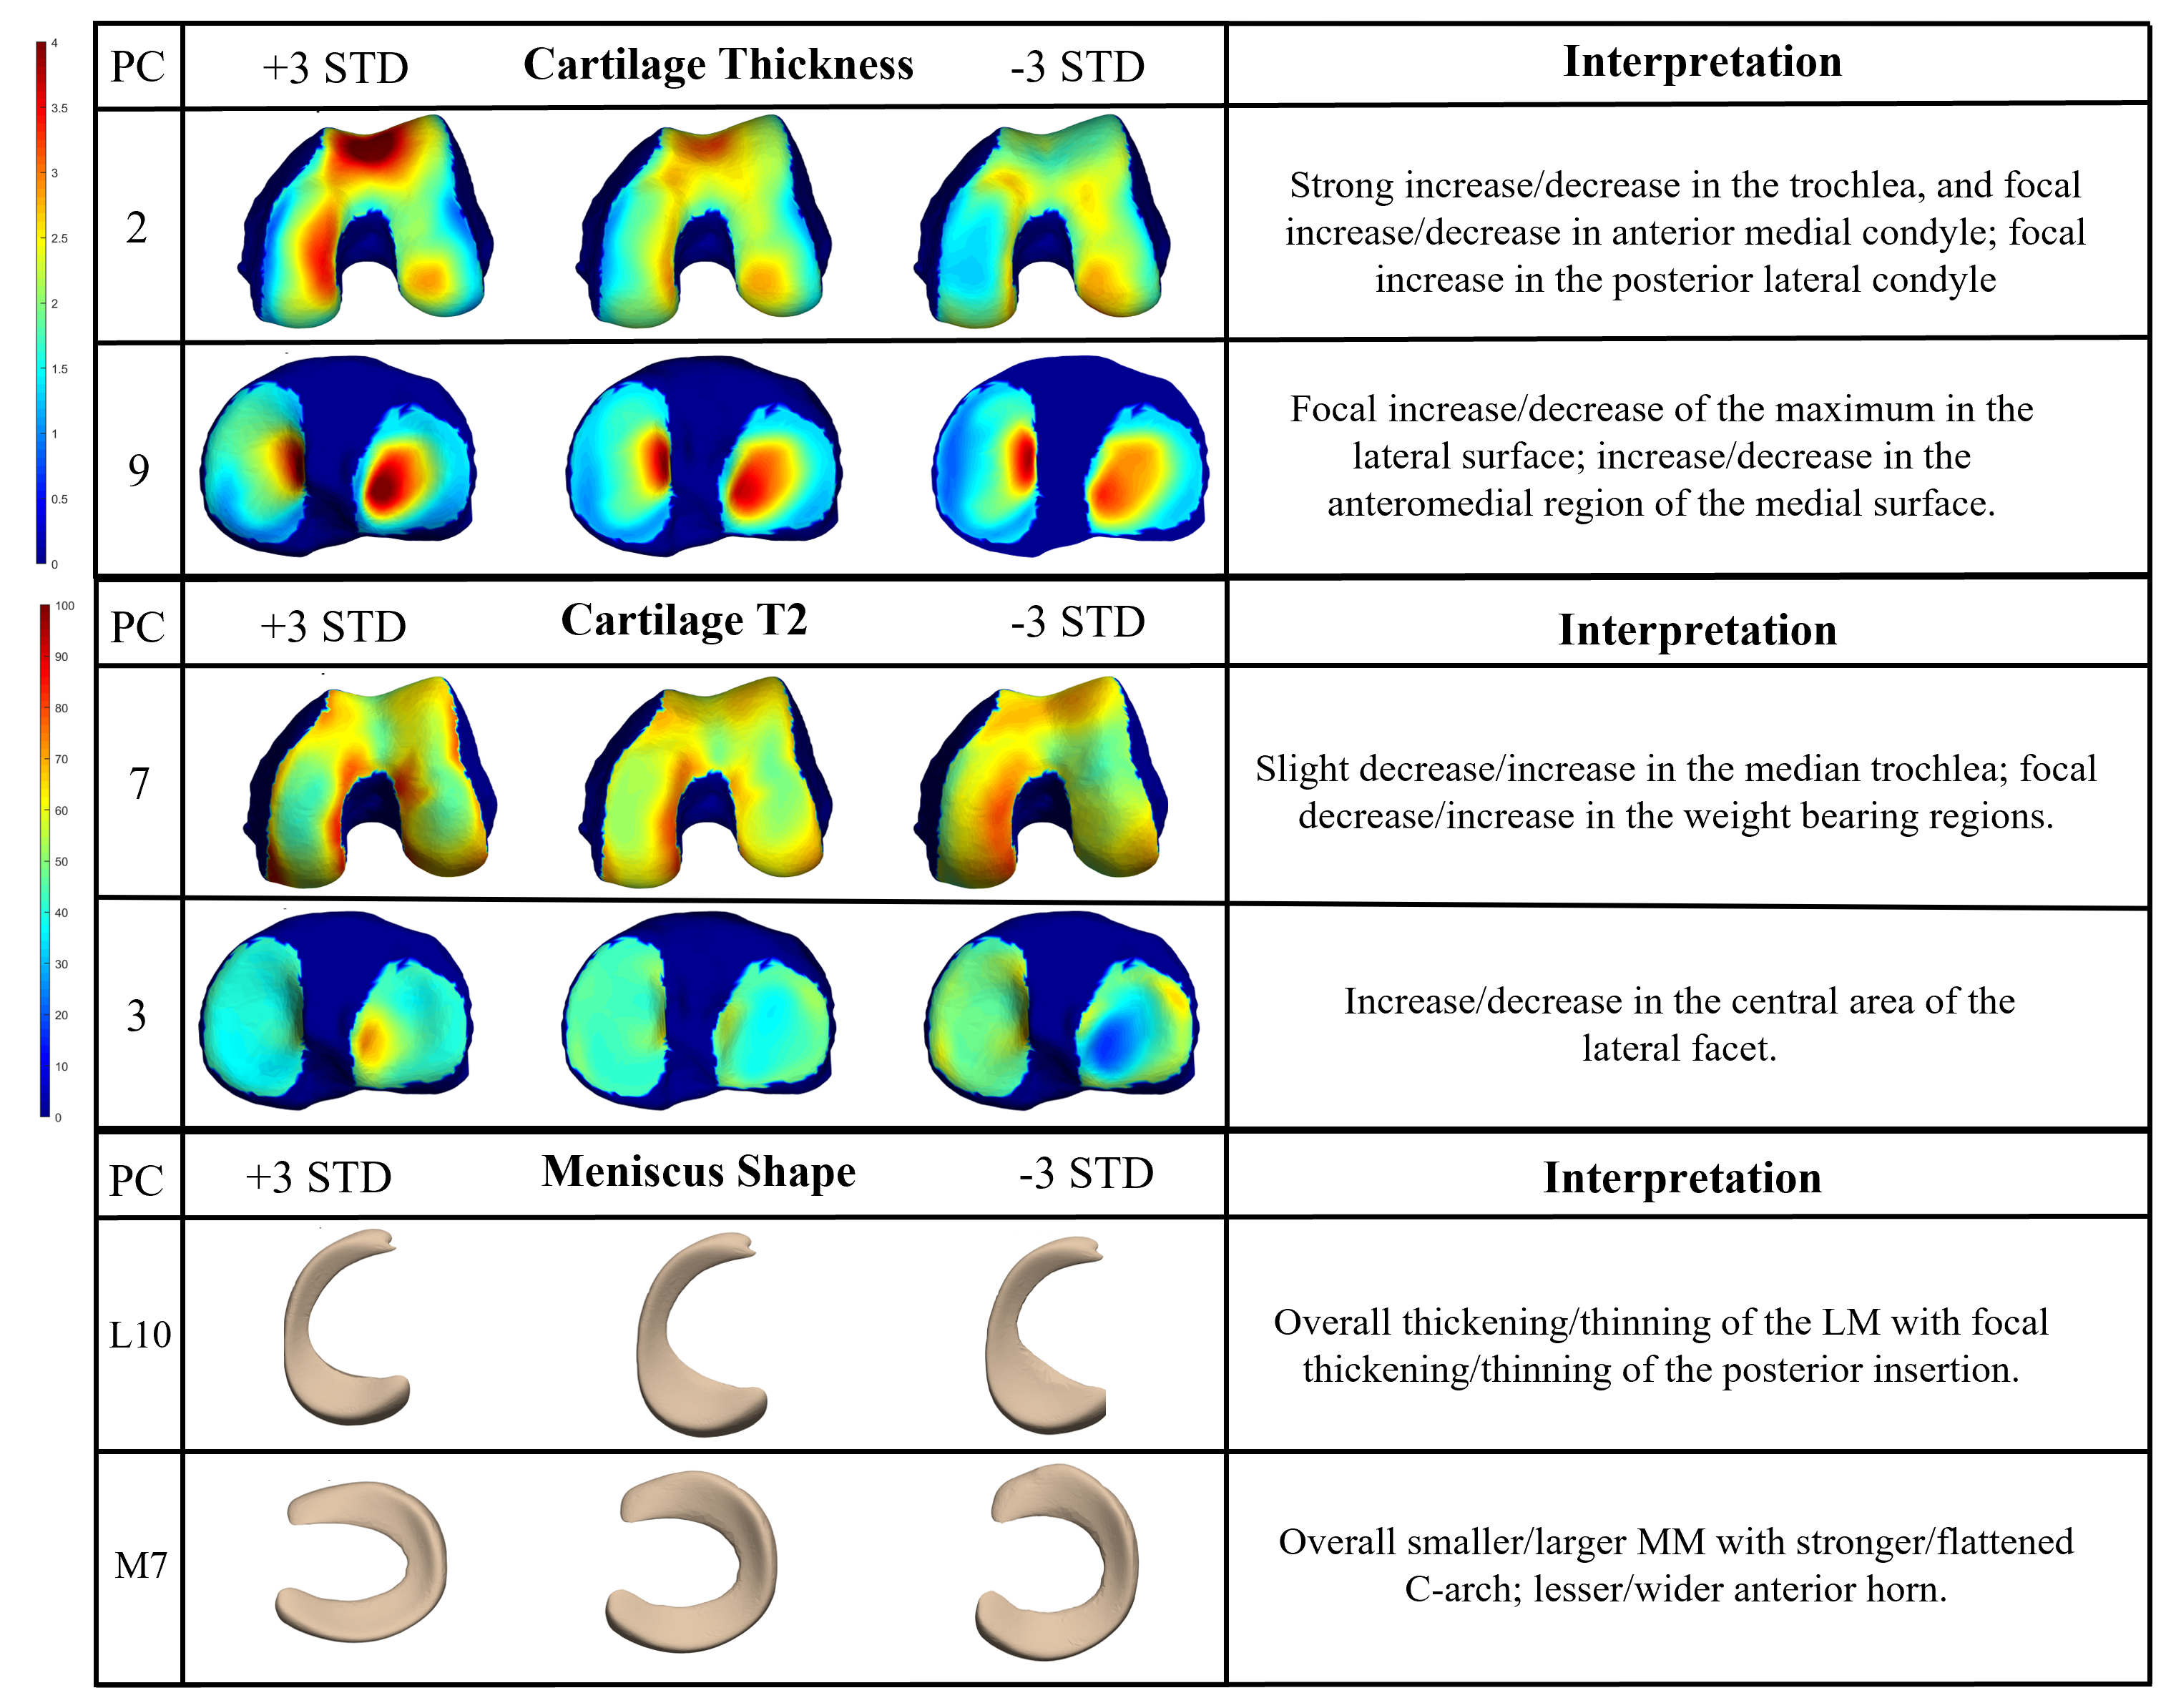
Dataset: The Osteoarthritis Initiative (OAI) dataset1 used for this study contains 3D double-echo steady-state (DESS) and 2D multi-slice multi-echo MRI knee scans from both knees of 4,796 unique patients at 12-time points, totaling n = 59,836 knee MRI. All the available images were processed and included in this study. Image Processing: Femur, patella, tibia, menisci, and femoral, patellar, and tibial cartilage were automatically segmented from DESS knee MRI by an ensemble of convolutional neural networks2,3. Cartilage thickness and T2 values were encoded to points on the subchondral bone surface by applying a Euclidean distance transform to the cartilage segmentation2 (Fig. 1). 100D Interpretable Space Analysis: Principal component analysis quantitively extracted cartilage thickness and T2 features from the femur, patella, and tibia, as well as from the surface data of femur, patella, tibia, and menisci, reducing the dimensionality of the data to 10 principal components (“modes”) that capture the most geometric variance; this process was conducted for each tissue-biomarker combination. Each mode of the 100D PCA space was analyzed and interpreted by a collective of radiologist experts through a distributed interactive application (Fig. 2).Image Twin Analysis: Baseline data for right-knee cases without missingness (n = 4,283 subjects) from the 100D PCA image space was used for statistical analysis. Two groups were constructed from this data subset a) Control (n = 326 subjects): knees with Kellgren-Lawrence grade (KLG) of 0 or 1 throughout participation in the OAI, and b) OA Incidence (n = 357 subjects): knees with KLG of 0 or 1 at baseline and subsequent development of OA (KLG > 1) within 8 years. The combination of these group PCA data was standardized and embedded in a 3D t-SNE space, and a Euclidean distance matrix was computed. Individuals of the OA Incidence group were located and paired to a control “imaging twin” of closest distance. Group analysis was performed using paired t-test for numerical values, and chi-squared test for categorical variables, to determine metadata features significantly associated (p < 0.05) with OA Incidence.
Clinical Twin Analysis: Demographic and clinical factors from baseline right-knee data (n = 2,474 subjects) were included in the following analysis. Two groups a) Control (n = 215 subjects), and b) OA Incidence (n = 238 subjects) were curated from this subset. The data with missingness under 5% were imputed with median or mode values for numerical and categorical variables, respectively; the data was standardized, embedded in a 3D t-SNE space, and used to compute a Euclidean distance matrix. Individuals of the OA incidence group were located and paired to a control “clinical twin” of closest distance. Group analysis was performed using paired t-test to determine tissue-biomarker PC features significantly associated (p < 0.05) with OA incidence.
RESULTS
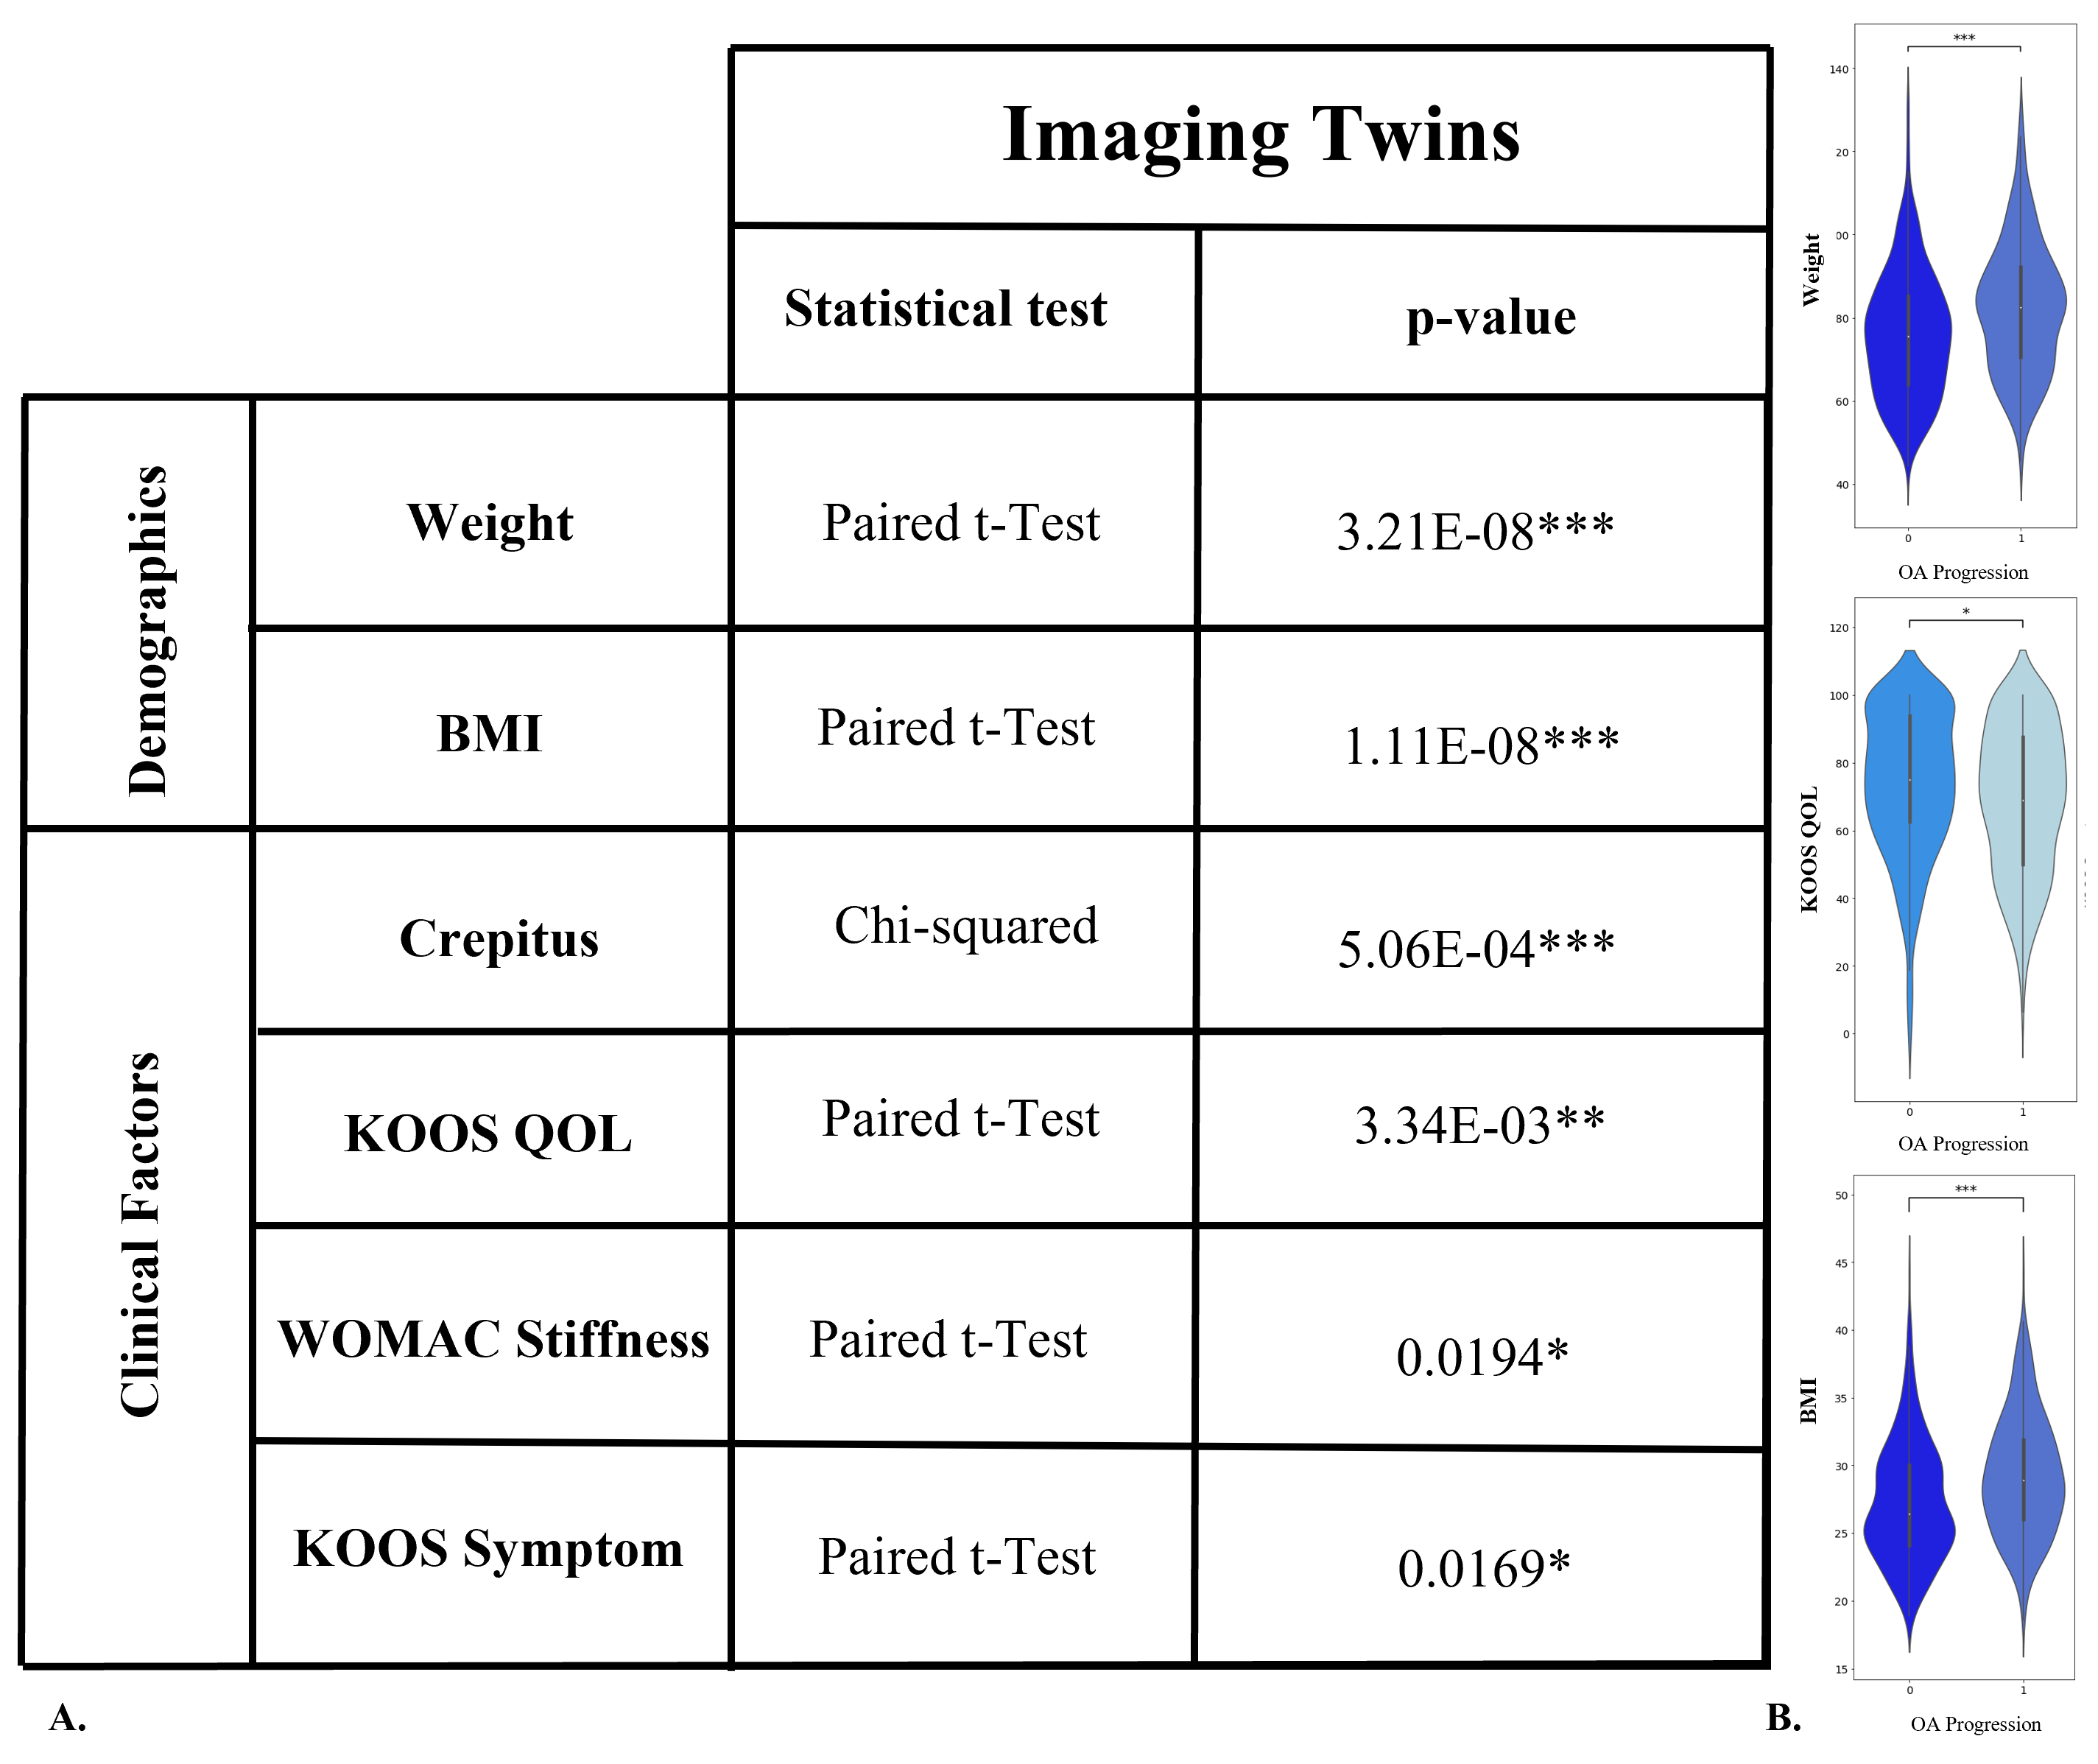
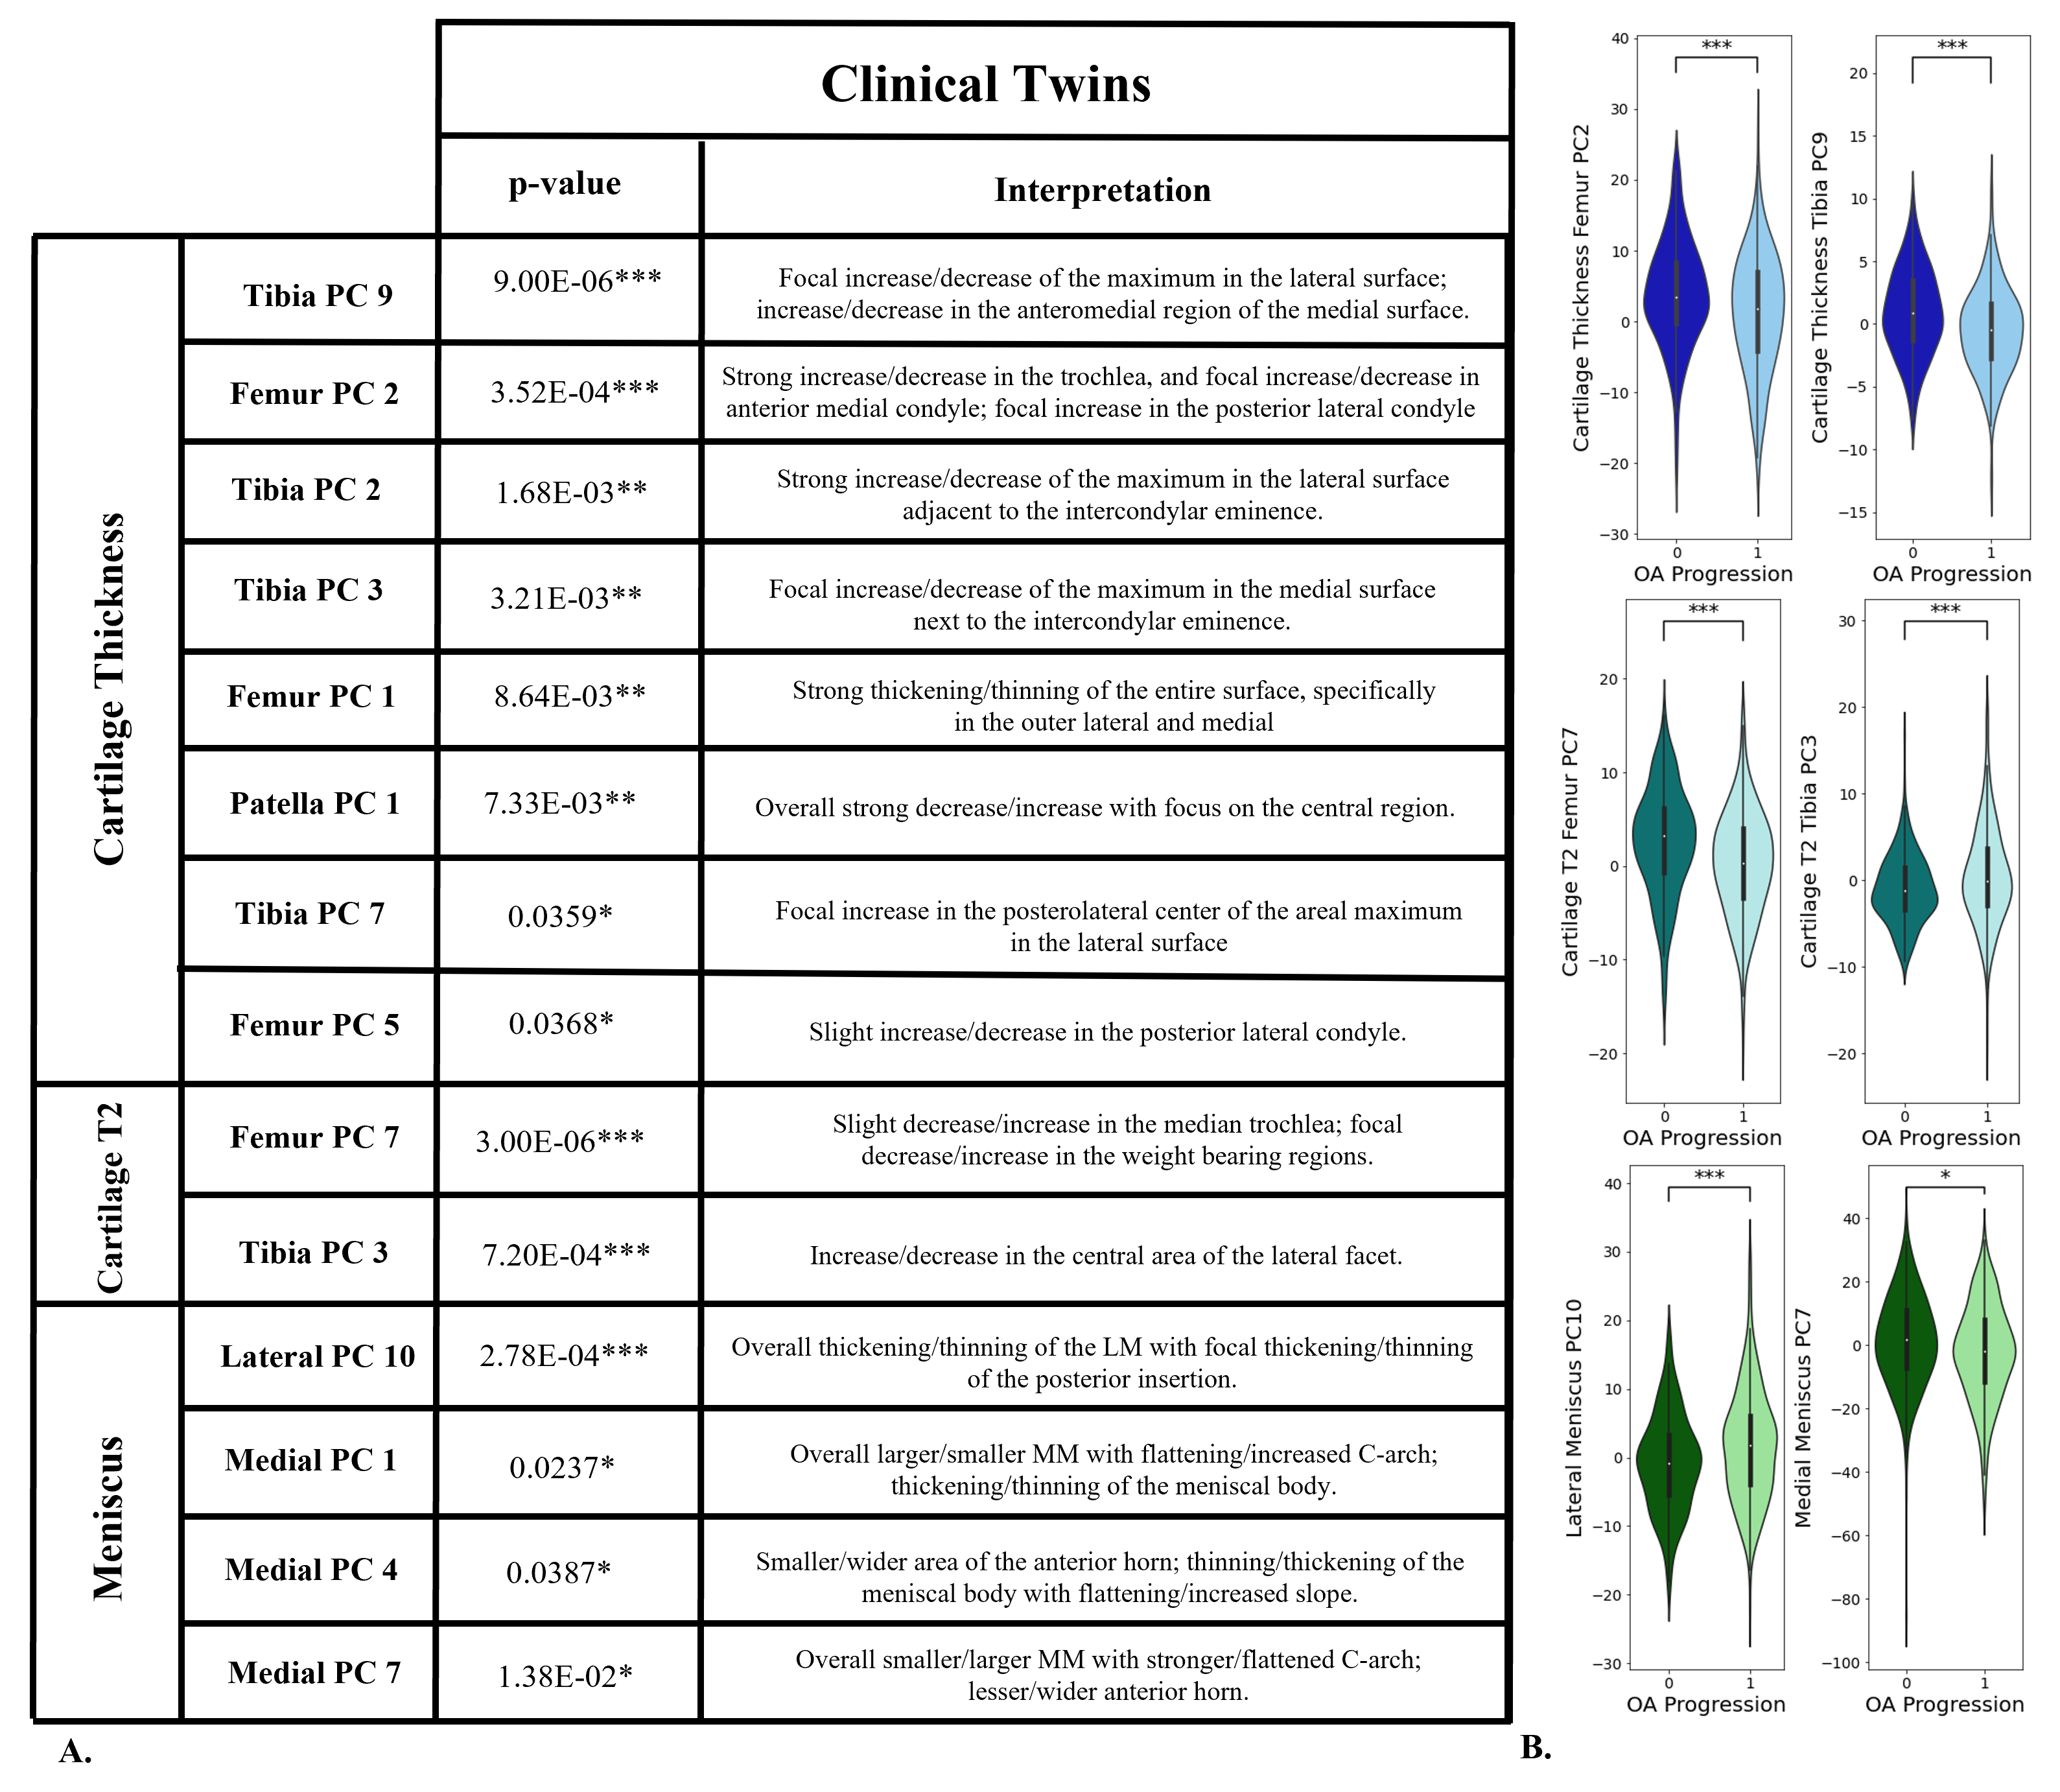
Image Twin Analysis: Six of twenty OA demographic and clinical factors were found to be significantly different between the OA incidence group and their associated control pairing of identical imaging signature (FIG. 3). The OA incidence twin is characterized by having a higher average weight, BMI, and incidence of crepitus while having a lower average KOOS quality of life score. Furthermore, experience of stiffness was rated more highly, while the KOOS symptoms score was on average lower, representing fewer problems. Clinical Twin Analysis: Fourteen of 100 modes were found to be significantly different between the control and OA incidence groups (FIG. 4). Two cartilage T2 modes, six cartilage thickness modes, and four meniscus shape modes were among those identified as being significantly different between clinical twin groups. When characterizing said groups, differences in trochlea and medial femur thickness and T2 are evident.DISCUSSION
The Image Twin Analysis identified weight, BMI, crepitus, and KOOS QOL as strongly related to OA incidence; such results coincide with previous studies. Regarding the twin clinical signatures, fourteen PC modes were identified as strongly related to OA incidence. The first PC of cartilage thickness and T2 are not predictors, thus the average thickness and T2 are not considered when matching clinical variables between twins. Rather, a better predictor of OA is found in the differences of trochlea and medial femoral thickness and T2 (FIG. 5). Additionally, though typically overlooked, several meniscus shape features were found to be relevant components of the difference between patients with clinical twin signatures and diverging OA progression; these features should be considered in future studies.CONCLUSION
This study explores the profile of subjects with Twin Image and Clinical Signatures, seeking to identify imaging and clinical factors which may provide insight into the divergent future trajectory of those with identical signatures. These findings may uncover relationships between knee morphology, demographics, and knee joint degeneration.Acknowledgements
This work is supported by the National Institute of Arthritis and Musculoskeletal and Skin Diseases (grant #s: R00AR070902 and R33AR073552).References
1. Pedoia V, Lee J, Norman B, Link TM, Majumdar S. Diagnosing osteoarthritis from T2 maps using deep learning: an analysis of the entire Osteoarthritis Initiative baseline cohort. Osteoarthritis Cartilage. 2019 Jul;27(7):1002-1010.
2. Iriondo C, Liu F, Calivà F, Kamat S, Majumdar S, Pedoia V. Towards understanding mechanistic subgroups of osteoarthritis: 8-year cartilage thickness trajectory analysis. J Orthop Res. 2021 Jun;39(6):1305-1317.
3. Morales Martinez A, Caliva F, Flament I, Liu F, Lee J, Cao P, Shah R, Majumdar S, Pedoia V. Learning osteoarthritis imaging biomarkers from bone surface spherical encoding. Magn Reson Med. 2020 Oct;84(4):2190-2203.
Figures