0979
Explainable artificial intelligence for automatic detection of early nasopharyngeal carcinoma on MRI1Department of Imaging and Interventional Radiology, The Chinese University of Hong Kong, Hong Kong, Hong Kong, 2Department of Health Technology and Informatics, The Hong Kong Polytechnic University, Hong Kong, Hong Kong, 3Department of Chemical Pathology, The Chinese University of Hong Kong, Hong Kong, Hong Kong, 4State Key Laboratory of Translational Oncology, The Chinese University of Hong Kong, Hong Kong, Hong Kong
Synopsis
Keywords: Machine Learning/Artificial Intelligence, Screening, XAI, explainability, deep learning
In this study, we propose a simple method to improve the explainability of artificial intelligence, specifically convolutional neural networks (CNNs), for the automatic detection of early nasopharyngeal carcinoma (NPC) on magnetic resonance imaging (MRI). We show a long-short-term-memory (LSTM) unit can be introduced into a CNN to read 3-dimensional medical image series. A risk curve can be extracted from the LSTM to visualize the “thought process” of the network when it reads through the input MRI slice-by-slice. This modification improves the explainability of the network without reducing performance for the early NPC detections of the original CNN.Introduction
Early detection of nasopharyngeal carcinoma (NPC) can markedly reduce the mortality and morbidity of treatment complications. Magnetic resonance imaging (MRI) can detect up to 38.1% more early NPCs when compared to the endoscopy [1, 2], which is the current investigation of choice for individuals who are Epstein-Barr Virus DNA positive on an NPC screening blood test [3, 4]. To expand the role of MRI in early detection, our team has previously investigated artificial intelligence (AI) algorithms to automatically diagnose and reduce costs [5-7]. However, despite these algorithms as well as those proposed by other research teams [8, 9] performed remarkably in these tasks, they inevitably lack explainability because of their complex model structure comprising millions of learnable parameters. The explainability issue is currently one of the major factors that has prevented the implementation of these deep learning methods in clinical workflows.In this study, we propose a method to improve the explainability of convolutional neural network (CNN) algorithms for the automatic diagnosis of NPC on MRI. It requires simply an additional long short-term memory (LSTM), which enables visualization of the network’s “thought process” and localization of key slices that determined the AI’s prediction and could aid understanding of the results.
Methods
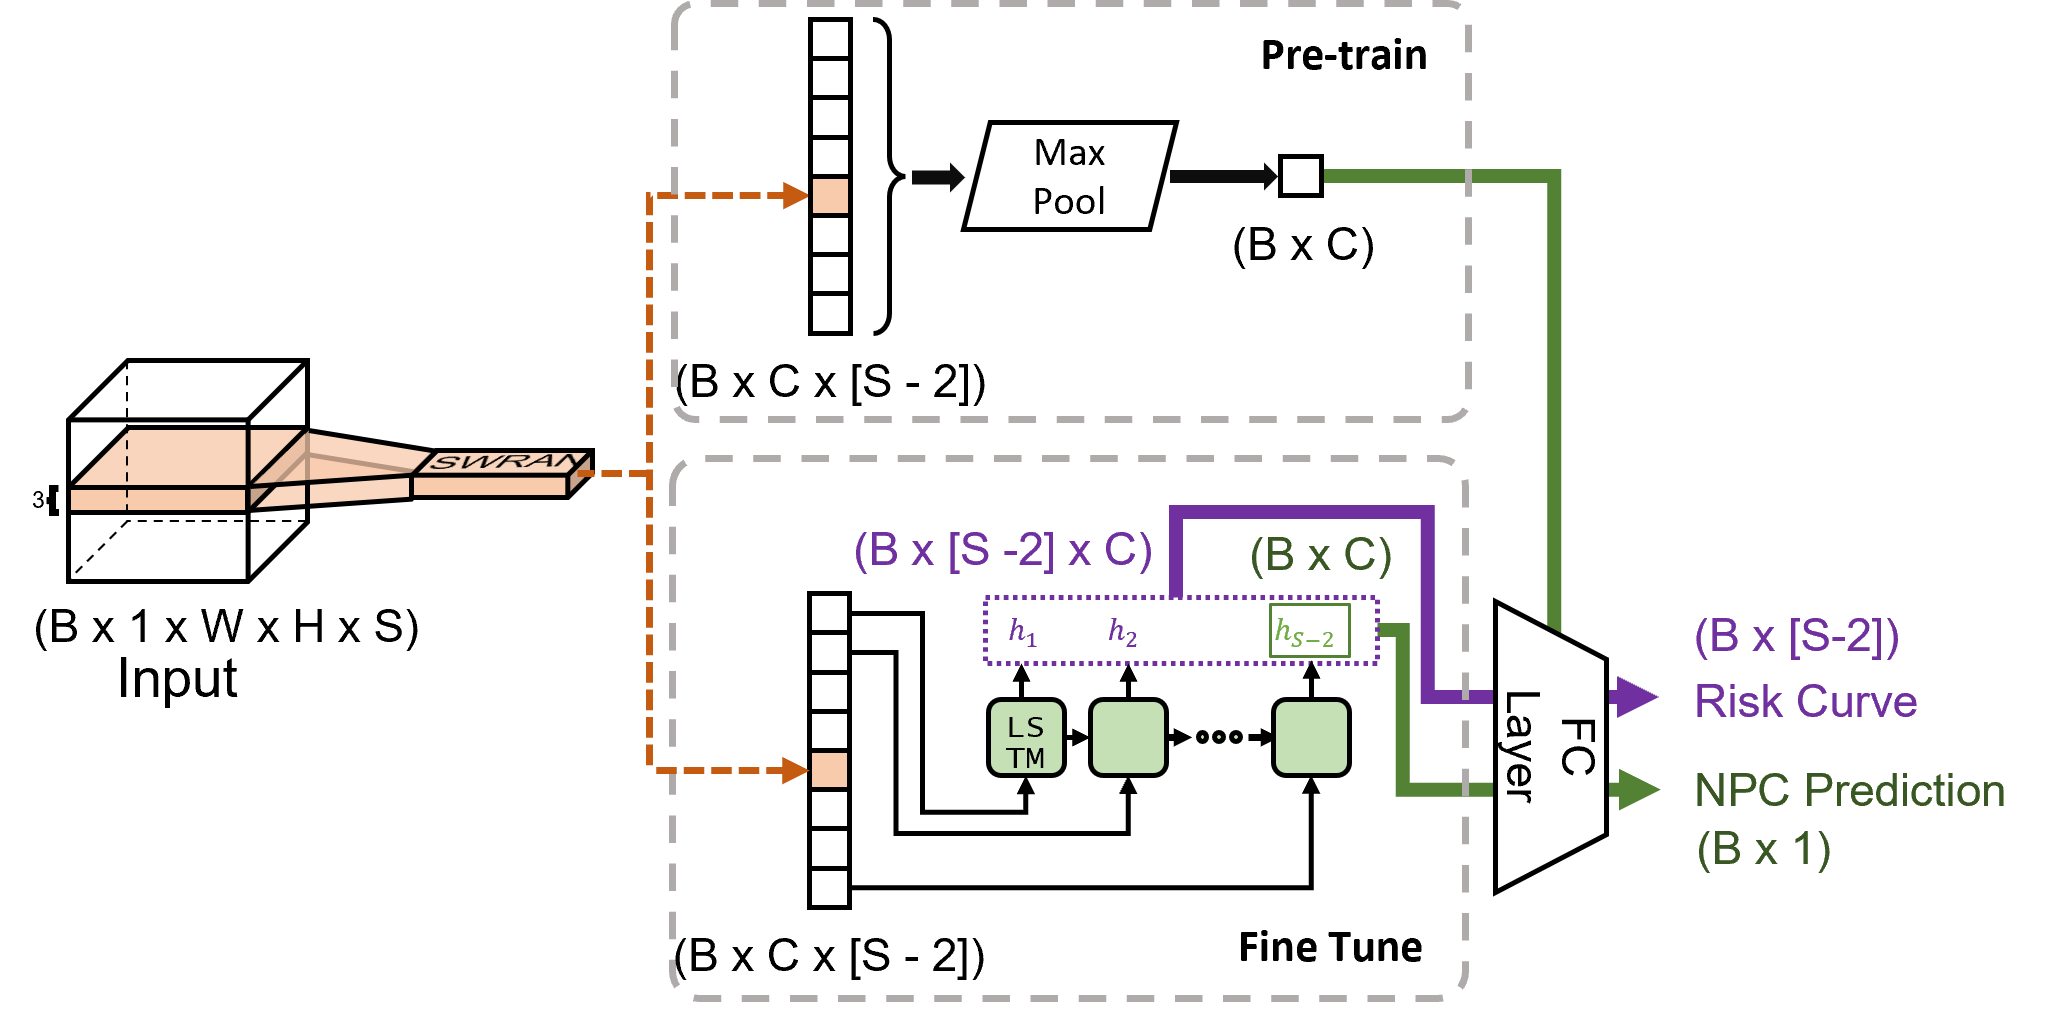
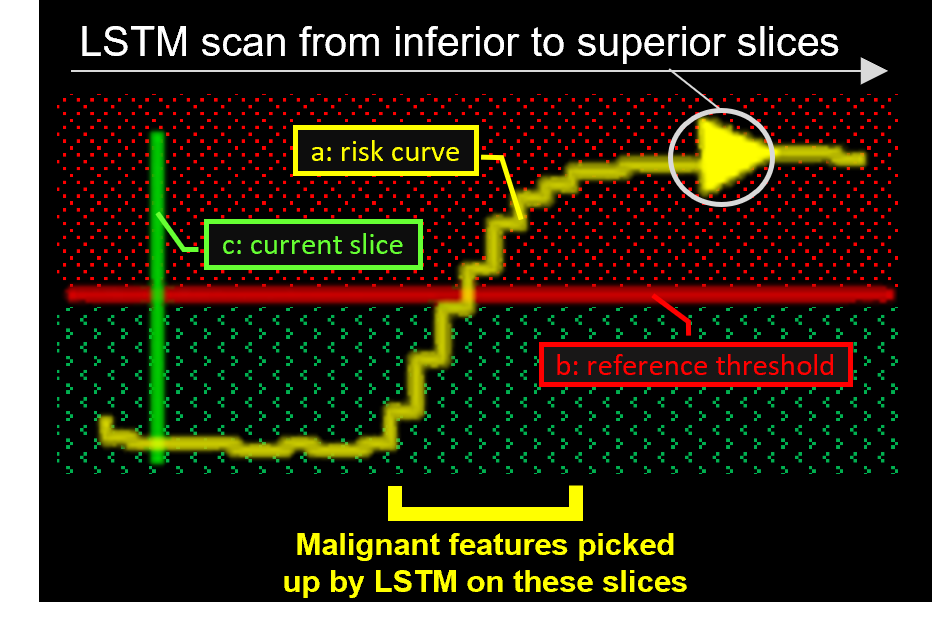
Model architectureWe introduced an LSTM unit to our previously proposed slice-wise residual attention network (SWRAN) [7, 10], inserted before the output linear layer and replacing the original max-pooling layer for improving explainability. On receiving MRI images, the original SWRAN encoded the input slice-by-slice which were then read sequentially by the additional LSTM to identify NPC. The prediction obtained from individual slices has the advantage over a single prediction from all slices in that it can indicate how the network shifted between an NPC positive or negative prediction while it scans through the slices. This shift can be visualized as a “risk curve” to improve explainability. Detailed architecture and a legend of the risk curve is given in Figure 1 and Figure 2, respectively.
This network was trained in two steps. First, the original SWRAN without the LSTM was pre-trained. Then, the convolutional kernels were fixed to finetune only the LSTM and the output layer of the network (Figure 1).
Patients for validation of performance
We retrospectively included 884 patients previously scanned for suspected NPC using the T2-weighted fat-suppressed sequence in our center on either a 1.5T or 3.0T MRI scanner, of which 316 had stage I/II NPC and 568 had benign hyperplasia/normal nasopharynx without NPC. These patients were divided with stratification to NPC status into training, testing and validation sets at a ratio of roughly 7:2:1 (620:176:88). Finally, the diagnostic performance of the pre-trained and finetuned network was evaluated over the testing set through receiver operator characteristics (ROC) analysis.
Assessment of the risk curves
An expert in head and neck imaging inspected the risk curves of the testing set and summarized qualitatively the patterns and characteristics of the curves in NPC and benign hyperplasia/normal subjects.
Results
Diagnostic performanceSensitivity, specificity, accuracy and area under the ROC curve (AUC) of the pre-trained network were 91.3%, 94.4%, 93.2% and 0.981, respectively; and those of the fine-tuned network with LSTM were 95.7%, 91.6%, 93.2% and 0.976, respectively.
Assessment of the risk curve
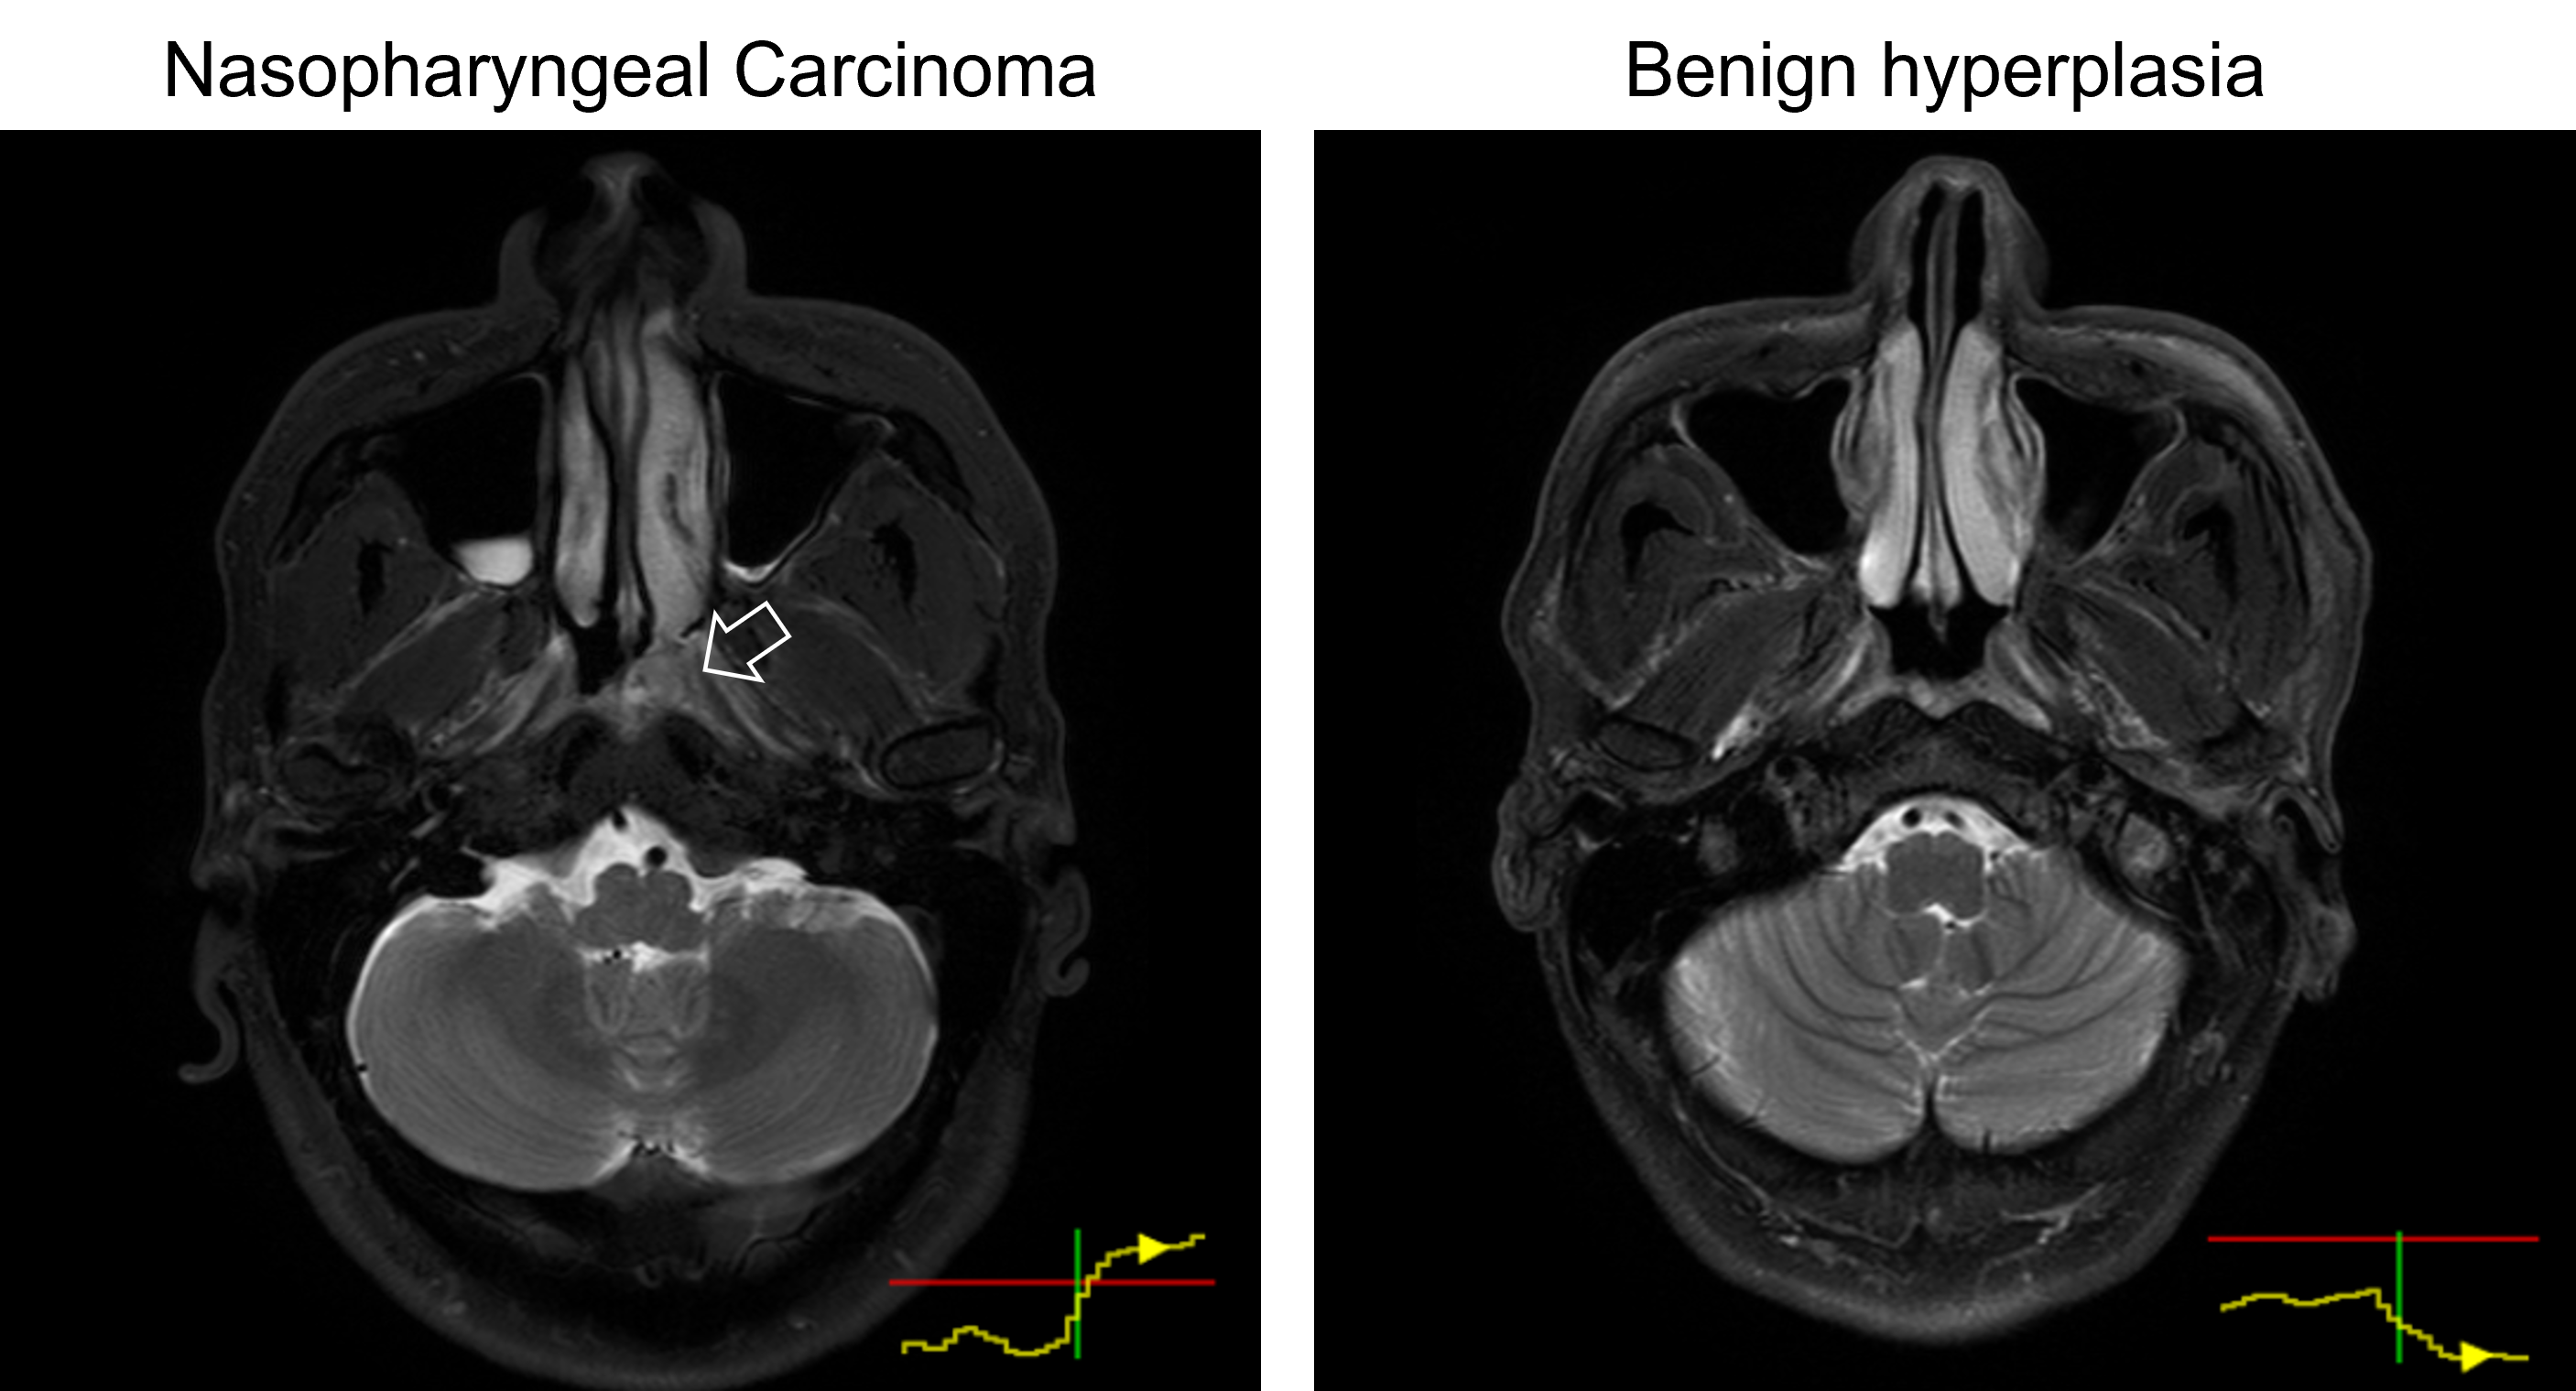
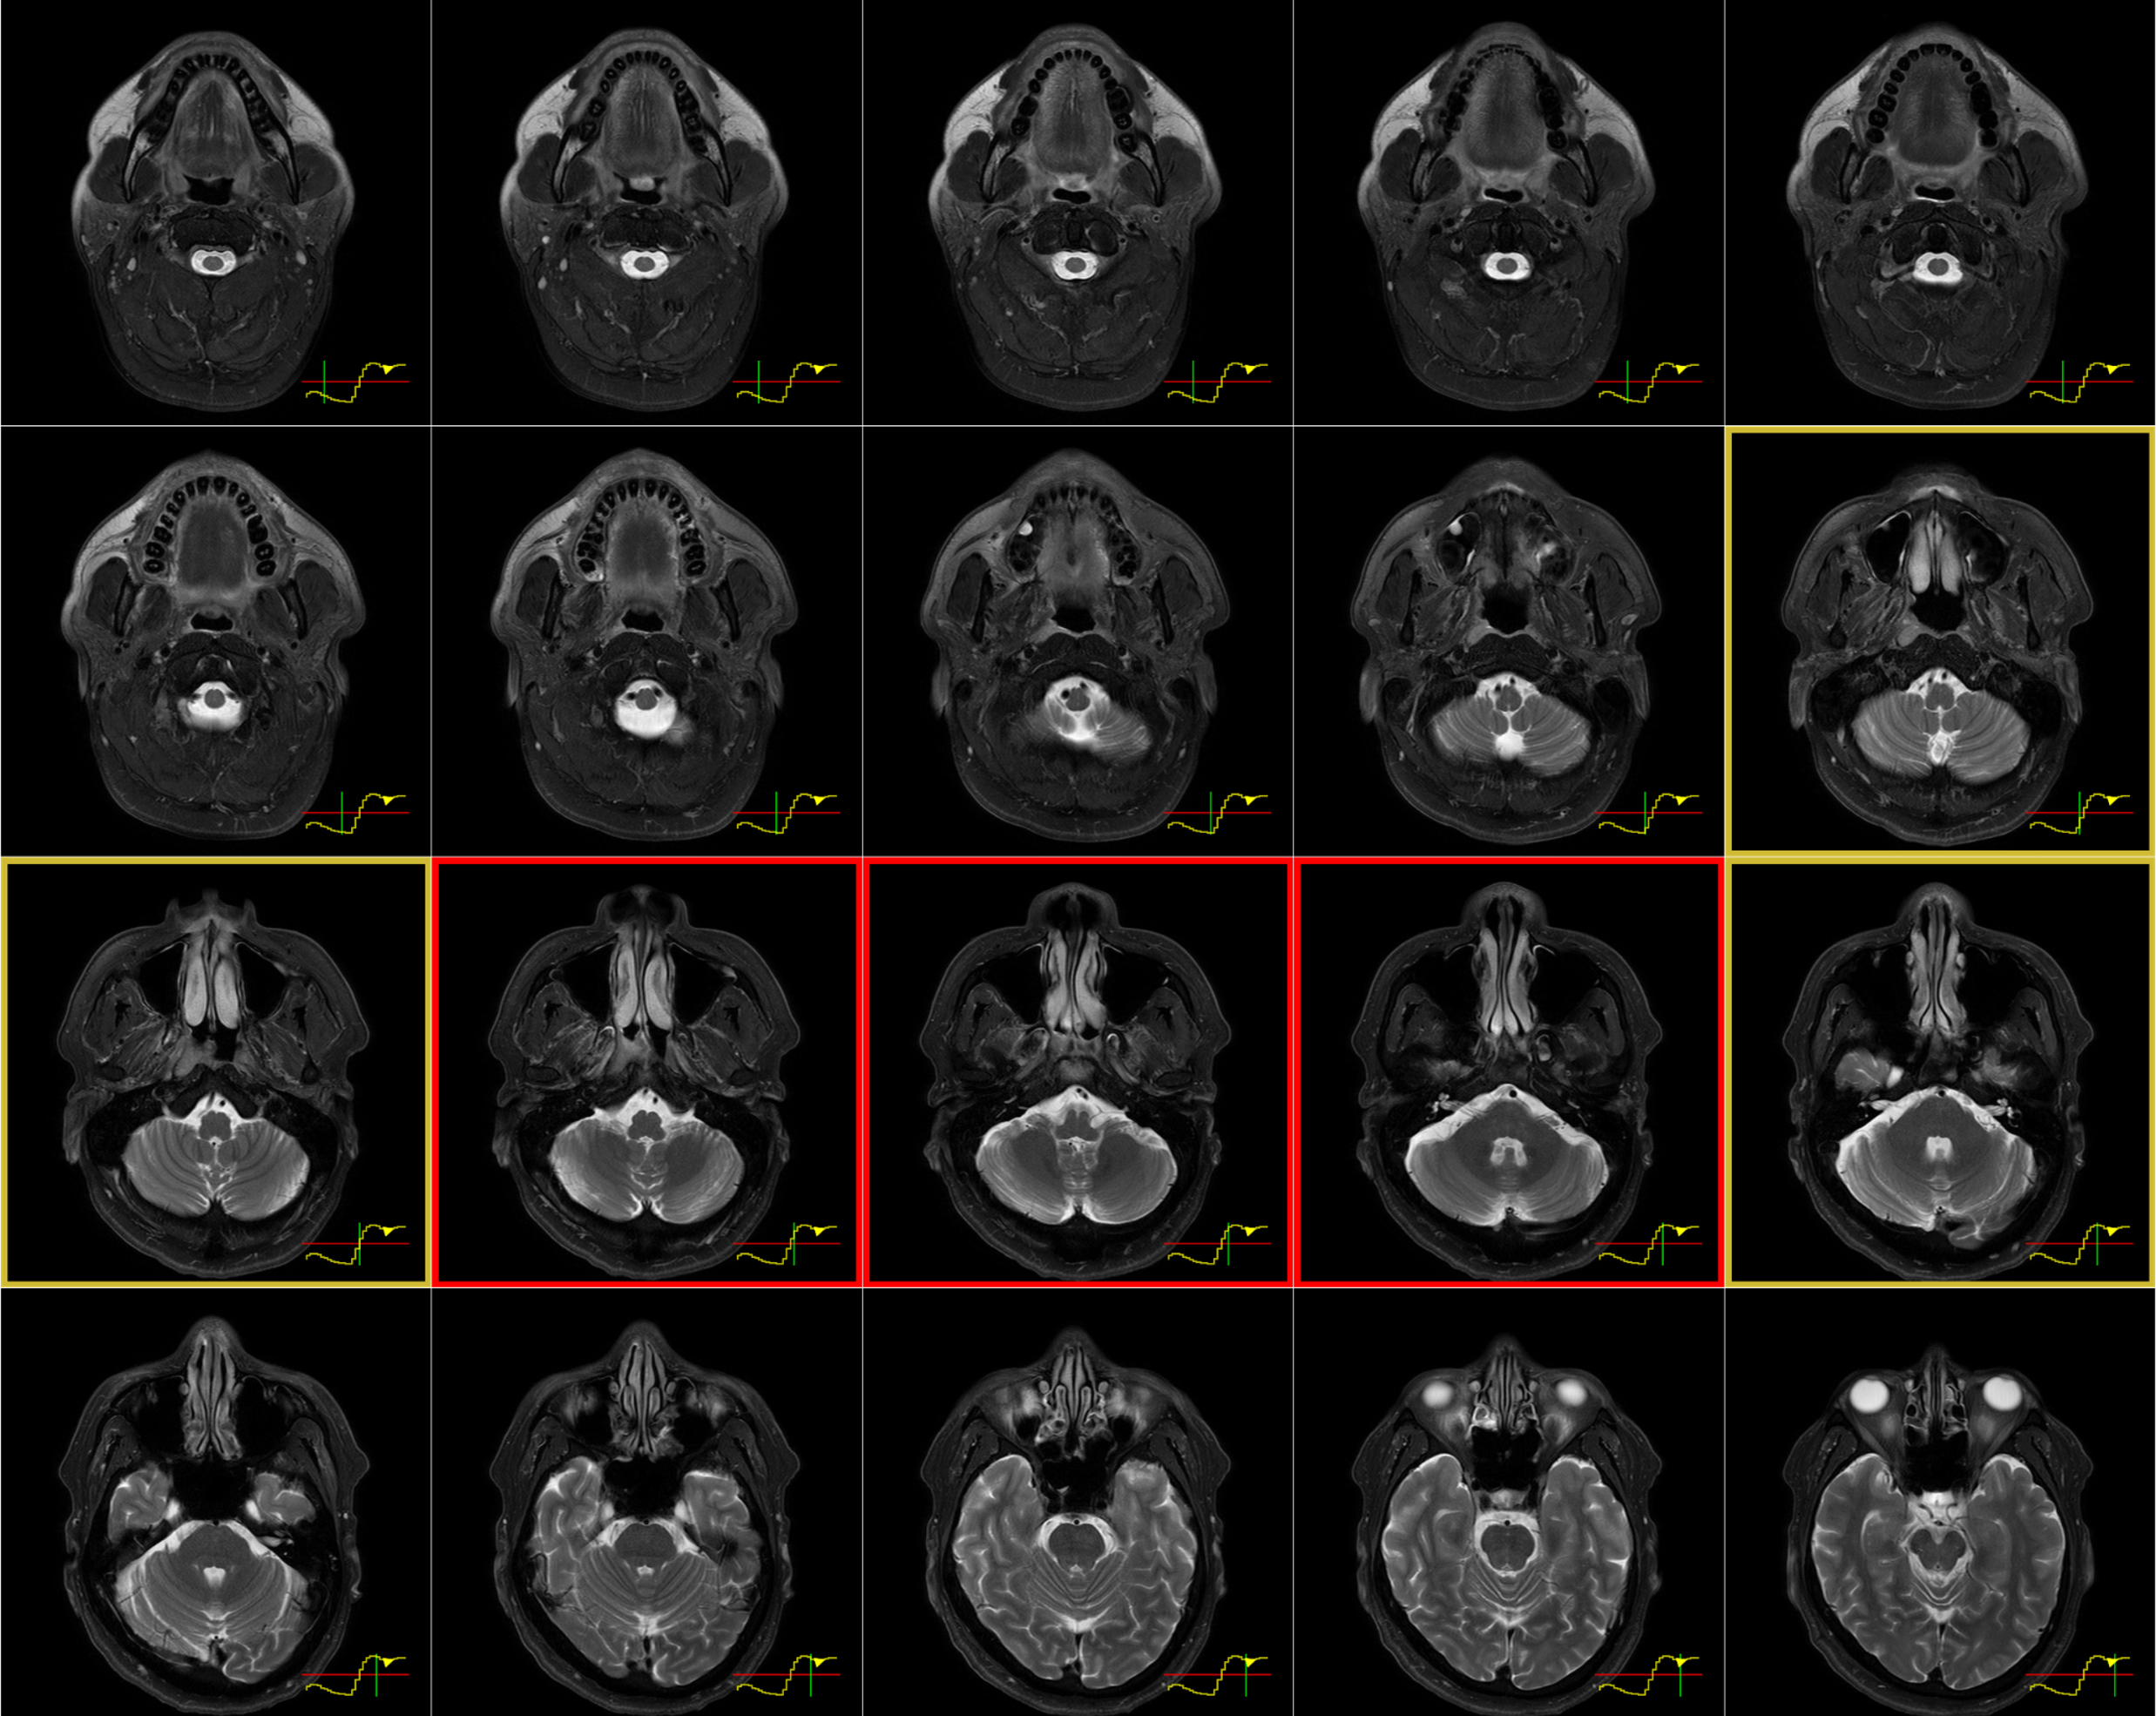
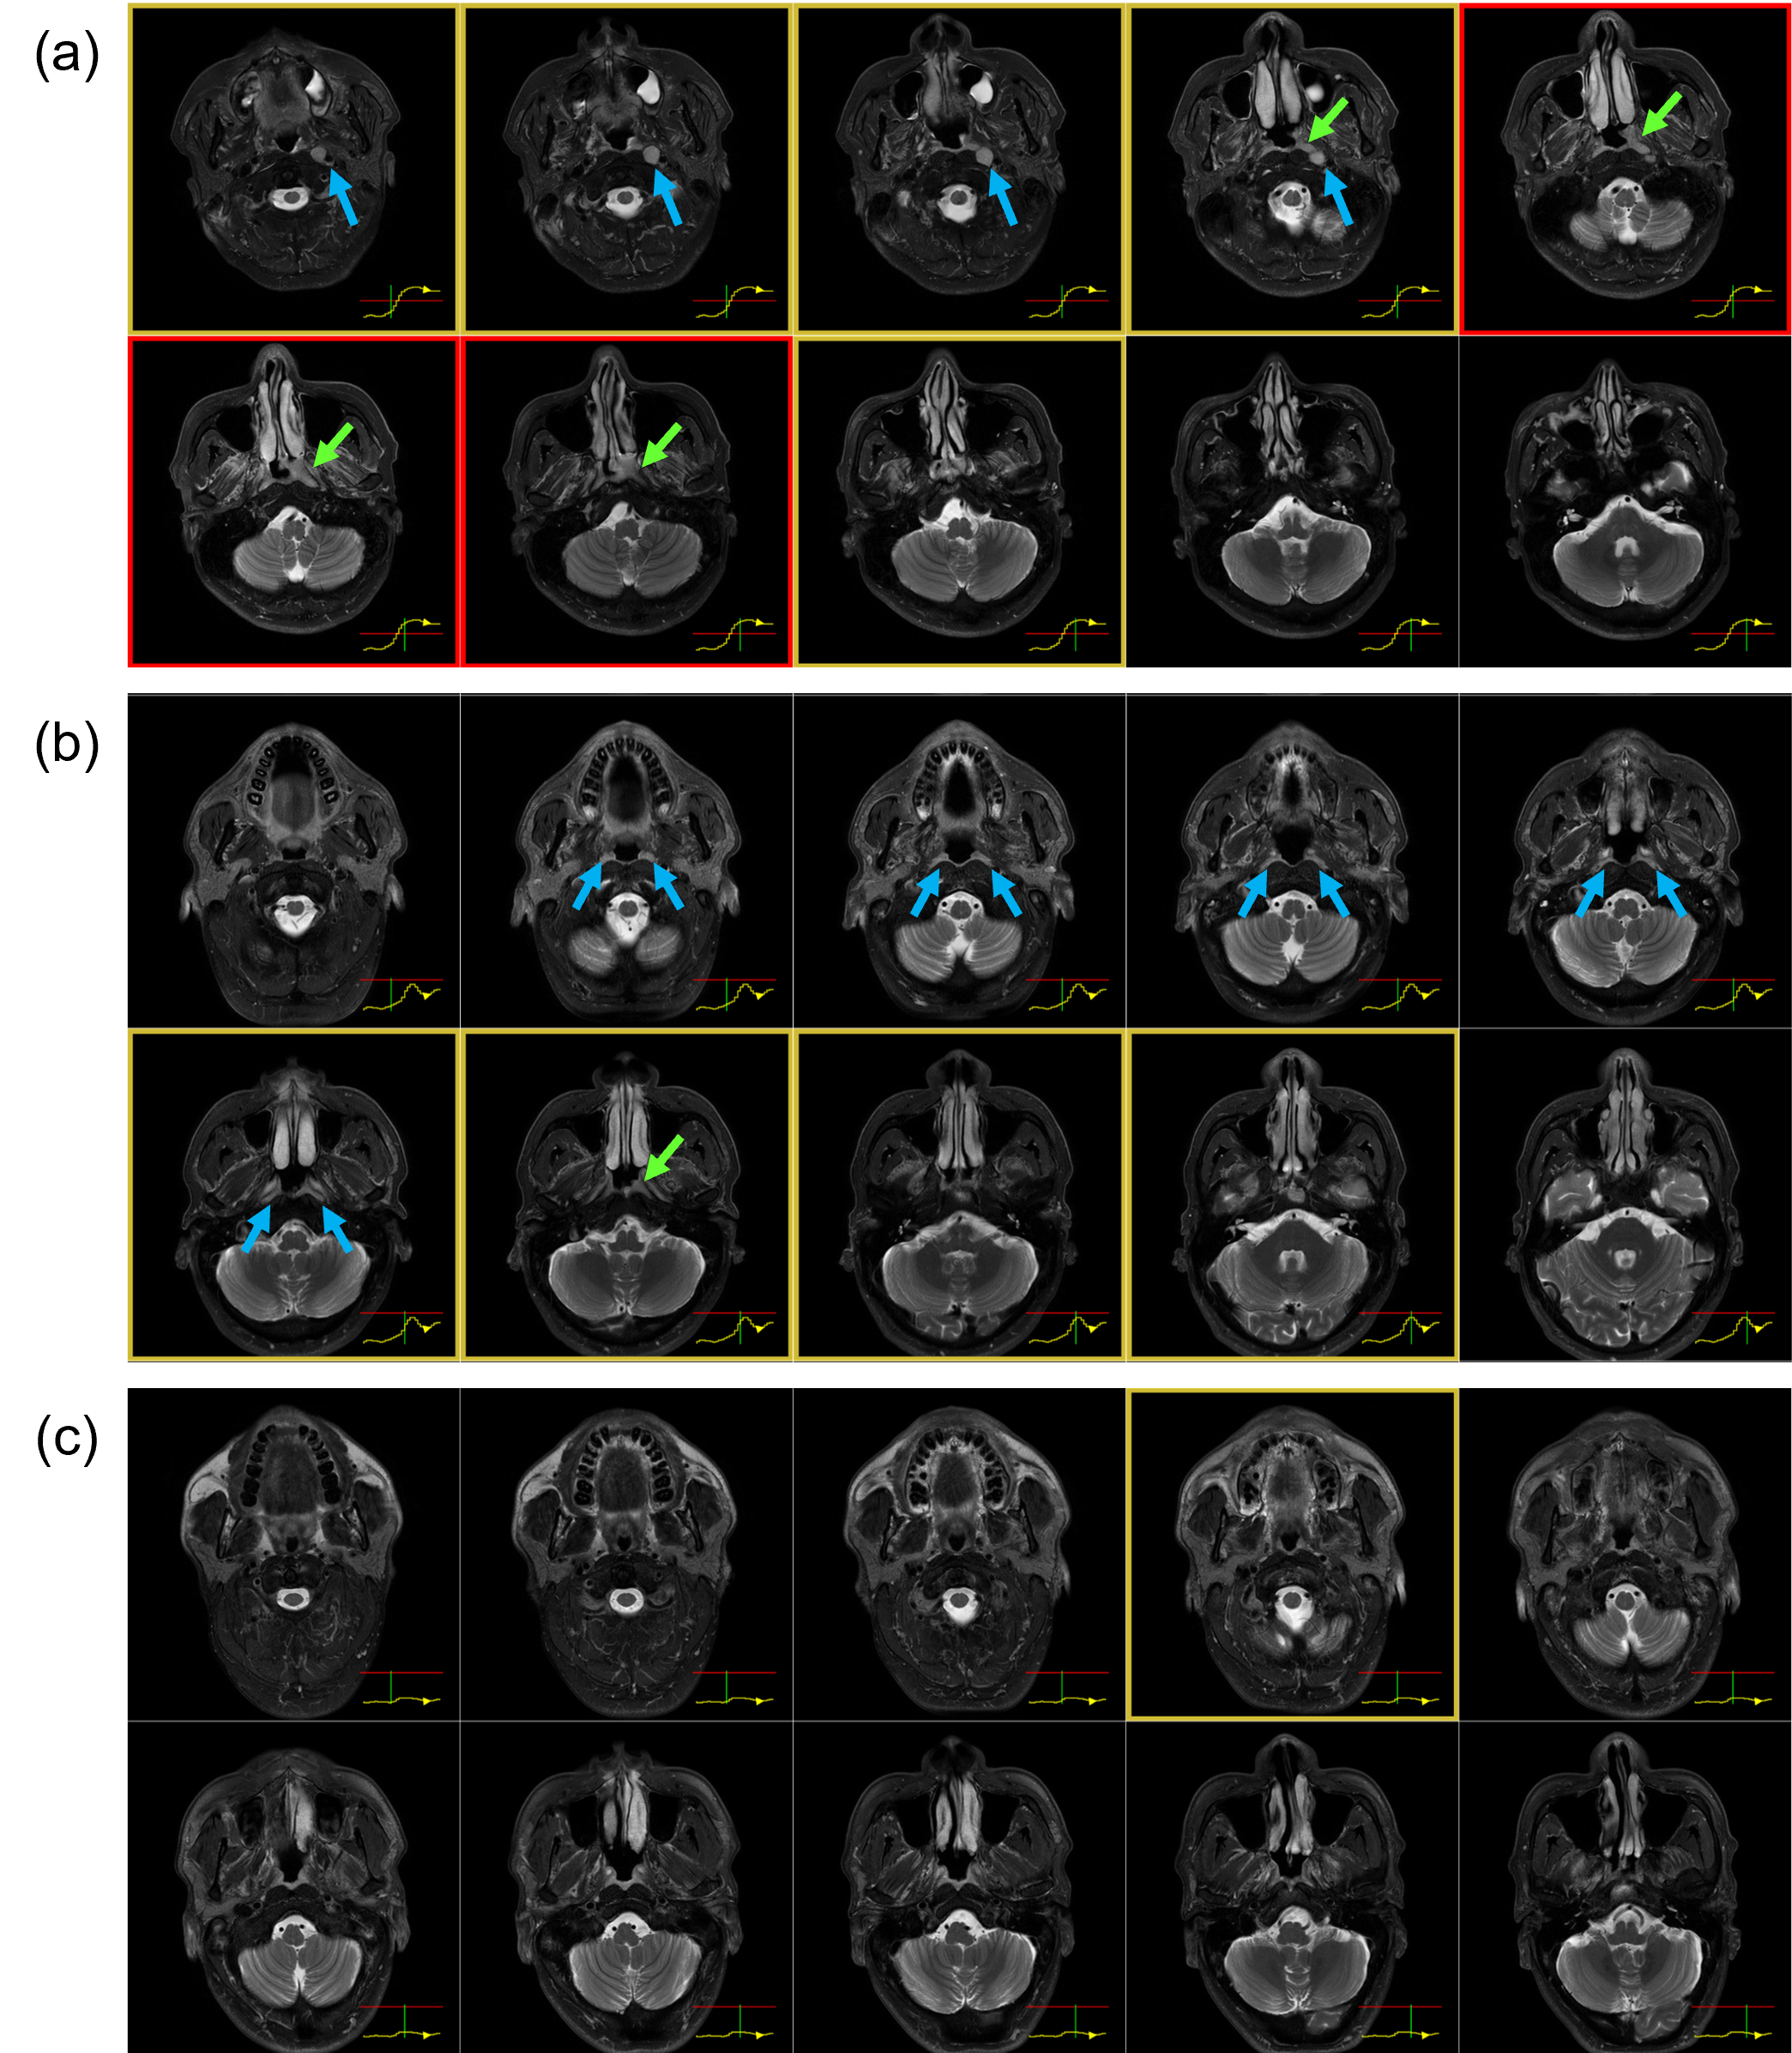
In 63 out of 66 true-positive predictions of NPC cases, the risk curves were one of two forms: (i) started off flat but sharp increase when reaching the primary NPC (n=29); (ii) raised slowly from the beginning till the end (n=34). In 68 out of 98 true-negative predictions, the risk curves stayed flat under the reference line unremarkably, the rest fluctuates but eventually settled below the referenced threshold after all slices were read. In 2 out of 3 false-negative cases, the risk curves showed a local peak at the primary NP which might allow manual rectification. Representative examples are provided in Figure 3. The slope and value of the risk curves were exploited to locate and highlight key slices that lead to an NPC positive prediction shown in Figure 4. Examples of interpreting the risk curves are given in Figure 5.
Discussion
We have proposed a simple method using LSTM to improve the explainability of CNN for early NPC detection on MRI in this study that achieved an AUC of 0.975, which is similar to the CNN without the LSTM (AUC=0.981). Compared to other methods employed to explain classification predictions by CNN in the literature, such as the attention mechanism and guided back-propagation [11] and Grad-CAM [12], our proposed method has the advantage of removing the arbitrariness from the need to pick a layer for visualization. It can add also insight into cases that produce false-positive or negative results which may enable modifications to future networks to improve performance.This study has some limitations. Firstly, this study did not address quantitatively the improvements in explainability owing to the lack of well-established metrics or systematic methods to do so. Secondly, the addition of LSTM increases training time and difficulty because the network needs to be trained in two steps.
Conclusion
LSTM introduced to CNN can improve the explainability without compromising performance in automatic early NPC detection on MRI.Acknowledgements
We would like to acknowledge Mr. Yip Man Tsang for his effort to collect the imaging dataset that is used in this study.References
[1] A. D. King, J. K. S. Woo, Q. Y. Ai, F. K. F. Mo, T. Y. So, W. K. J. Lam, I. O. L. Tse, A. C. Vlantis, K. W. N. Yip, E. P. Hui, B. B. Y. Ma, R. W. K. Chiu, A. T. C. Chan, Y. M. D. Lo, and K. C. A. Chan, “Early Detection of Cancer: Evaluation of MR Imaging Grading Systems in Patients with Suspected Nasopharyngeal Carcinoma,” AJNR Am J Neuroradiol, vol. 41, no. 3, pp. 515-521, Mar, 2020.
[2] Z. Liu, H. Li, K. J. Yu, S. H. Xie, A. D. King, Q. H. Ai, W. J. Chen, X. X. Chen, Z. J. Lu, L. Q. Tang, L. Wang, C. M. Xie, W. Ling, Y. Q. Lu, Q. H. Huang, A. E. Coghill, C. Fakhry, R. M. Pfeiffer, Y. X. Zeng, S. M. Cao, and A. Hildesheim, “Comparison of new magnetic resonance imaging grading system with conventional endoscopy for the early detection of nasopharyngeal carcinoma,” Cancer, vol. 127, no. 18, pp. 3403-3412, Sep 15, 2021.
[3] K. C. A. Chan, J. K. S. Woo, A. King, B. C. Y. Zee, W. K. J. Lam, S. L. Chan, S. W. I. Chu, C. Mak, I. O. L. Tse, S. Y. M. Leung, G. Chan, E. P. Hui, B. B. Y. Ma, R. W. K. Chiu, S. F. Leung, A. C. van Hasselt, A. T. C. Chan, and Y. M. D. Lo, “Analysis of Plasma Epstein-Barr Virus DNA to Screen for Nasopharyngeal Cancer,” N Engl J Med, vol. 377, no. 6, pp. 513-522, Aug 10, 2017.
[4] D. C. T. Chan, W. K. J. Lam, E. P. Hui, B. B. Y. Ma, C. M. L. Chan, V. C. T. Lee, S. H. Cheng, W. Gai, P. Jiang, K. C. W. Wong, F. Mo, B. Zee, A. D. King, Q. T. Le, A. T. C. Chan, K. C. A. Chan, and Y. M. D. Lo, “Improved risk stratification of nasopharyngeal cancer by targeted sequencing of Epstein-Barr virus DNA in post-treatment plasma,” Ann Oncol, vol. 33, no. 8, pp. 794-803, Aug, 2022.
[5] L. M. Wong, Q. Y. H. Ai, F. K. F. Mo, D. M. C. Poon, and A. D. King, “Convolutional neural network in nasopharyngeal carcinoma: how good is automatic delineation for primary tumor on a non-contrast-enhanced fat-suppressed T2-weighted MRI?,” Jpn J Radiol, vol. 39, no. 6, pp. 571-579, Jun, 2021.
[6] L. M. Wong, Q. Y. H. Ai, D. M. C. Poon, M. Tong, B. B. Y. Ma, E. P. Hui, L. Shi, and A. D. King, “A convolutional neural network combined with positional and textural attention for the fully automatic delineation of primary nasopharyngeal carcinoma on non-contrast-enhanced MRI,” Quant Imaging Med Surg, vol. 11, no. 9, pp. 3932-3944, Sep, 2021.
[7] L. M. Wong, A. D. King, Q. Y. H. Ai, W. K. J. Lam, D. M. C. Poon, B. B. Y. Ma, K. C. A. Chan, and F. K. F. Mo, “Convolutional neural network for discriminating nasopharyngeal carcinoma and benign hyperplasia on MRI,” Eur Radiol, vol. 31, no. 6, pp. 3856-3863, Jun, 2021.
[8] L. Ke, Y. Deng, W. Xia, M. Qiang, X. Chen, K. Liu, B. Jing, C. He, C. Xie, X. Guo, X. Lv, and C. Li, “Development of a self-constrained 3D DenseNet model in automatic detection and segmentation of nasopharyngeal carcinoma using magnetic resonance images,” Oral Oncol, vol. 110, pp. 104862, Nov, 2020.
[9] Y. S. Deng, C. F. Li, X. Lv, W. X. Xia, L. J. Shen, B. Z. Jing, B. Li, X. Guo, Y. Sun, C. M. Xie, and L. R. Ke, “The contrast-enhanced MRI can be substituted by unenhanced MRI in identifying and automatically segmenting primary nasopharyngeal carcinoma with the aid of deep learning models: An exploratory study in large-scale population of endemic area,” Computer Methods and Programs in Biomedicine, vol. 217, pp. 106702, Apr, 2022.
[10] F. Wang, M. Jiang, C. Qian, S. Yang, C. Li, H. Zhang, X. Wang, and X. Tang, "Residual attention network for image classification," Proceedings of the IEEE conference on computer vision and pattern recognition, 2017, pp. 3156-3164.
[11] J. T. Springenberg, A. Dosovitskiy, T. Brox, and M. Riedmiller. "Striving for simplicity: The all convolutional net," https://arxiv.org/abs/1412.6806.
[12] R. R. Selvaraju, M. Cogswell, A. Das, R. Vedantam, D. Parikh, and D. Batra, "Grad-cam: Visual explanations from deep networks via gradient-based localization." pp. 618-626.
Figures