0976
Quantifying features of human gray matter microstructure postmortem using Neurite Exchange Imaging (NEXI) at ultra-high field1Dept. of Radiology, Lausanne University Hospital (CHUV) and University of Lausanne, Lausanne, Switzerland, 2Division of Anatomy, Faculty of Medicine, University of Geneva, Geneva, Switzerland
Synopsis
Keywords: Microstructure, Modelling, Diffusion
In this work, we characterized microstructure properties of cortical gray matter and hippocampus using diffusion MRI, on two samples of postmortem fixed healthy human brain. The weak-to-absent diffusivity time-dependence and marked kurtosis time-dependence supported the suitability of the Neurite Exchange Imaging (NEXI) model to probe postmortem human gray matter microstructure. NEXI parametric estimations revealed region-specific values, calling for further validation using histology and further clarifying the discrepancy between compartment diffusivities estimated here vs. the literature. This study offers an important window on human gray matter microstructure at a spatial resolution unachievable in vivo.Introduction
Biophysical models of diffusion MRI are the cutting-edge methodology for the characterization of tissue microstructure in vivo. Recently, the diffusion community has successfully developed and applied biophysical models for gray matter (GM) – Neurite Exchange Imaging model1 (NEXI), or Standard Model with Exchange2 (SMEX) – accounting for the GM characteristic inter-compartment exchange mechanisms. Quantifying human cortical microstructure in vivo is challenging due to complex shape and limited spatial resolution. In this work, we leverage the benefits of ex vivo imaging to characterize microstructure features in samples of postmortem fixed human cortical GM and hippocampus, with high spatial resolution. NEXI parametric maps are estimated voxel-wise and highlight the regional GM variability.Methods
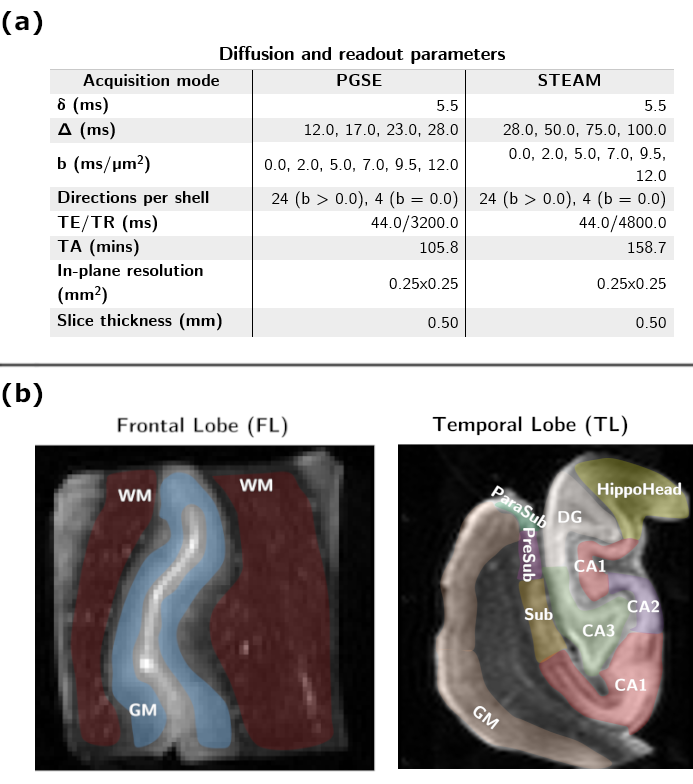
Experimental: Experiments were performed on two samples of postmortem fixed healthy human brain extracted from the frontal and the temporal lobes (FL/TL). Samples were first rehydrated in PBS for a minimum of 14 days prior to the MRI scan. After immersion in Fomblin and degassing, samples were scanned at room temperature on a 14.1T system equipped with 1 T/m gradients and using a home-built volume saddle transceiver. Diffusion data were acquired using a segmented PGSE-EPI sequence with b-values ranging 0-12 ms/µm2 and diffusion times t ranging 12-28 ms. The STimulated Echo Acquisition Mode (STEAM) was used to sample also longer diffusion times ranging 28-100 ms on the TL sample (Fig.1a presents all acquisition parameters). Diffusion times were acquired in scrambled order to prevent any drift bias.Processing: Eddy current correction3 was performed on the multi-shell multi-diffusion time data for the PGSE and STEAM acquisitions separately. Two ROIs corresponding to cortical gray and white matter (GM/WM) in the FL were manually drawn. The same procedure was applied in the TL, where a cortical ROI and hippocampal sub-fields were segmented (Fig.1b). Mean diffusivity (MD(t)) and mean kurtosis (MK(t)) were computed4 voxel-wise for each diffusion time using bmax=8 ms/µm2. MK(t) trends were analyzed in each ROI using a model of 3D structural disorder5 and a two-compartment Kärger exchange model6,7. The NEXI model1 was also fitted voxel-wise to the normalized powder-averaged signals from all shells and all diffusion times jointly using a non-linear least-square algorithm initialized following a grid search. Maps of NEXI parameters, tex (inter-compartment exchange time), f (intra-neurite signal fraction), Di and De (intra- and extra-neurite apparent diffusivities) were used to characterize the microstructure of each ROI.
Results and Discussion
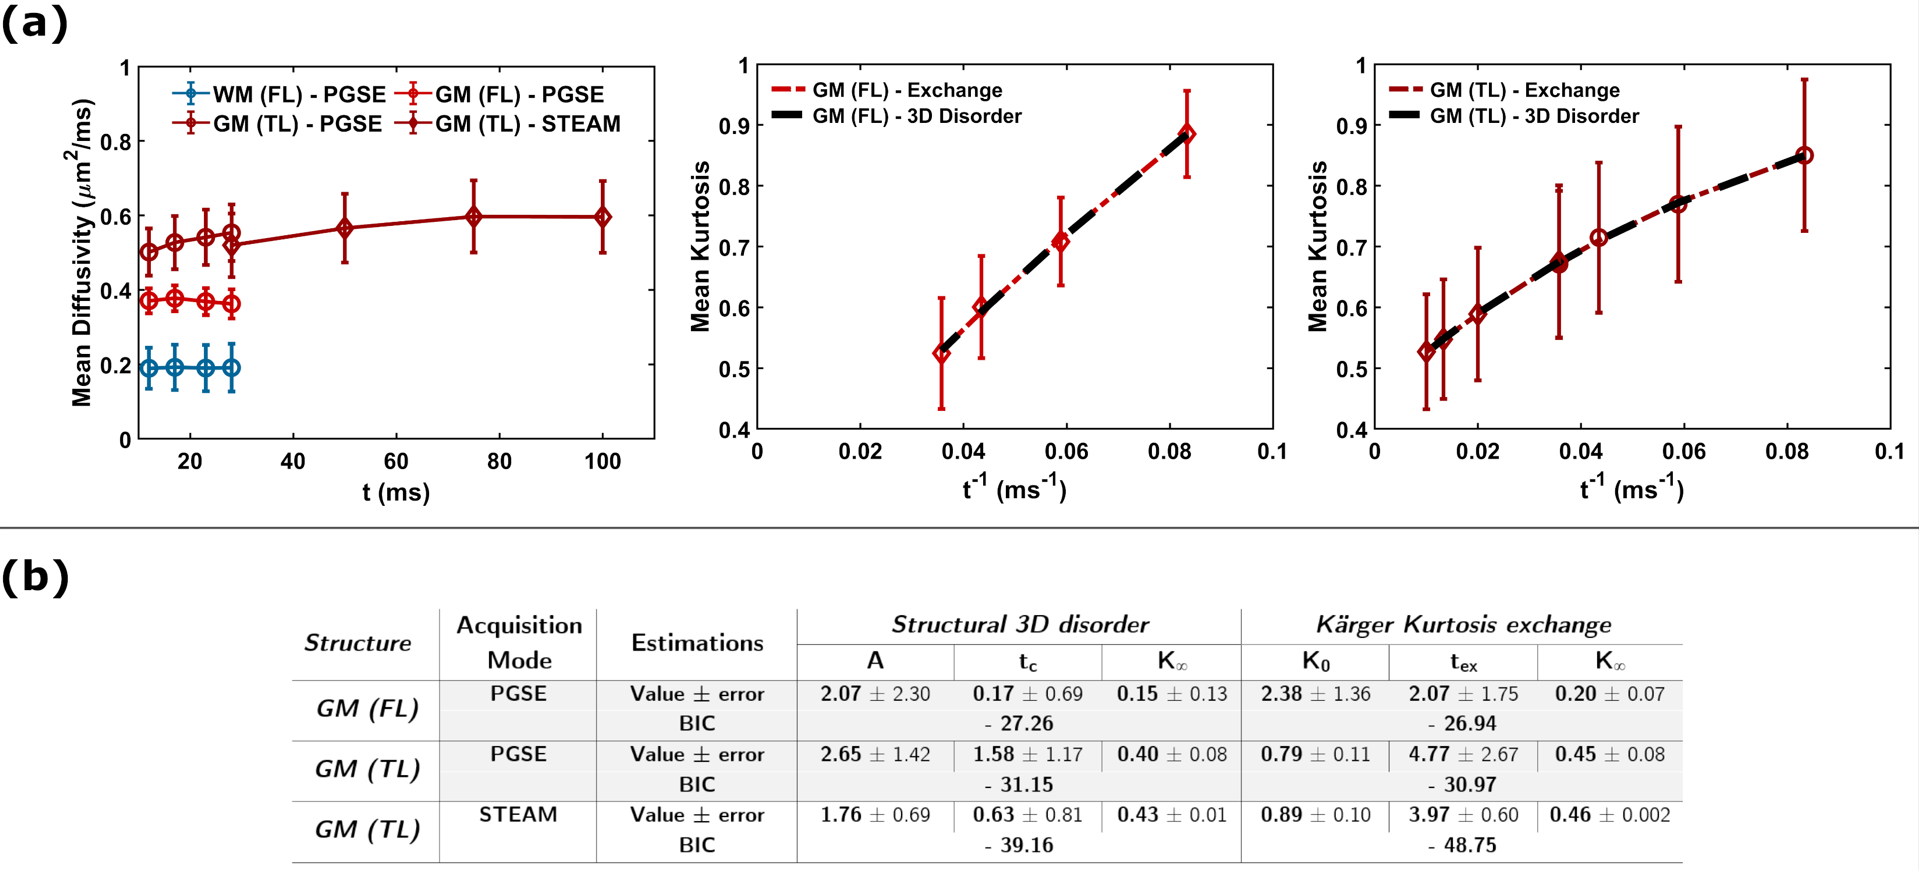
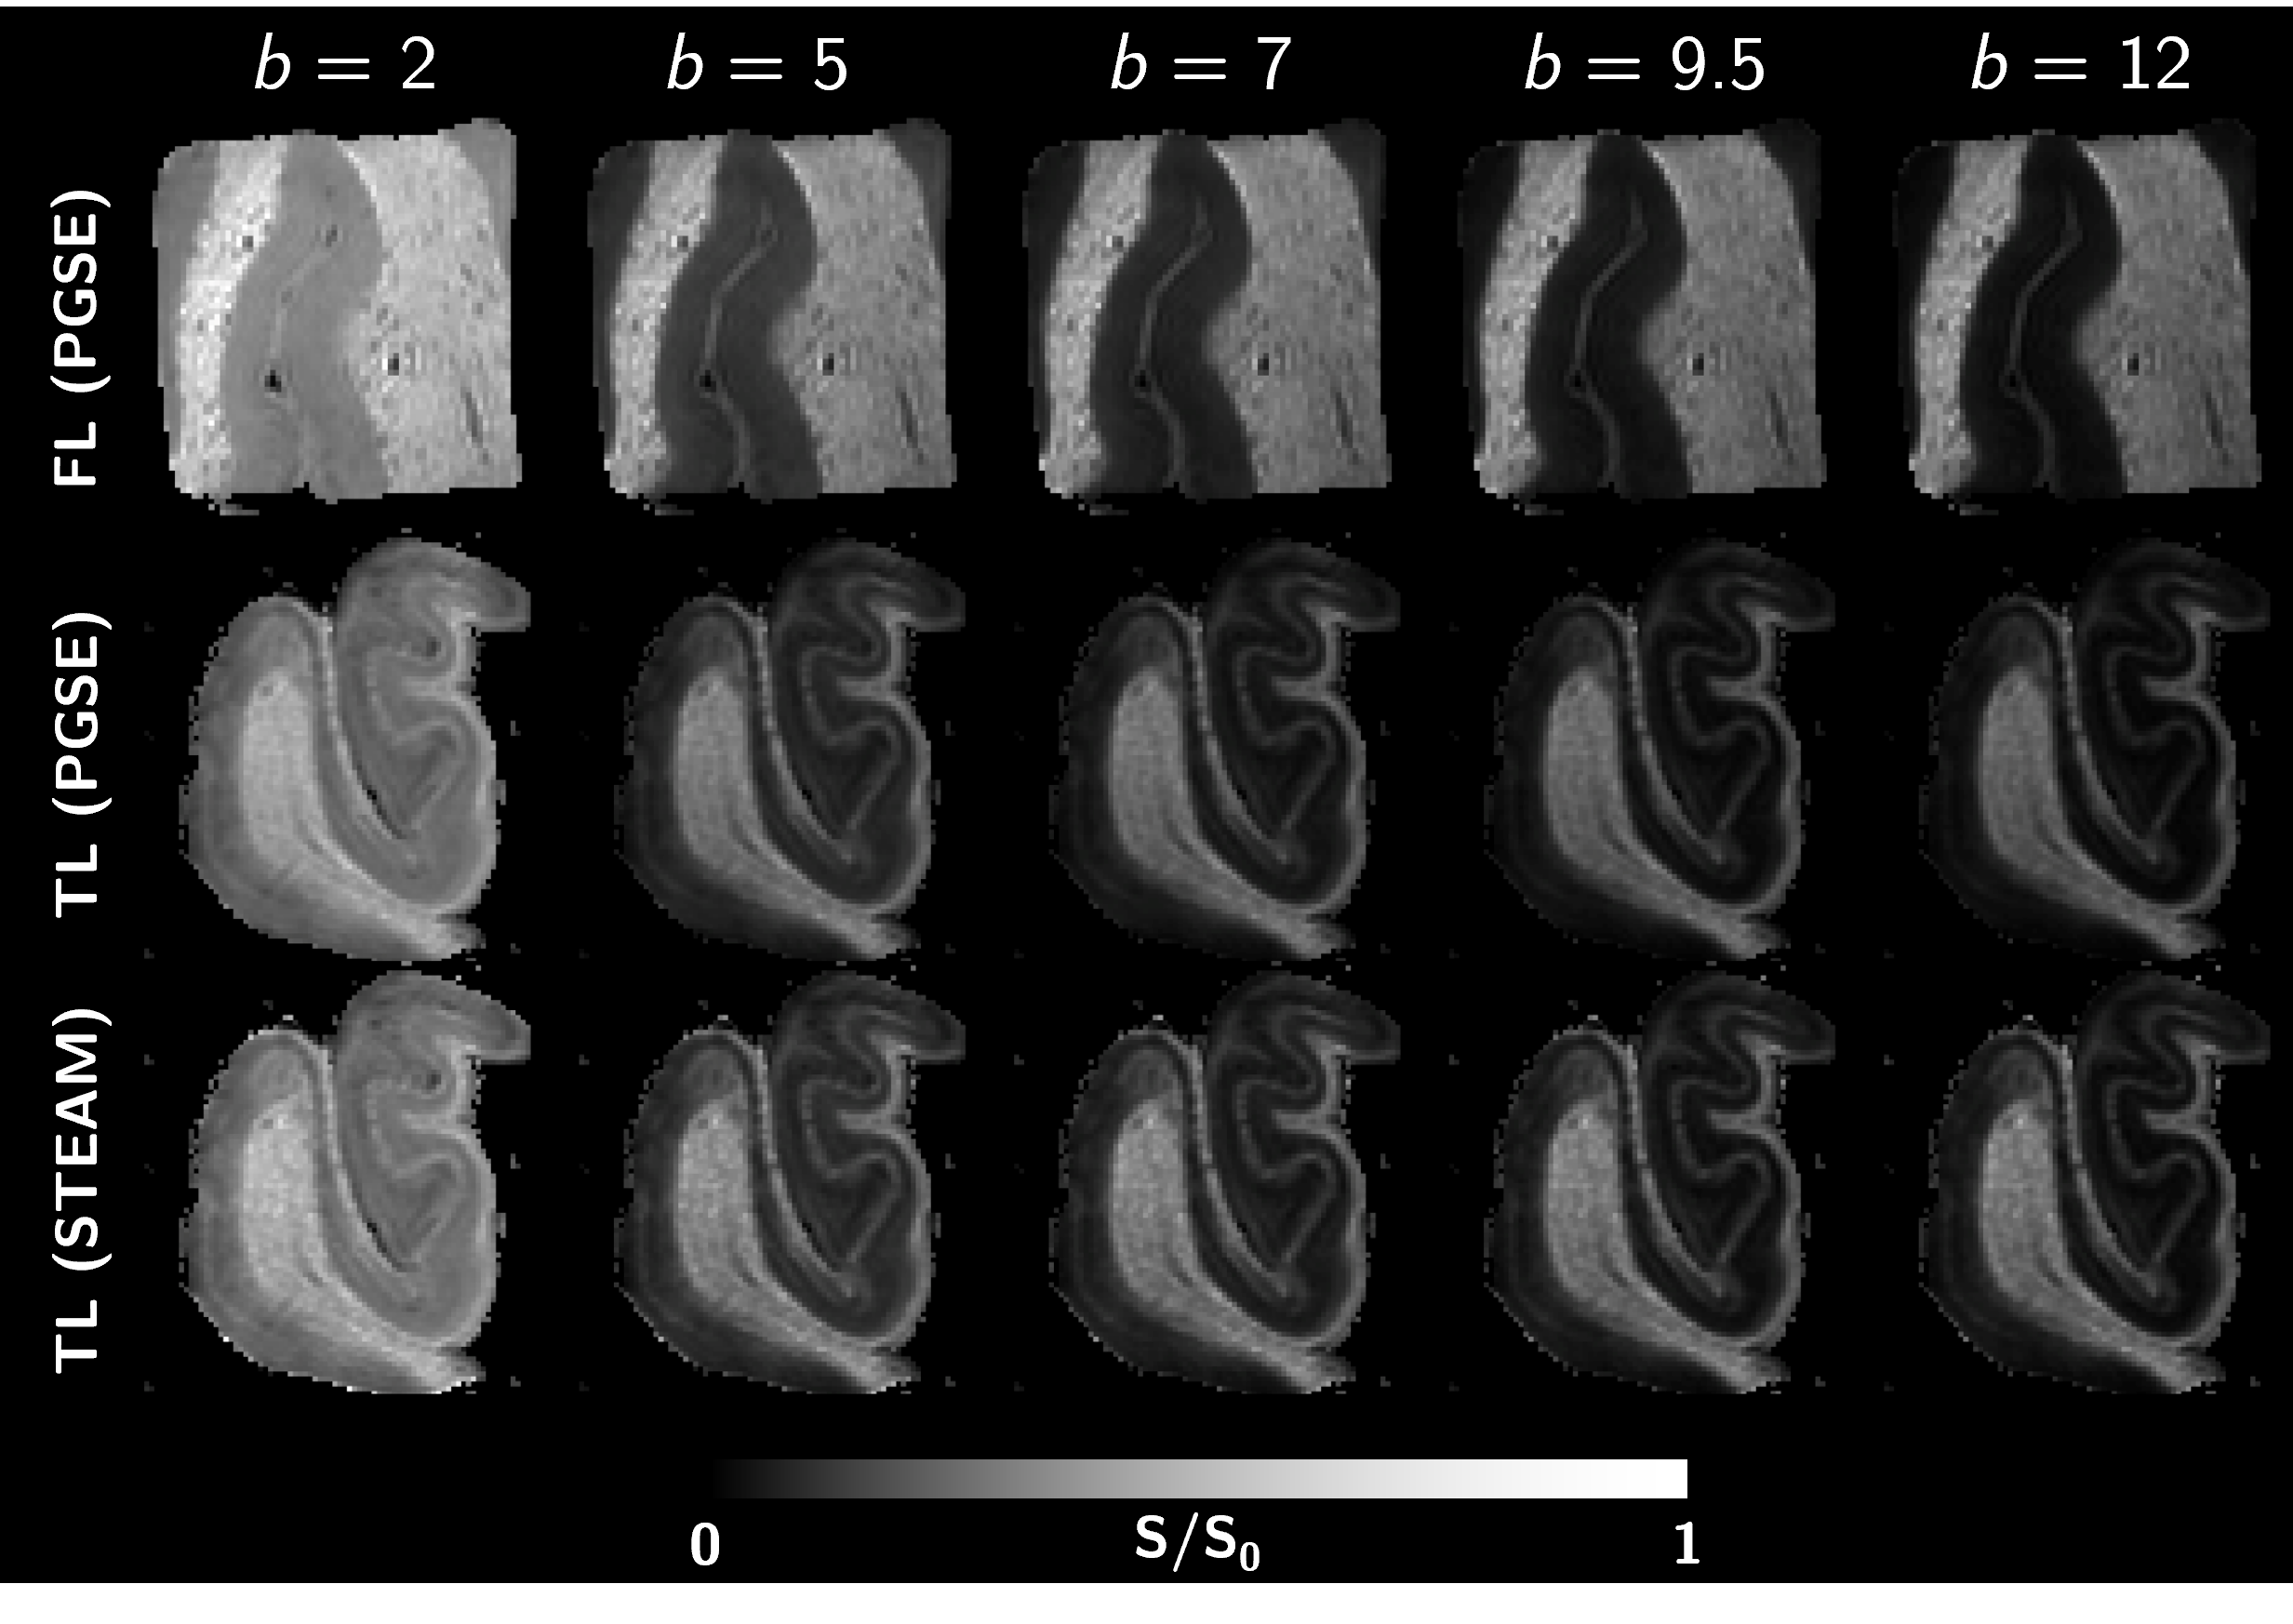
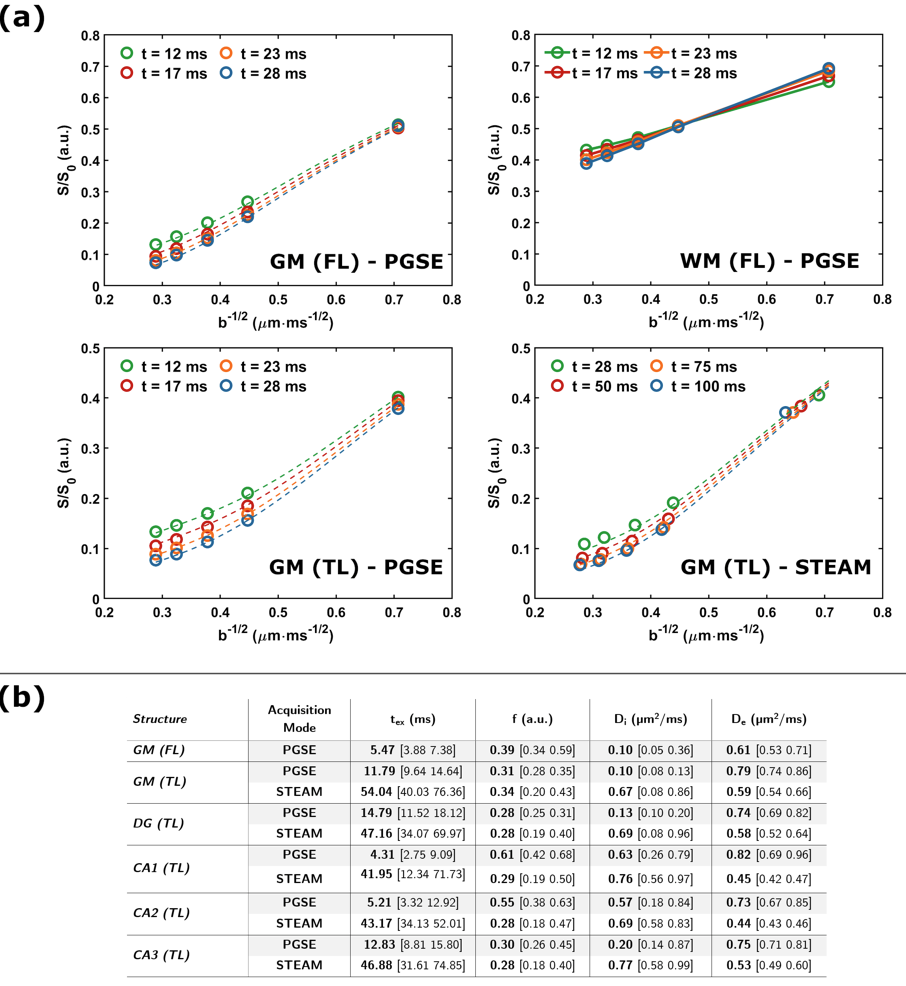
The tissue samples were of excellent quality, yielding high SNR and tissue contrast (Fig.3). Diffusivity showed weak-to-absent time-dependence in both GM and WM of the FL (Fig.2a). The TL showed a mild increase in diffusivity over the 12–100 ms time range, which requires further investigation but could be attributed to restriction domains that become permeable with longer times.On the other hand, MK(t) showed a marked time-dependence in FL and TL GM, with 3D structural disorder and exchange explaining equally well the data (Fig.2b). Precision of estimated parameters was however higher for the exchange model, with an exchange time texK(t)=2 ms in the FL and 4-5 ms in the TL. The powder-averaged signal at high b-values in GM showed a distinct curvature confirming the tissue cannot be modeled as impermeable sticks (the signal in WM is also plotted for comparison), while lower signal with increasing diffusion time supports this stick-departure arising from exchange rather than soma restriction (Fig.4a).
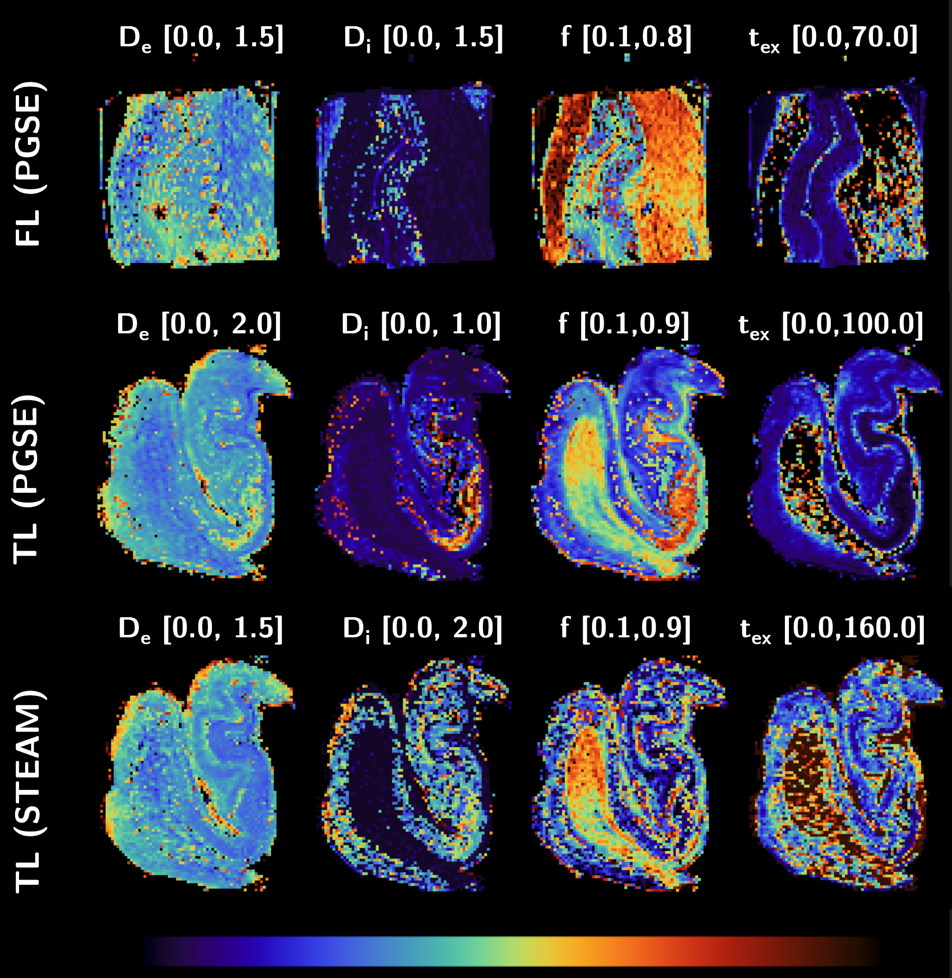
Taken together with the weak-to-absent diffusivity time-dependence, the data support the suitability of the NEXI model to probe postmortem human GM microstructure. NEXI fit the data well (Fig.4a, dashed lines). Microstructure parameters were ROI- and modality-dependent (Fig.4b). STEAM (Δ=28–100 ms) yielded much longer tex and Di estimates than PGSE (Δ=12-28 ms), which suggests the range of diffusion times acts as a filter on the tex estimates, and in the case of longer diffusion times, may be biased by substantial exchange with the extracellular space. Remarkably, for PGSE Di estimates were lower than De (Fig.4b), while the opposite was reported in vivo and ex vivo rat1,8. Postmortem human tissue inevitably suffers from ‘global ischemia’ upon death, which could produce substantial neurite beading and a drop in Di 9. The exchange time was ~5ms in FL GM, TL CA1 and CA2 and 12-15ms in TL GM, DG and CA3. Finally, NEXI parametric maps for the TL and FL samples (Fig.5) are precise enough to yield homogeneous estimates within a given sub-structure but also display excellent contrast between structures. Microstructure variations across cortical layers will be examined in the future.
Conclusion
We mapped the microstructure of human cortex and hippocampus postmortem using NEXI. Future work will focus on combining PGSE and STEAM acquisition to exploit a larger diffusion time range, and on histological staining on the same samples to validate expected features: beaded neurites and region-specific permeability possibly driven by myelination and/or concentration of neuronal vs. glial processes. While death and chemical fixation are expected to alter the microstructure substantially, findings on postmortem specimens can advance the validation of non-invasive techniques for their in vivo clinical use.Acknowledgements
The authors thank Katarzyna Pierzchala and Analina Hausin for help with the preparation of the samples prior to the imaging experiments, Bernard Lanz and Claudia Zanella for providing the RF coil, and the CIBM Center for Biomedical Imaging, a Swiss research center founded and supported by Lausanne University Hospital (CHUV), the University of Lausanne (UNIL), the Swiss Federal Institute of Technology (EPFL), the University of Geneva (UNIGE) and Geneva University Hospital (HUG). This work was supported by the Swiss National Science Foundation under Eccellenza grant PCEFP2_194260.References
1. Jelescu IO, de Skowronski A, Geffroy F, Palombo M, Novikov DS. Neurite Exchange Imaging (NEXI): A minimal model of diffusion in gray matter with inter-compartment water exchange. NeuroImage 2022;256:119277 doi: 10.1016/j.neuroimage.2022.119277.
2. Olesen JL, Østergaard L, Shemesh N, Jespersen SN. Diffusion time dependence, power-law scaling, and exchange in gray matter. Neuroimage 2022;251:118976 doi: 10.1016/j.neuroimage.2022.118976.
3. Andersson JLR, Sotiropoulos SN. An integrated approach to correction for off-resonance effects and subject movement in diffusion MR imaging. NeuroImage 2016;125:1063–1078 doi: 10.1016/j.neuroimage.2015.10.019.
4. Veraart J, Sijbers J, Sunaert S, Leemans A, Jeurissen B. Weighted linear least squares estimation of diffusion MRI parameters: Strengths, limitations, and pitfalls. NeuroImage 2013;81:335–346 doi: 10.1016/j.neuroimage.2013.05.028.
5. Novikov DS, Jensen JH, Helpern JA, Fieremans E. Revealing mesoscopic structural universality with diffusion. Proc. Natl. Acad. Sci. 2014;111:5088–5093 doi: 10.1073/pnas.1316944111.
6. Kärger J. NMR self-diffusion studies in heterogeneous systems. Adv. Colloid Interface Sci. 1985;23:129–148 doi: 10.1016/0001-8686(85)80018-X.
7. Fieremans E, Novikov DS, Jensen JH, Helpern JA. Monte Carlo study of a two-compartment exchange model of diffusion. NMR Biomed. 2010;23:711–724 doi: 10.1002/nbm.1577.
8. Jelescu IO, Uhl, Quentin. Ex vivo gray matter is complex: exchange & disorder exponents. Proc Intl Soc Mag Reson Med 30 2022 P0253.
9. Budde MD, Frank JA. Neurite beading is sufficient to decrease the apparent diffusion coefficient after ischemic stroke. Proc. Natl. Acad. Sci. 2010;107:14472–14477 doi: 10.1073/pnas.1004841107.
Figures