0967
Profiling specific cell populations within the inflammatory tumor microenvironment by oscillating-gradient diffusion-weighted MRI1Clinic of Radiology, University of Münster, Münster, Germany, 2Institute of Physiological Chemistry and Pathobiochemistry, University of Münster, Münster, Germany, 3Institute of Immunology, University of Münster, Münster, Germany, 4Department of Radiology, LMU Munich, Munich, Germany
Synopsis
Keywords: Cancer, Tumor, T-cells, macrophages, immunotherapy
Immune cells are major players of the tumor microenvironment (TME), having profound effects on tumor development and metastatic progression. We present oscillating-gradient diffusion-weighted MRI (OGSE-DWI) as non-invasive imaging approach to monitor the intratumoral immune cell infiltrate, relying on size differences between cancer cells, T-cells and macrophages. By applying the Imaging Microstructural Parameters Using Limited Spectrally Edited Diffusion (IMPULSED) model to sine-shaped OGSE-DWI, changes within the TME and its specific immune cell composition were monitored and compared in syngeneic murine breast cancer models with different degrees of malignancy during tumor progression, clodronate liposome-mediated depletion of macrophages and immune checkpoint inhibitor treatment.Introduction
Immune cells are main players in building, shaping and reprogramming the tumor microenvironment (TME)1. While the inflammatory TME is characterized by complex and dynamic interconnections between various immune cell subtypes2, especially the interaction between T-cells and macrophages has crucial impact on tumor progression and metastatic spread3,4, so simultaneous imaging of T-cell and macrophage infiltration into tumor lesions is highly desired.Oscillating-gradient spin-echo diffusion-weighted imaging (OGSE-DWI), combined with the Imaging Microstructural Parameters Using Limited Spectrally Edited Diffusion (IMPULSED) method, enables an accurate quantification of cell sizes5. The purpose of this study was to investigate whether OGSE-DWI enables a cell size-based discrimination between cancer cells, T-cells and macrophages, providing a non-invasive and tracer-free imaging approach for distinct in vivo characterization of the inflammatory TME.
Methods
The accuracy of IMPULSED-derived cell radii was evaluated using in vitro spheroid models, consisting of either pure cancer cells, macrophages or T-cells. Subsequently, in vivo experiments aimed to assess changes within the TME and its specific immune cell composition in syngeneic murine breast cancer models with divergent degrees of malignancy (4T1: high malignancy, metastatic, 67NR: low malignancy, non-metastatic) during tumor progression, clodronate liposome-mediated depletion of macrophages and immune checkpoint inhibitor (ICI) treatment. OGSE sequences were performed as multi-shot EPI sequences with 4 segments (TR = 1000 ms, TE = 88 ms, 8 averages, 1.0 mm slice thickness, 18 x 15 mm2 FOV, 96 × 64 matrix, three orthogonal diffusion gradient directions, diffusion gradient duration δ = 25 ms, diffusion gradient separation Δ = 30 ms, nine b-values including 0, 0.125, 0.25, 0.375, 0.5, 0.75, 1, 1.5, 2 ms/µm2 and gradient frequencies f of 40, 80, 120 and 160 Hz). In contrast to previous studies using cosine-shaped oscillating gradients5-7, we applied sine-shaped OGSE-DWI to the IMPULSED model to increase the model’s sensitivity for cell radii larger than 10 µm. Cell radii were derived from sine-OGSE diffusion-weighted images with the intracellular signal attenuation β modeled as $$\beta (OGSE_{sine} ) = 2(\gamma g)^2 \sum_n \frac{B_n \omega^2}{(\lambda_n^2 D_{in}^2 + \omega^2)^2} \left\{ \frac{\lambda_n D_{in} \delta (\lambda_n^2D_{in}^2 + \omega^2)}{2\omega^2} + 1 - \exp(-\lambda_n D_{in} \delta) - \exp(-\lambda_n D_{in} \Delta)(1- \cosh(-\lambda_n D_{in} \delta)) \right\}$$ with $$$B_n = \frac{2(r/\mu_n)^2}{\mu_n^2-2}$$$ and $$$\lambda_n = \left(\frac{\mu_n}{r}\right)^2$$$ (γ: gyromagnetic ratio, g: gradient amplitude, Din: intracellular diffusion coefficient, ω: diffusion gradient angular frequency, Bn and λn: structure-dependent coefficients, for IMPULSED with μn as the nth root of $$$\mu J'_{3/2}(\mu) - \frac{1}{2} J_{3/2}(\mu) =0$$$, r: cell radius). To stabilize the fitting procedure and improve signal-to-noise ratios, Din was set to a fixed value and data were analyzed using an ROI-based approach. Ex vivo validation of IMPULSED-derived cell radii was achieved by immunohistochemical wheat germ agglutinin (WGA) staining of cell membranes, while intratumoral immune cell composition was analyzed by CD3 and F4/80 co-staining. Statistical analysis of in vitro spheroids was performed using two-sided t-test. Longitudinal in vivo data were analyzed by one-way ANOVA with Tukey post-hoc test or Kruskal-Wallis test and cell radii of therapy groups were compared to control groups using two-sided t-test or Mann-Whitney U test (depending on normal distribution of data, checked by Shapiro-Wilk test).Results
In vitro spheroid experiments validated the capability of OGSE-DWI for a cell size-based discrimination between cancer cells and different immune cells by detecting significantly (p < 0.0001) smaller cell radii for T-cells (3.8 ± 1.8 μm) and significantly (p < 0.0001) larger cell radii for macrophages (13.0 ± 1.7 µm), compared to both cancer cell lines (4T1: 8.8 ± 1.3 μm, 67NR: 8.2 ± 1.4 μm) (Fig. 1). While T-cell infiltration during progression of 4T1 tumors was captured by decreasing IMPULSED-derived cell radii from 9.7 ± 1.0 μm to 5.0 ± 1.5 μm (p < 0.0001) (Fig. 2a-c), increasing amount of intratumoral macrophages during progression of 67NR tumors was detected by increasing mean cell radii from 8.9 ± 1.2 μm to 12.5 ± 1.1 μm (p = 0.0002) (Fig. 2d-f). After macrophage depletion, mean cell radii decreased from 6.3 ± 1.7 μm to 4.4 ± 0.5 μm (p = 0.02). T-cell infiltration after ICI treatment was captured by decreasing mean cell radii in both tumor models three (4T1: 4.6 ± 0.8 μm compared to 6.3 ± 1.7 μm for controls, p = 0.03, 67NR: 7.1 ± 0.5 μm compared to 11.7 ± 0.9 μm for controls, p = 0.003) and six days (4T1: 3.2 ± 0.8 μm compared to 5.0 ± 1.5 μm for controls, p = 0.02, 67NR: 5.2 ± 0.7 μm compared to 12.5 ± 1.1 μm for controls, p = 0.004) after treatment initiation (Fig. 3).Discussion
This study highlights the capability of non-invasive diffusion-weighted MRI to provide distinct insights into the intratumoral immune cell infiltrate and its composition, by attributing changes and differences in mean cell sizes to the intratumoral T-cell and macrophage content. We have successfully applied sine-shaped OGSE-DWI to precisely distinguish different cellular compositions of the TME, evaluating the effects of tumor progression, macrophage depletion and ICI treatment on averaged cell sizes in murine breast cancer models with different degrees of malignancy.Conclusion
Sine-shaped OGSE-DWI’s capability to simultaneously assess T-cell and macrophage infiltration into tumor lesions enables non-invasive characterization of the inflammatory TME with the potential to monitor disease progression and early response to immunotherapies.Acknowledgements
This study was supported by the German Research Foundation (DFG, GE 3336/1-1, grant no. 446302350; SFB1009-A09, -B08 and -Z02, grant no. 194468054), the Interdisciplinary Center for Clinical Research Münster (PIX) and the Medical Faculty of the University of Münster (fellowships to EH, MG). We thank Claudia Terwesten-Solé, Klaudia Niepagenkemper, Richard Holtmeier, Alletta Schmidt-Hederich and Florian Breuer for excellent technical support.References
1Giraldo NA, Sanchez-Salas R, Peske JD, et al. The clinical role of the TME in solid cancer. Br J Cancer. 2019;120(1):45–53.
2Heinrich EL, Walser TC, Krysan K, et al. The inflammatory tumor microenvironment, epithelial mesenchymal transition and lung carcinogenesis. Cancer Microenviron. 2011;5(1):5–18.
3Gómez-Valenzuela F, Escobar E, Pérez-Tomás R, et al. The inflammatory profile of the tumor microenvironment, orchestrated by cyclooxygenase-2, promotes epithelial-mesenchymal transition. Front Oncol. 2021;11:686792.
4Salemme V, Centonze G, Cavallo F, et al. The crosstalk between tumor cells and the immune microenvironment in breast cancer: implications for immunotherapy. Front Oncol. 2021;11:610303.
5Jiang X, Li H, Xie J, et al. In vivo imaging of cancer cell size and cellularity using temporal diffusion spectroscopy. Magn Reson Med. 2017;78(1):156-164.
6Xu J, Jiang X, Li H, et al. Magnetic resonance imaging of mean cell size in human breast tumors. Magn Reson Med. 2020;83(6):2002–14.
7Jiang X, Dudzinski S, Beckermann KE, et al. MRI of tumor T cell infiltration in response to checkpoint inhibitor therapy. J Immunother Cancer. 2020;8(1):e000328.
Figures
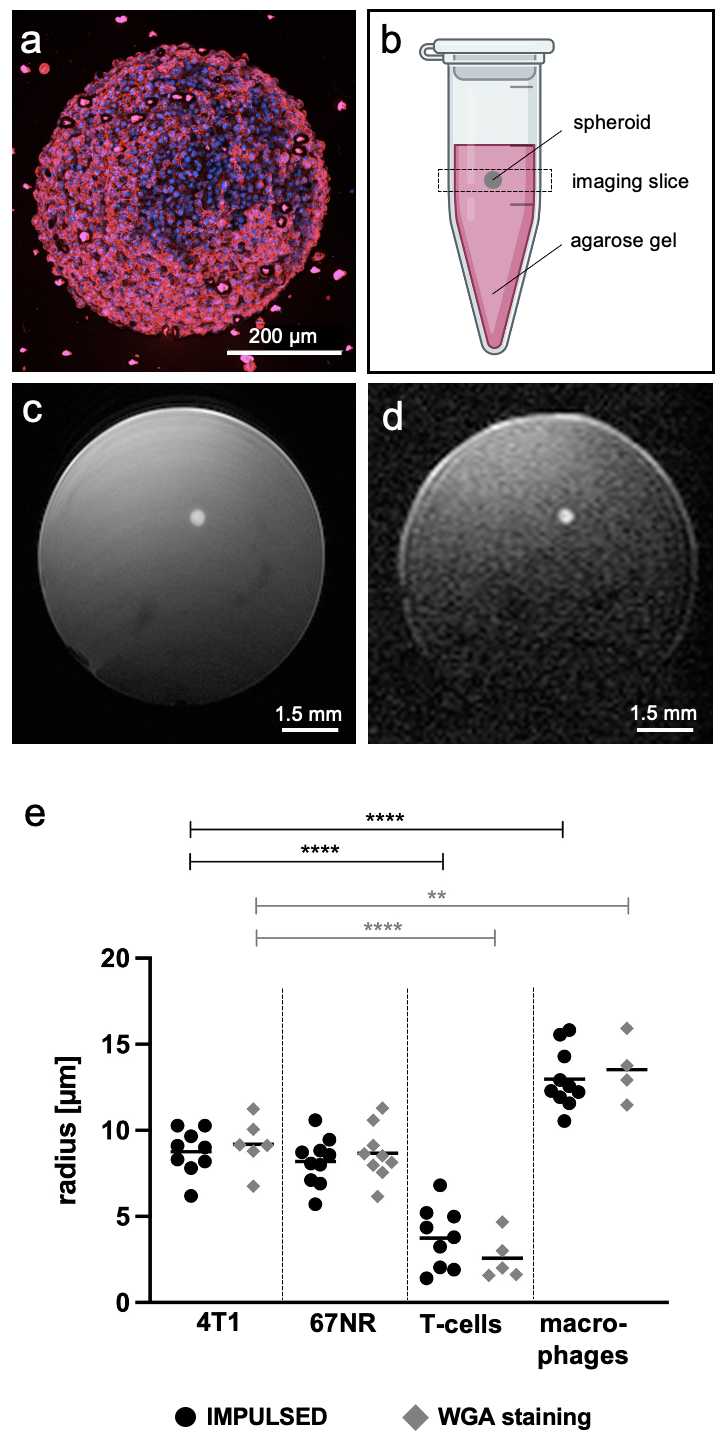
Figure 1: OGSE-DWI is able to differentiate between cancer cells, macrophages and T-cells using in vitro spheroids.
For MR imaging, spheroids (a) were embedded in agarose gel-solidified cell culture medium (b) and localized using T2-weighted imaging (c). OGSE-DWI (b = 0.25 ms/µm2, fOGSE = 50 Hz) was conducted (d), followed by IMPULSED-derived cell radii analysis (black) which was compared to ex vivo radii obtained after immunohistochemical WGA staining (grey) (e). **p < 0.01, ****p < 0.0001.
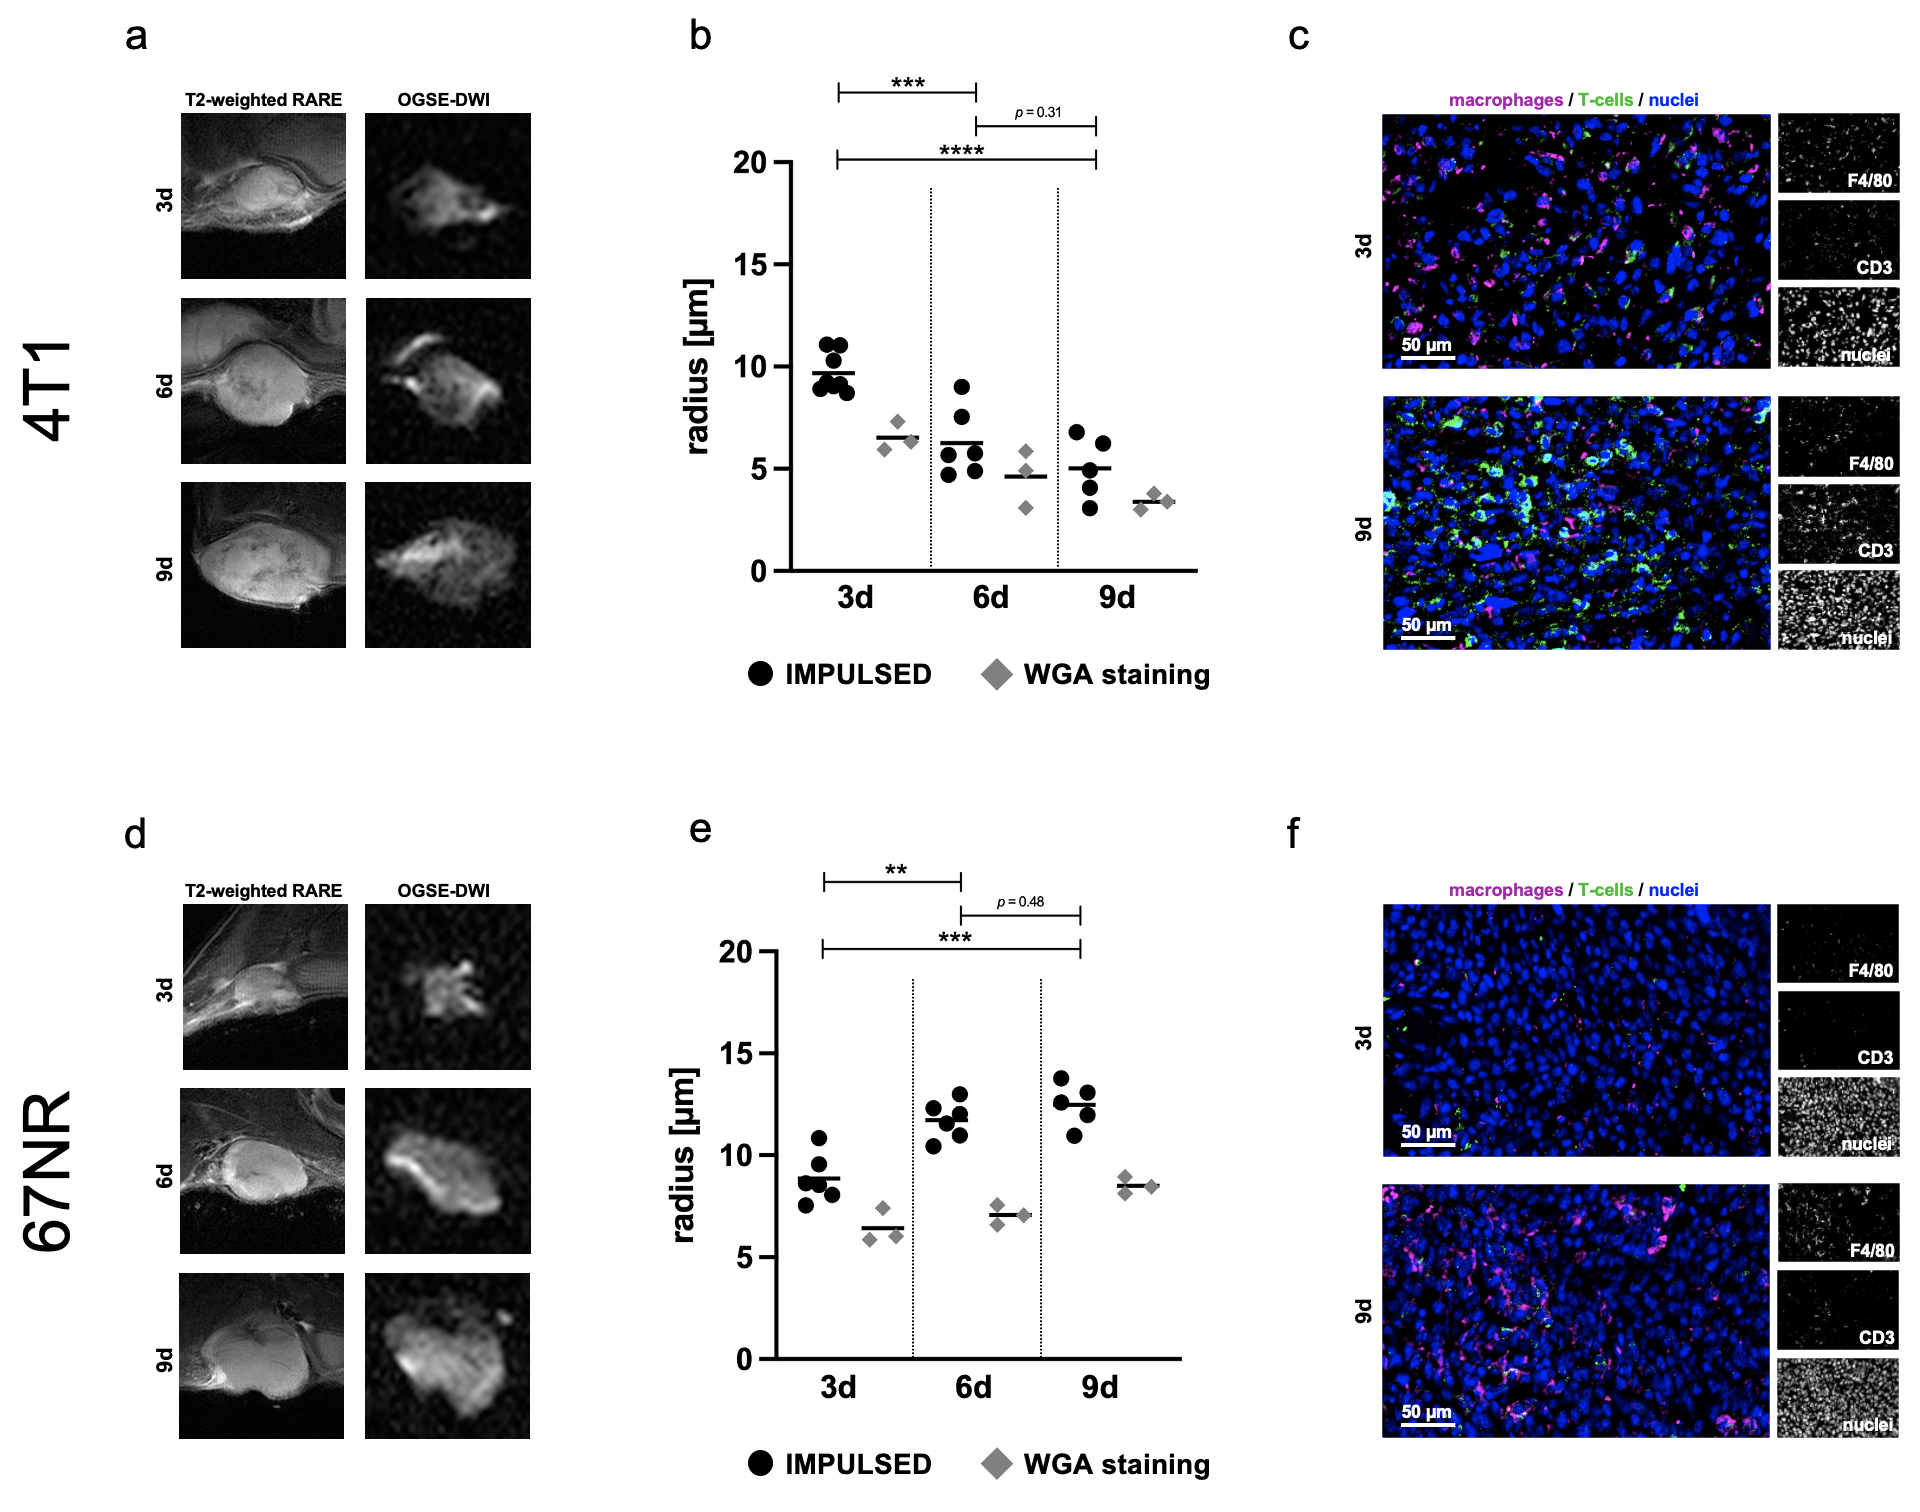
Figure 2: Analysis of the inflammatory TME during tumor progression.
During tumor progression, 4T1 tumors ((a), T2-weighted and diffusion-weighted MR images, b = 0.125 ms/µm2, fOGSE = 80 Hz) showed decreasing IMPULSED-derived cell radii (b), along with increasing amount of intratumoral T-cells (c). In contrast, 67NR tumors (d) exhibited increasing IMPULSED-derived cell radii (e), while being characterized by increasing amount of intratumoral macrophages (f). **p < 0.01, ***p < 0.001, ****p < 0.0001.
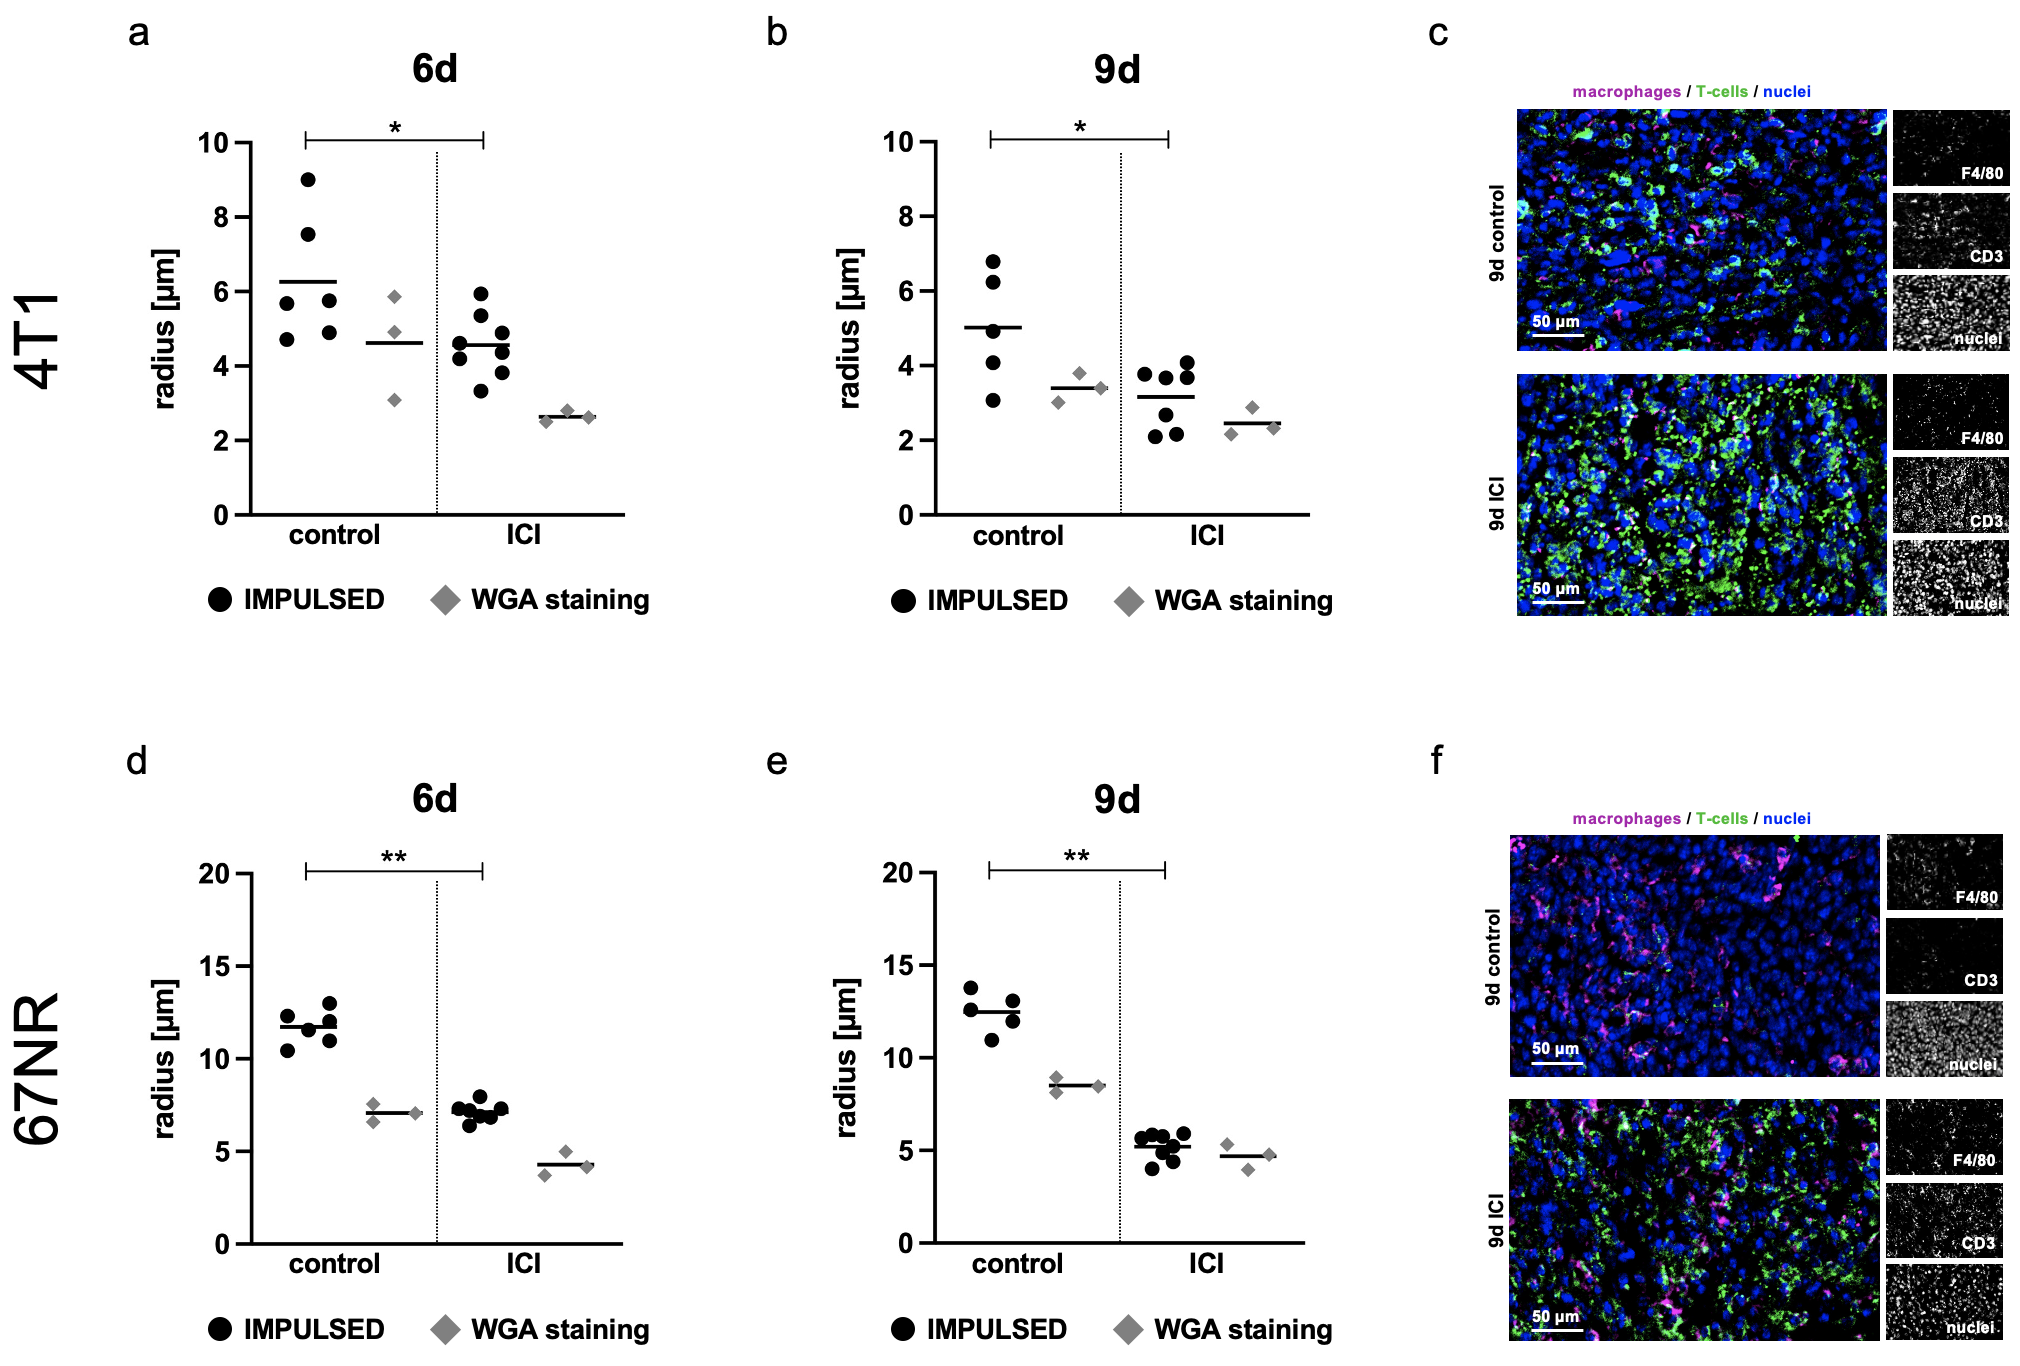
Figure 3: Response assessment to immune checkpoint inhibitor therapy.
ICI treatment was started three days after tumor implantation. 4T1 tumors showed decreasing IMPULSED-derived cell radii early on day six (a) and day nine (b), while demonstrating therapy-induced T-cell infiltration (c). Also in 67NR tumors IMPULSED-derived cell radii decreased on day six (d) and day nine (e), in line with excessive T-cell-infiltration (f), showing more pronounced effects than the 4T1 model. *p < 0.05, **p < 0.01.