0965
Age-related regional patterns in cerebral microstructure revealed using mean apparent propagator (MAP) MRI1National Institute on Aging, Baltimore, MD, United States, 2National Institute of Child Health and Human Development, Bethesda, MD, United States
Synopsis
Keywords: Diffusion/other diffusion imaging techniques, Aging
The relationship between brain microstructure and aging has been the subject of intense study. We used the mean apparent propagator (MAP) MRI framework, which is suitable to characterize diffusion in complex microstructure, to investigate age-related differences in a cohort of cognitively unimpaired participants, spanning a wide age range. In white matter, we established an opposing pattern of higher non-Gaussianity (NG) alongside lower propagator anisotropy (PA) among older adults. In gray matter, these two indices were consistent with one another, and exhibited regional pattern heterogeneity compared to other microstructural parameters. These results suggest that MAP-MRI provides otherwise inaccessible regional microstructural information.Introduction
Age is the main risk factor for prevalent diseases and conditions such as cancer, cardiovascular disease, and neurodegeneration. Several lines of research have demonstrated that volumetric MRI,1 DTI,2 myelin water imaging,3 and more recently, multicompartment diffusion approaches,4 can characterize cerebral microstructure and reveal complex and nonlinear age-related trajectories during brain maturation and degeneration. The objective of the current study is to investigate the sensitivity of the mean apparent propagator (MAP) MRI framework,5 which is suitable to characterize diffusion in complex microstructure, towards detecting age-related differences in a cohort of cognitively unimpaired participants, spanning a wide age range.Methods
Image acquisition: Images were acquired from 58 cognitively unimpaired participants spanning a wide range of ages from 21 to 83 years (45.4±18.3years), including 31 males. Specifically, diffusion-weighted images were acquired along 32 directions, with two b-values of 700 and 2000s/mm2, using a single-shot EPI sequence, TR=10000ms, TE=67ms, matrix size=120×120x50, voxel size=2mm×2mm×3mm, and acquisition time=~12min. All images were acquired with field-of-view=240mm×208mm×150mm, SENSE factor=2, and reconstructed to voxel size of 2mm×2mm×2mm.Data processing: All diffusion images were pre-processed using TORTOISE.6 Voxelwise diffusion propagators using a MAP-MRI series expansion truncated at order 4 were estimated, and from them return-to-origin probability (RTOP), return-to-axis probability (RTAP), return-to-plane probability (RTPP), non-Gaussianity (NG), and propagator anisotropy (PA) were mapped.
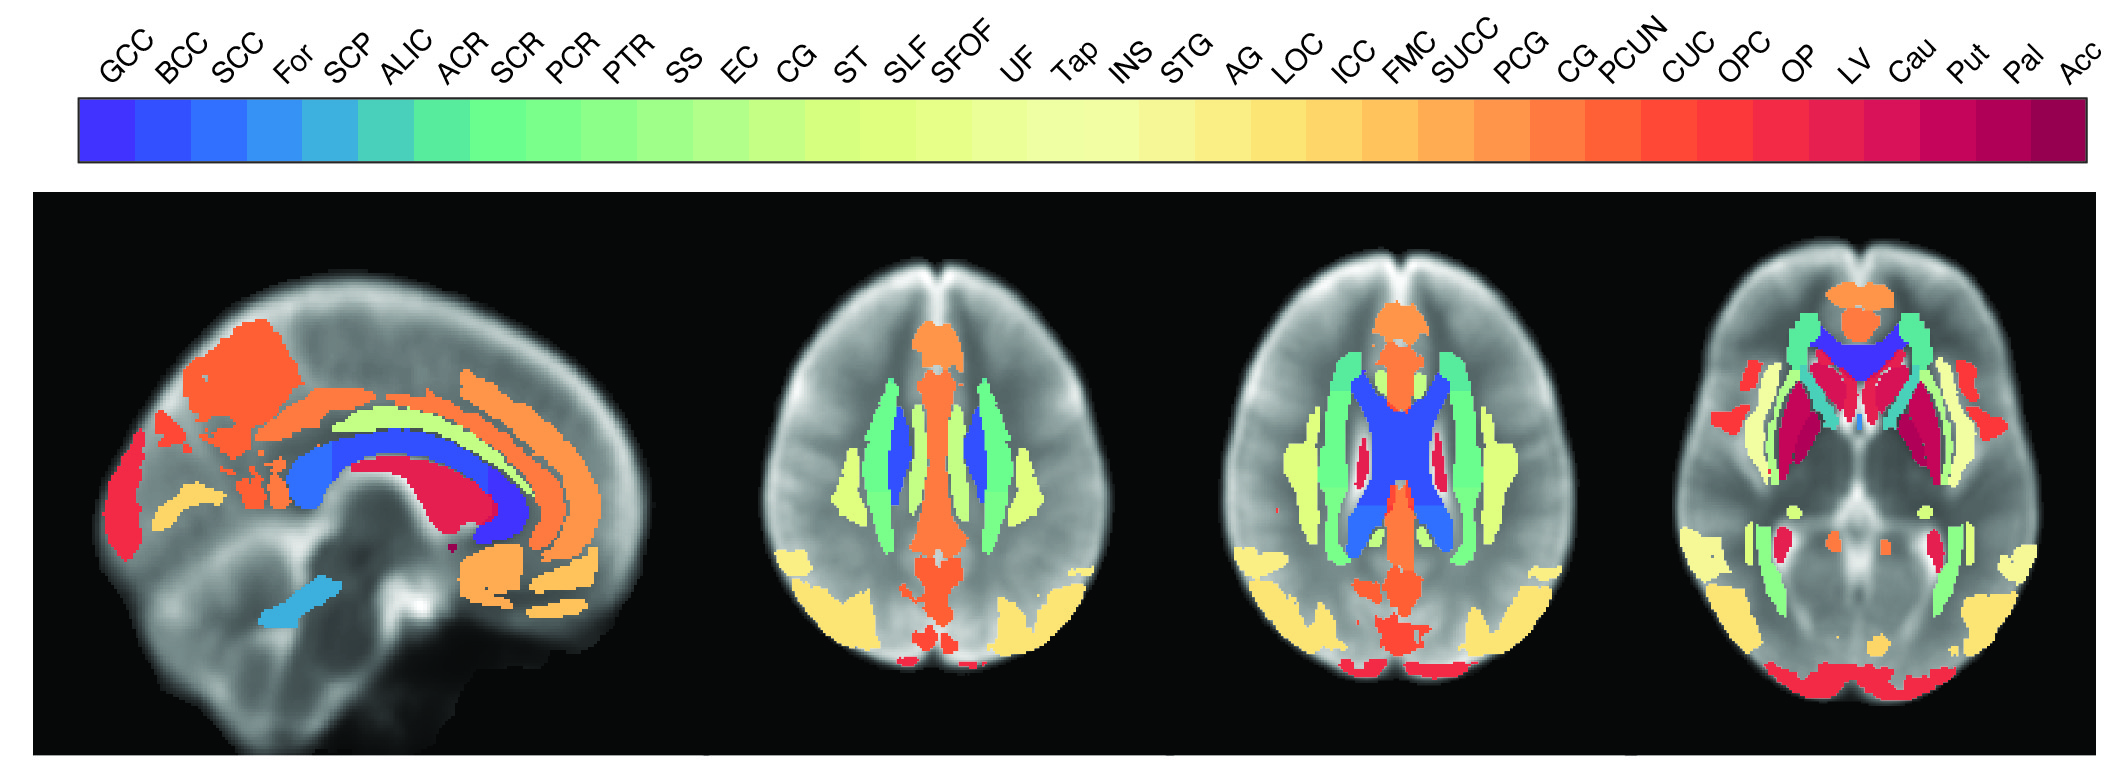
Image processing and analysis: For each participant, indices maps were nonlinearly registered to the MNI space using the greedy diffeomorphic algorithm.7 Finally, 36 deep WM, cortical, and subcortical GM structures were chosen as ROIs from the MNI atlas (Fig. 1). To investigate age and sex effects on diffusion indices, linear regression analyses were performed using the mean value within each ROI as the dependent variable and sex, age, and age2 as independent variables.
Results
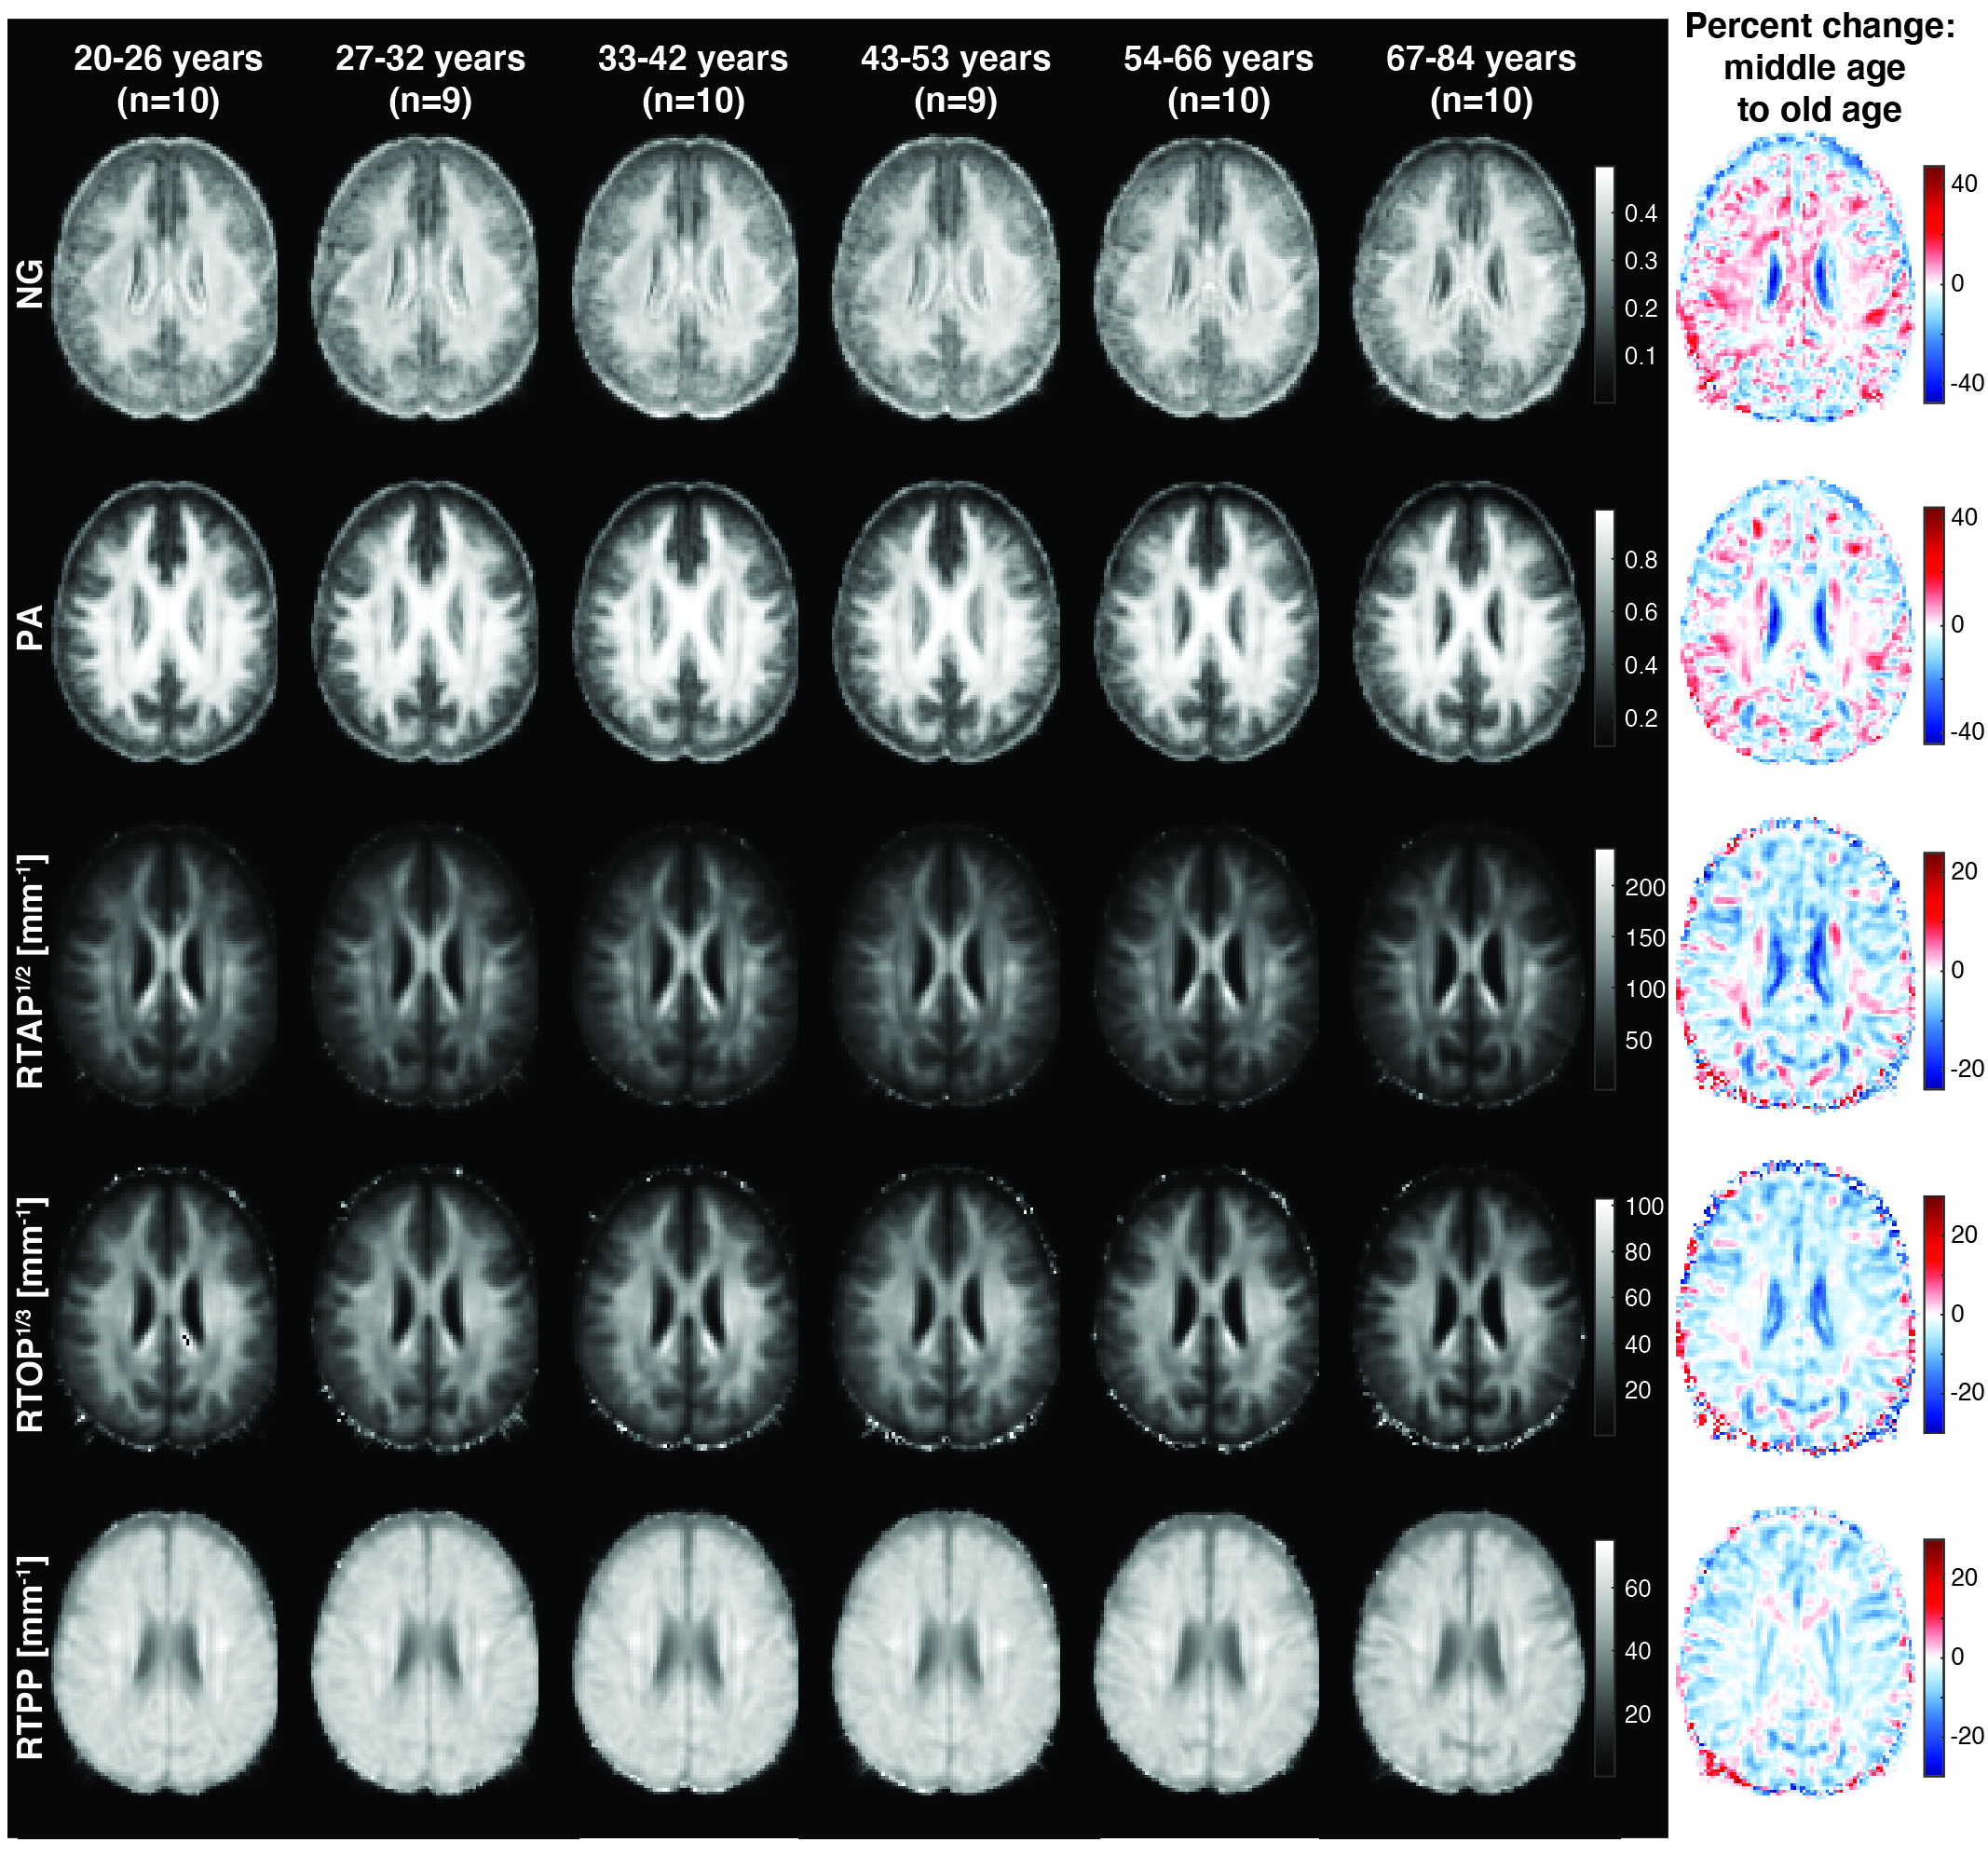
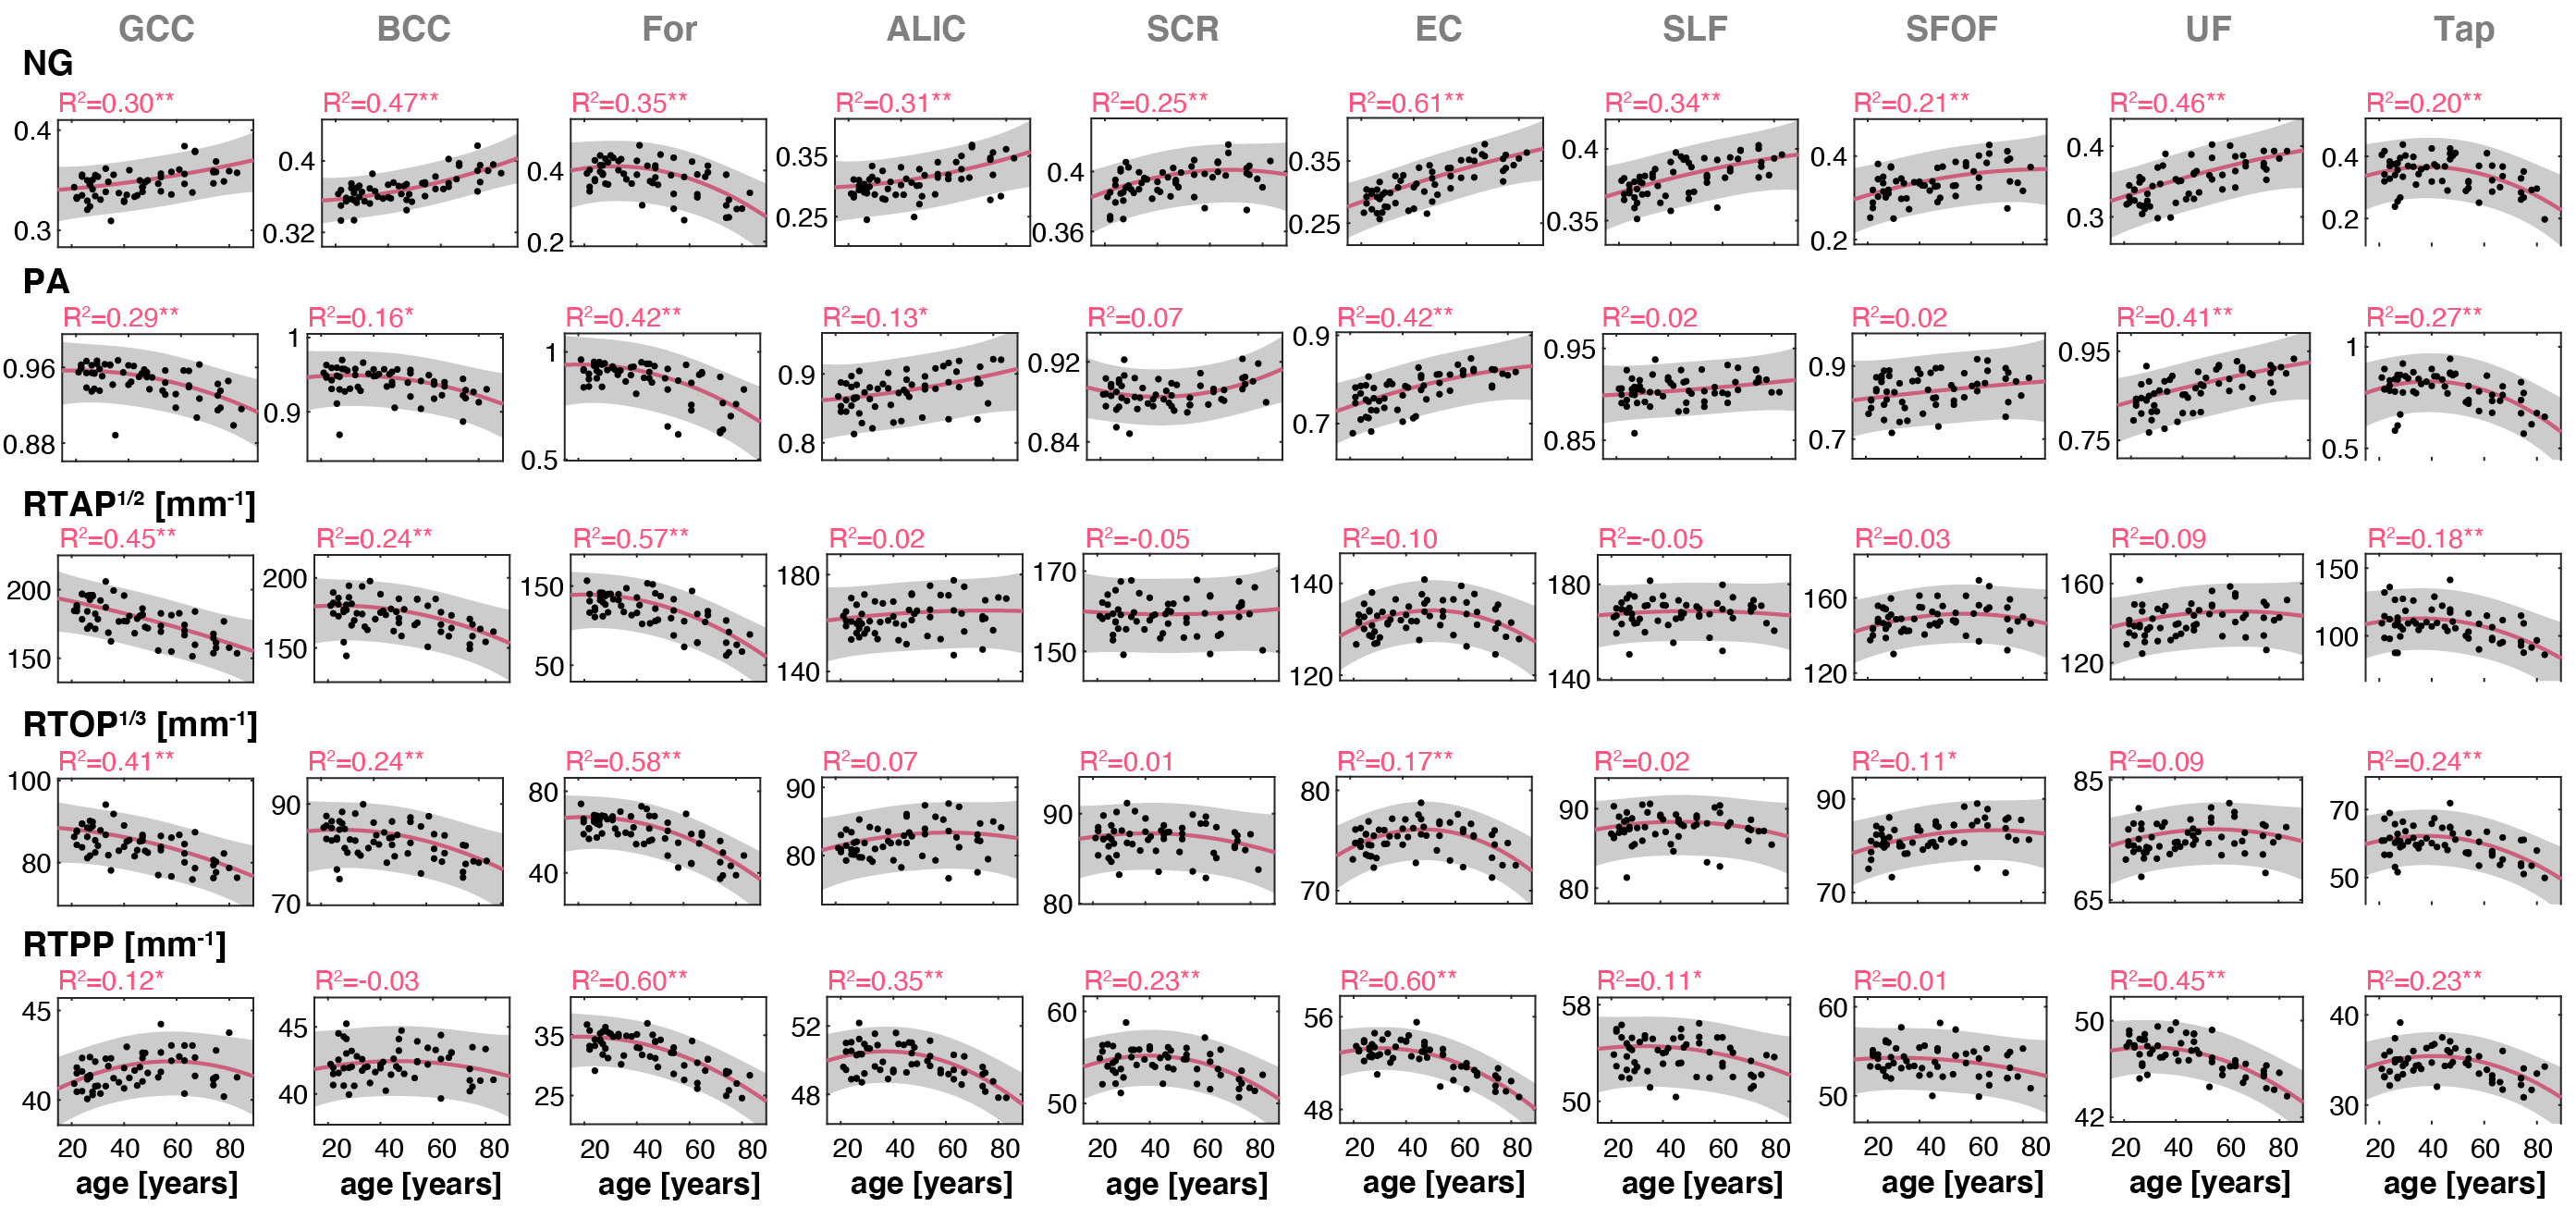
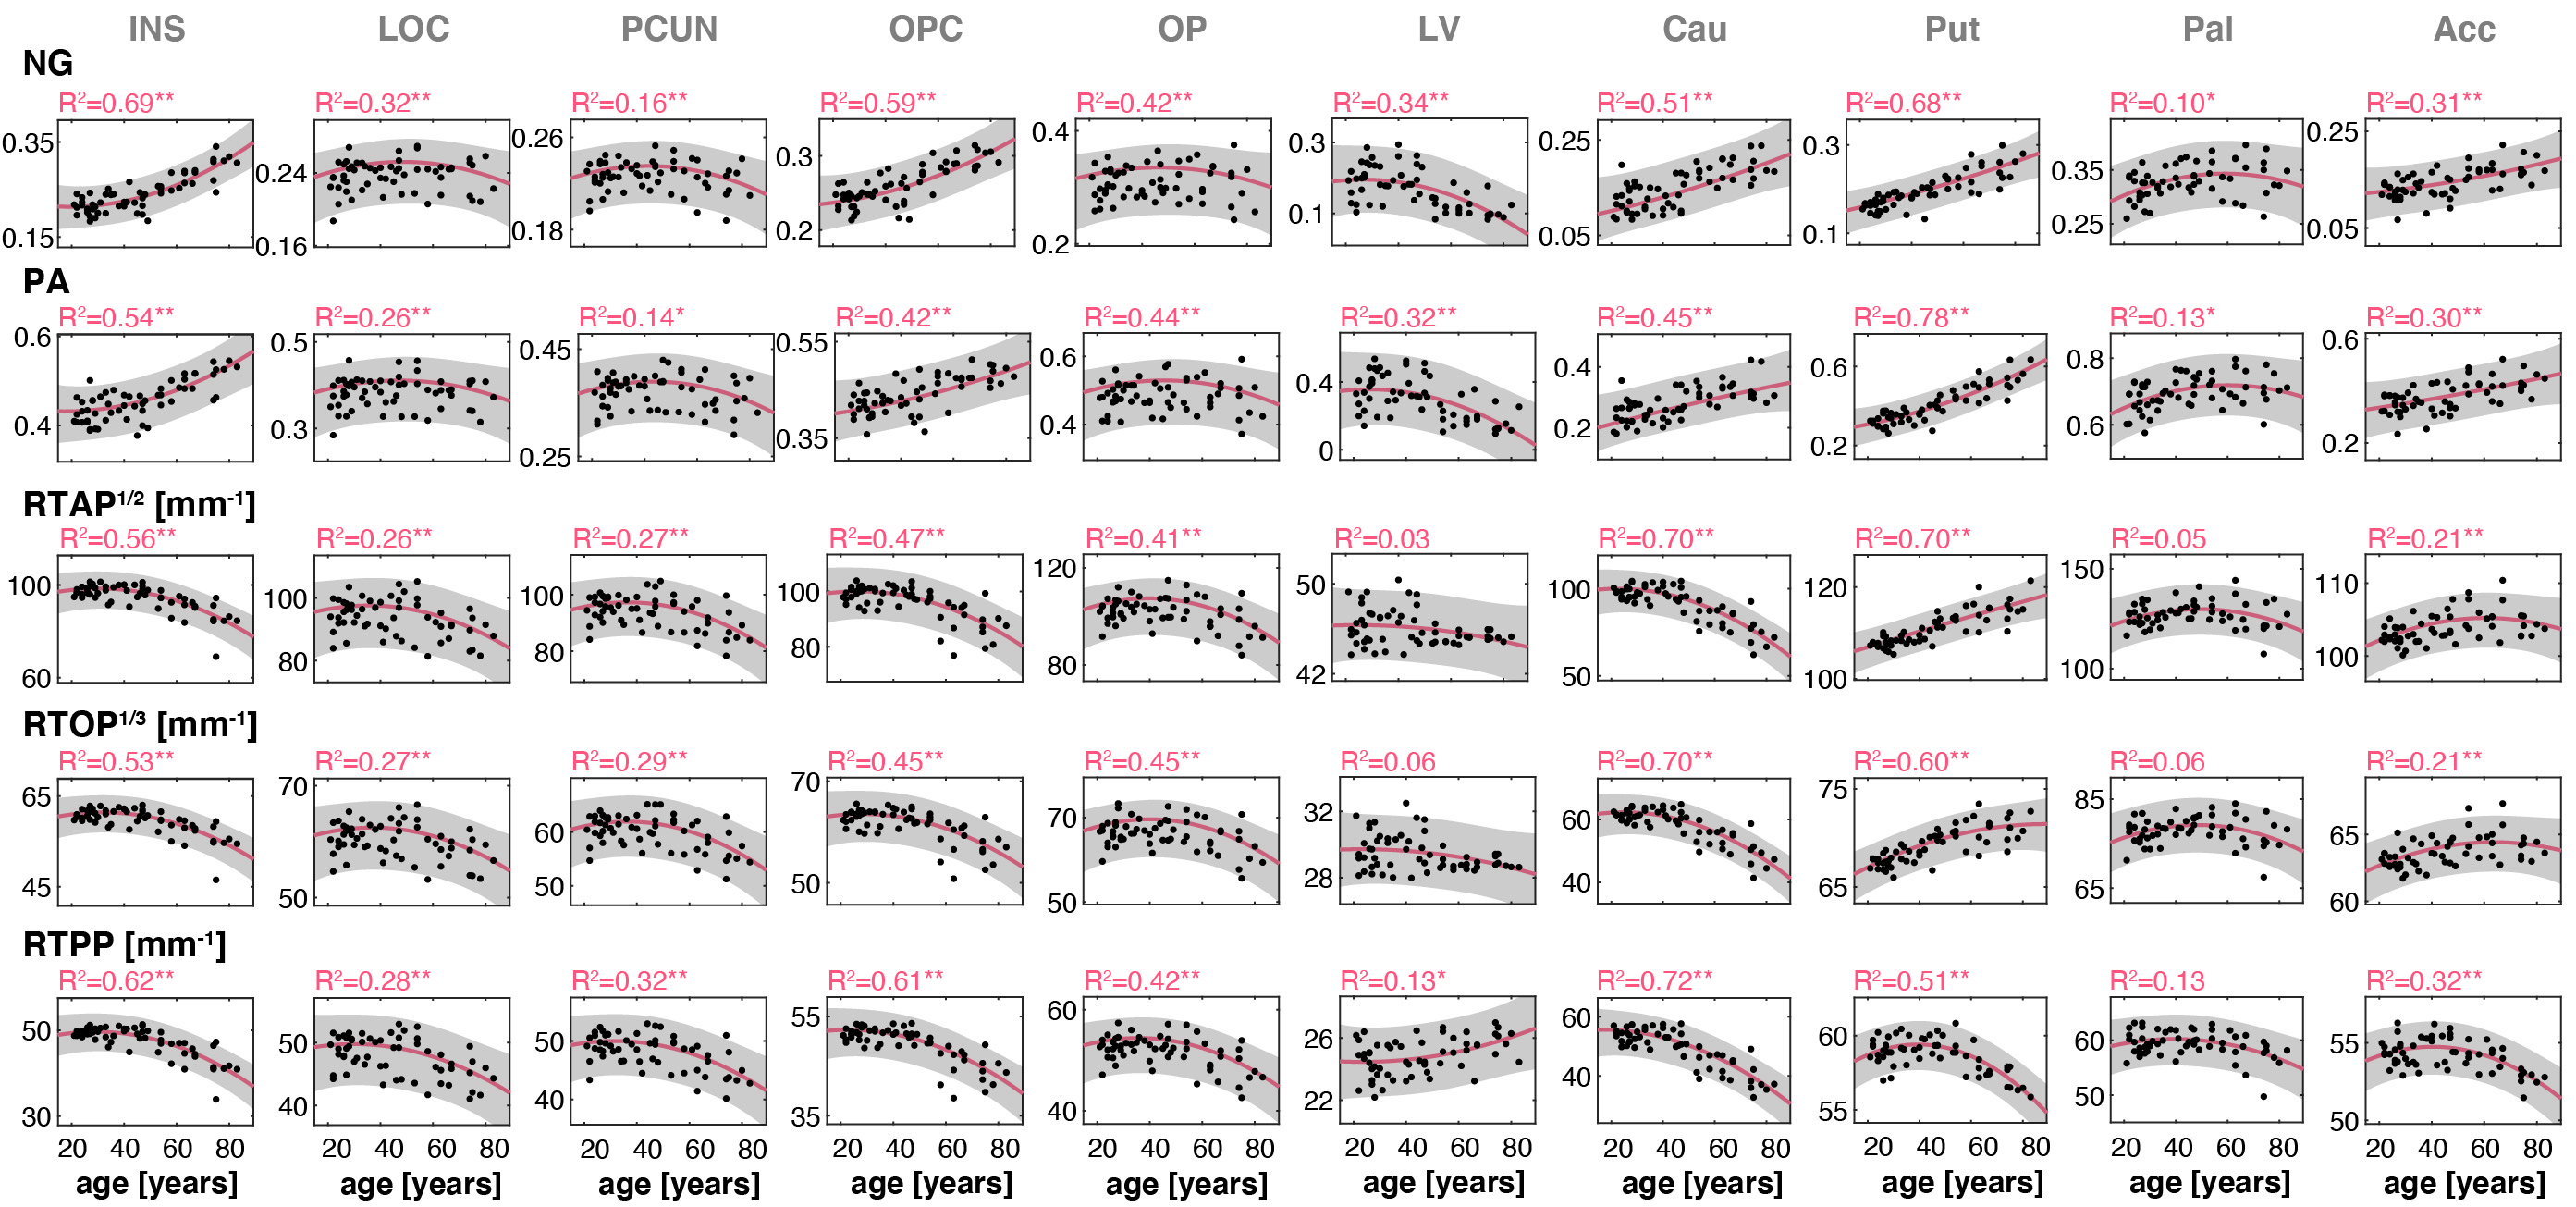
Figure 2 shows a representative slice from averaged derived MAP parameter maps of participants within six age groups spanning the full age range of our cohort. Visual inspection suggests that the NG exhibited the largest degrees of spatial variability and overall magnitude of difference with age. Similar spatial patterns were observed for PA. The zero-displacement probabilities indicated, overall, lower values with age in most brain regions.At the ROI level, all indices exhibited differential associations with respect to age across the 36 ROIs investigated. In WM, the NG exhibited a positive and significant association with age in all ROIs, apart from the For and Tap, which showed negative associations with age (Fig. 3). The PA in WM also exhibited heterogenous age-related differences, in which significantly lower values of PA with age were found in the GCC, BCC, For, and Tap, while significantly higher values were observed in the ALIC, EC, and UF. The zero-displacement probabilities showed quadratic inverted U-shaped associations with age in most WM ROIs. In GM, however, the NG metric exhibited mixed trends with either positive or negative age associations. The associations of NG with age in GM ROIs were all statistically significant (Fig. 4). For PA, the regional associations with age were all significant, and interestingly, were consistent and followed the regional patterns of the NG in GM. Further, RTAP, RTOP, and RTPP exhibited quadratic, inverted U-shaped, associations with age, with patterns similar to those seen in WM.
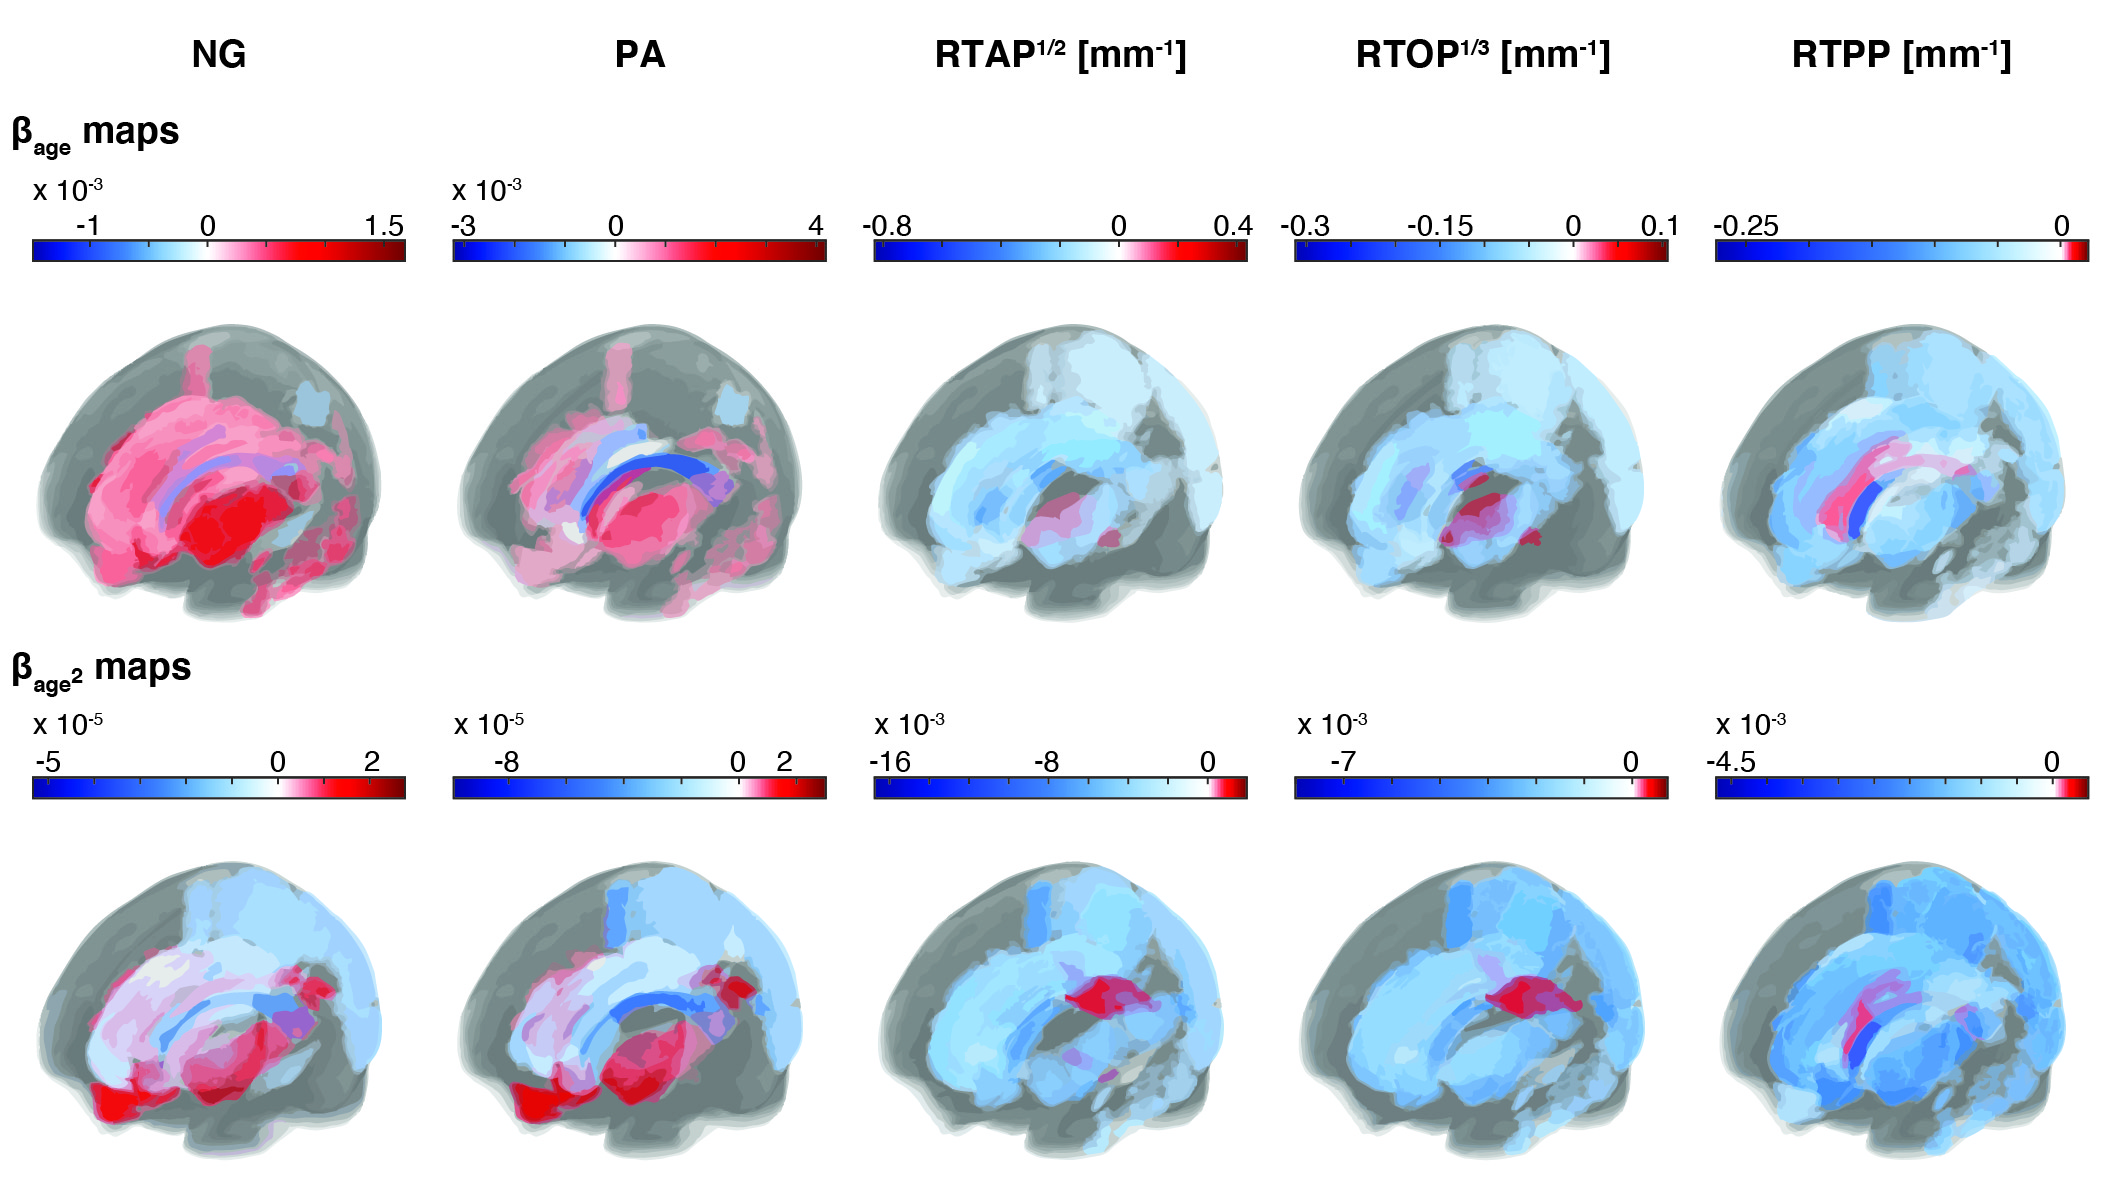
To visualize the spatial distribution of the microstructural differences with age in the brain, Fig. 5 show the 36 ROIs color-coded with $$$\beta_{age}$$$ (rate of maturation from young to adult) and $$$\beta_{age^{2}}$$$ (direction and steepness of the quadratic curvature) of each parameter, respectively. For each metric and ROI, only statistically significant differences are shown. Zero-displacement probability parameters mostly exhibited similar and spatially consistent trends of differences with respect to age. The NG and PA, however, reveal a more complex microstructural picture, in which not all brain regions in deep WM, cortical or subcortical GM, exhibit similar age-related differences. As noted earlier, the age dependency patterns of the PA and NG in all GM ROIs were similar, and negative age-dependency patterns were seen in five out of the 13 cortical GM ROIs, all of which were located in the occipital lobe.
Discussion
In this cross-sectional study we show that the MAP-MRI metrics are sensitive markers of age-associated micro- and meso-structural tissue alterations and allow a novel characterization of microstructural differences in cerebral tissue with age that cannot be achieved using conventional DTI measures. This work provides the first investigation of the NG and PA as a function of age across several brain structures. These two indices exhibited a strong association with age, which sheds light on a potential biological interpretation of previously observed DTI trends related to brain maturation and degeneration. In WM, we established an opposing pattern of higher NG alongside lower PA among older adults, likely reflecting axonal degradation, leading to a relative rise in extracellular volume. In GM, however, these two indices were consistent with one another, and the distinct age-related patterns of the PA could indicate fewer neuronal projections across cortical layers, along with an increased glial concentration. Results from this study may be useful in understanding biophysical changes occurring during normal aging, and in encouraging the use of MAP-MRI to study aging and facilitate comparisons in a variety of diseases or abnormal conditions.Acknowledgements
This work was supported by the Intramural Research Program of the National Institute on Aging of the National Institutes of Health. AVA was supported by the Center for Neuroscience and Regenerative Medicine Neuroradiology-Neuropathology Correlation Core.References
1. Resnick, S. M., Pham, D. L., Kraut, M. A., Zonderman, A. B., & Davatzikos, C. (2003). Longitudinal Magnetic Resonance Imaging Studies of Older Adults: A Shrinking Brain. The Journal of Neuroscience, 23(8), 3295–3301.
2. Schilling, K. G., Archer, D., Yeh, F.-C., Rheault, F., Cai, L. Y., Hansen, C., Yang, Q., Ramdass, K., Shafer, A. T., Resnick, S. M., Pechman, K. R., Gifford, K. A., Hohman, T. J., Jefferson, A., Anderson, A. W., Kang, H., & Landman, B. A. (2022). Aging and white matter microstructure and macrostructure: a longitudinal multi-site diffusion MRI study of 1218 participants. Brain Structure and Function, 227(6), 2111–2125.
3. Qian, W., Khattar, N., Cortina, L. E., Spencer, R. G., & Bouhrara, M. (2020). Nonlinear associations of neurite density and myelin content with age revealed using multicomponent diffusion and relaxometry magnetic resonance imaging. NeuroImage, 223, 117369.
4. Kiely, M., Triebswetter, C., Cortina, L. E., Gong, Z., Alsameen, M. H., Spencer, R. G., & Bouhrara, M. (2022). Insights into human cerebral white matter maturation and degeneration across the adult lifespan. NeuroImage, 247, 118727.
5. Özarslan, E., Koay, C. G., Shepherd, T. M., Komlosh, M. E., Irfanoǧlu, M. O., Pierpaoli, C., & Basser, P. J. (2013). Mean apparent propagator (MAP) MRI: A novel diffusion imaging method for mapping tissue microstructure. NeuroImage, 78, 16–32.
6. Pierpaoli, C., Barnett, A. S., Basser, P. J., Chang, L.-C., Koay, C. G., Pajevic, S., Rohde, G. K., Sarlls, J., & Wu, M. (2010). TORTOISE: an integrated software package for processing of diffusion MRI data. ISMRM 18th Annual Meeting.
7. Joshi, S., Davis, B., Jomier, M., & Gerig, G. (2004). Unbiased diffeomorphic atlas construction for computational anatomy. NeuroImage, 23, S151–S160.
Figures