0964
Characterization of normal appearing white matter in Multiple Sclerosis with diffusion MRI using signal representations and model parameters1Radiology, NYU School of Medicine, NEW YORK, NY, United States
Synopsis
Keywords: Diffusion/other diffusion imaging techniques, Diffusion/other diffusion imaging techniques
Multiple sclerosis (MS) is a neurodegenerative and inflammatory disease characterized by focal lesions and damages to normal appearing white matter (NAWM). Diffusion MRI (dMRI) is known for its sensitivity to the microstructural changes in white matter. In this work, we study the sensitivity of dMRI metrics to MS pathology in NAWM by distinguishing MS patients from healthy controls. We found that beyond-spherical-mean rotational invariants of high-b shells contribute mostly to the classification, indicating nontrivial information content of high-b diffusion signal beyond DTI.Introduction
Multiple sclerosis (MS) is the most prevalent chronic inflammatory disease of the central nervous system. Pathologically, MS is characterized by both focal inflammatory lesions, as detected with T1 and T2 weighted MRI, and diffuse injury of the normal-appearing white matter (NAWM) caused by neurodegenerative and inflammatory processes [1-2]. Diffusion MRI (dMRI) provides a noninvasive tool to probe brain white matter (WM) microstructure and cellular pathology. The aim of this study is to assess the sensitivity of dMRI to MS pathology in NAWM using a large dataset (N=354) of multi-shell dMRI acquired in clinic. The sensitivity is quantified by the classification accuracy of distinguishing MS patients from healthy controls, using diffusion kurtosis imaging (DKI) metrics [3-4], Standard Model (SM) [5-6] parameters and rotational invariants (RotInv) [5], respectively.Methods
MRI and preprocessing. We retrospectively studied MRI of 177 subjects (age 48.47 ± 9.78 years old, 119 females) identified with a clinical diagnosis of MS using the McDonald criteria [7]. 177 healthy subjects (age 48.47 ± 9.76 years old, 119 females), with normal brain MRI and no medical history of neurological disorder, were selected as controls with matching age and sex. Both MS patients and controls underwent clinically indicated MRI on a 3T Siemens Magnetom Prisma (46.3%) or Skyra (53.7%) scanner. The dMRI protocol included a monopolar EPI sequence as follows: 4–5 b = 0 images, b = 1 ms/μm2 along 20 directions and b = 2 ms/μm2 along 60 directions, with imaging parameters: 50 slices, 130 × 130 matrix, voxel size = 1.7 × 1.7 × 3 mm, TE = 70–96 ms and TR = 3200–4000 ms on Prisma, TE = 95–100 ms and TR = 3500–4300 ms on Skyra, GRAPPA acceleration 2, and multiband 2. The total acquisition time is approximately 6 minutes. The dMRI data was processed by DESIGNER [8], an automated pipeline, for denoising [9], Gibbs artifact correction [10], EPI-induced distortion correction [11], motion and eddy current artifact correction [12] and Rician noise floor correction [13]. DKI parameters were fitted using weighted linear least square [14], SM parameters were estimated using a machine learning estimator [6], and RotInvs were extracted for each b-shell as defined in [5]. ROIs were automatically segmented by a nonlinear mapping onto the JHU WM label atlas [15]. For each diffusion parameter, the mean of each ROI was extracted for further analysis after excluding voxel outliers defined as ±2σ away from ROI mean, where σ is the standard deviation within an ROI.Classification. Logistic regression (LR) classifiers were built in a sequential manner for each ROI using DKI, SM and RotInv, respectively. At each step, one metric was added to the classifier that maximizes the classification accuracy in the k-fold validation (k=5). As there were no signs of overfitting, all metrics were used in the classifier eventually. Likewise, cross-ROI classifiers were built by adding features across ROIs. The stop criterion was when the validation accuracy stopped to increase. Prior to the training of classifiers, each metric was standardized by $$$\frac{x-\mu}{\sigma}$$$, where $$$\mu$$$ is the mean and $$$\sigma$$$ is the standard deviation. Age and sex were included as features for each classifier before adding dMRI metrics. Weights of LR classifiers associated with each input feature represent the importance for distinguishing between groups.
Results
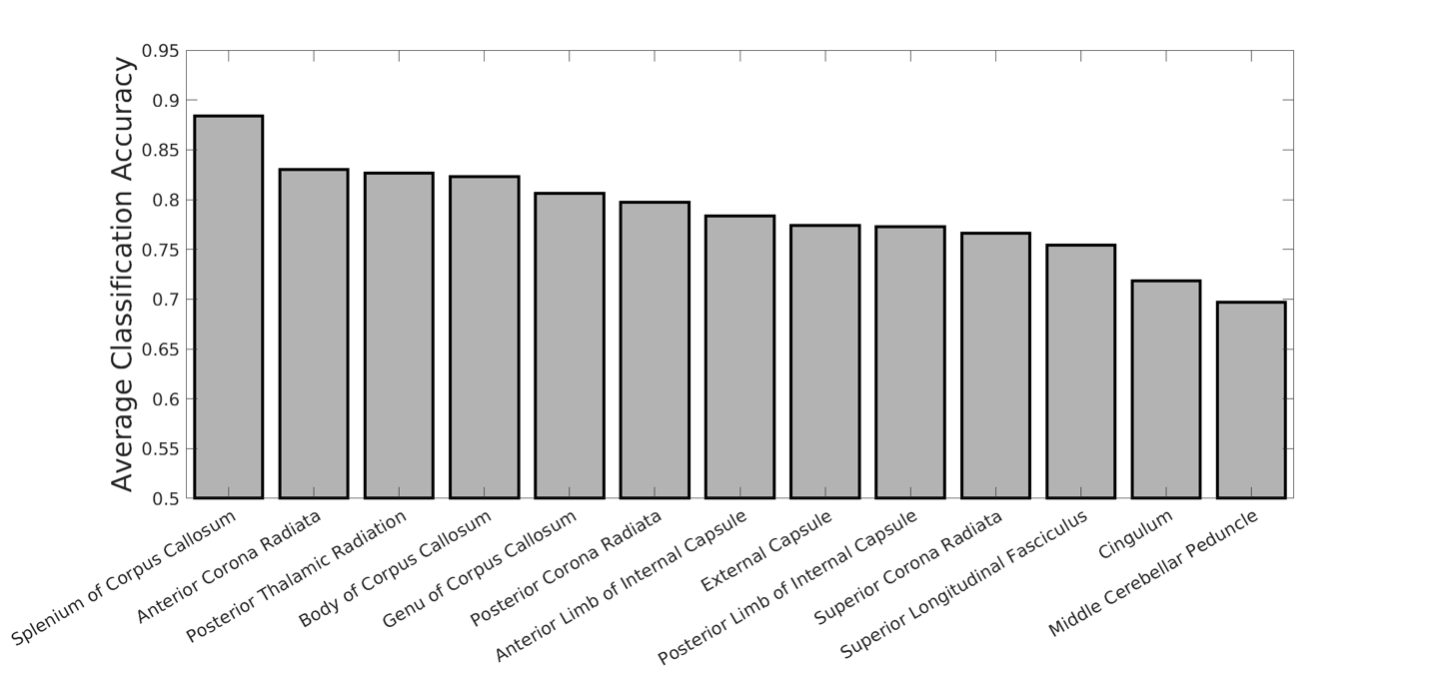
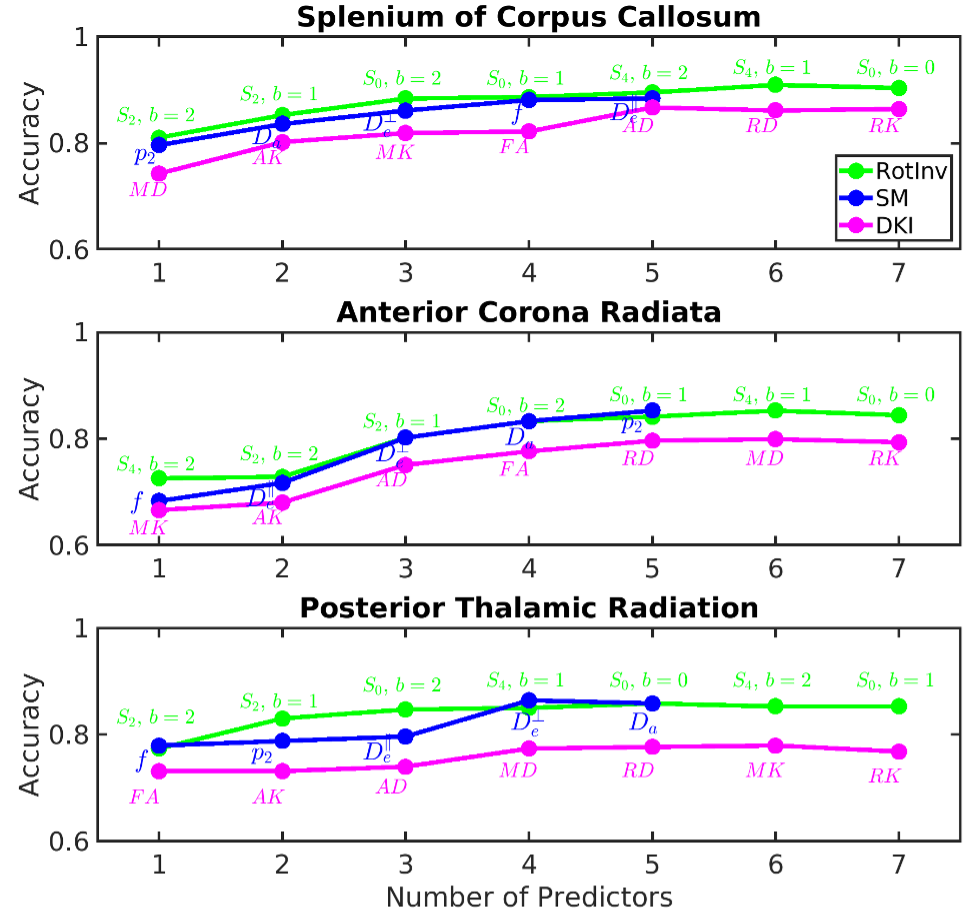
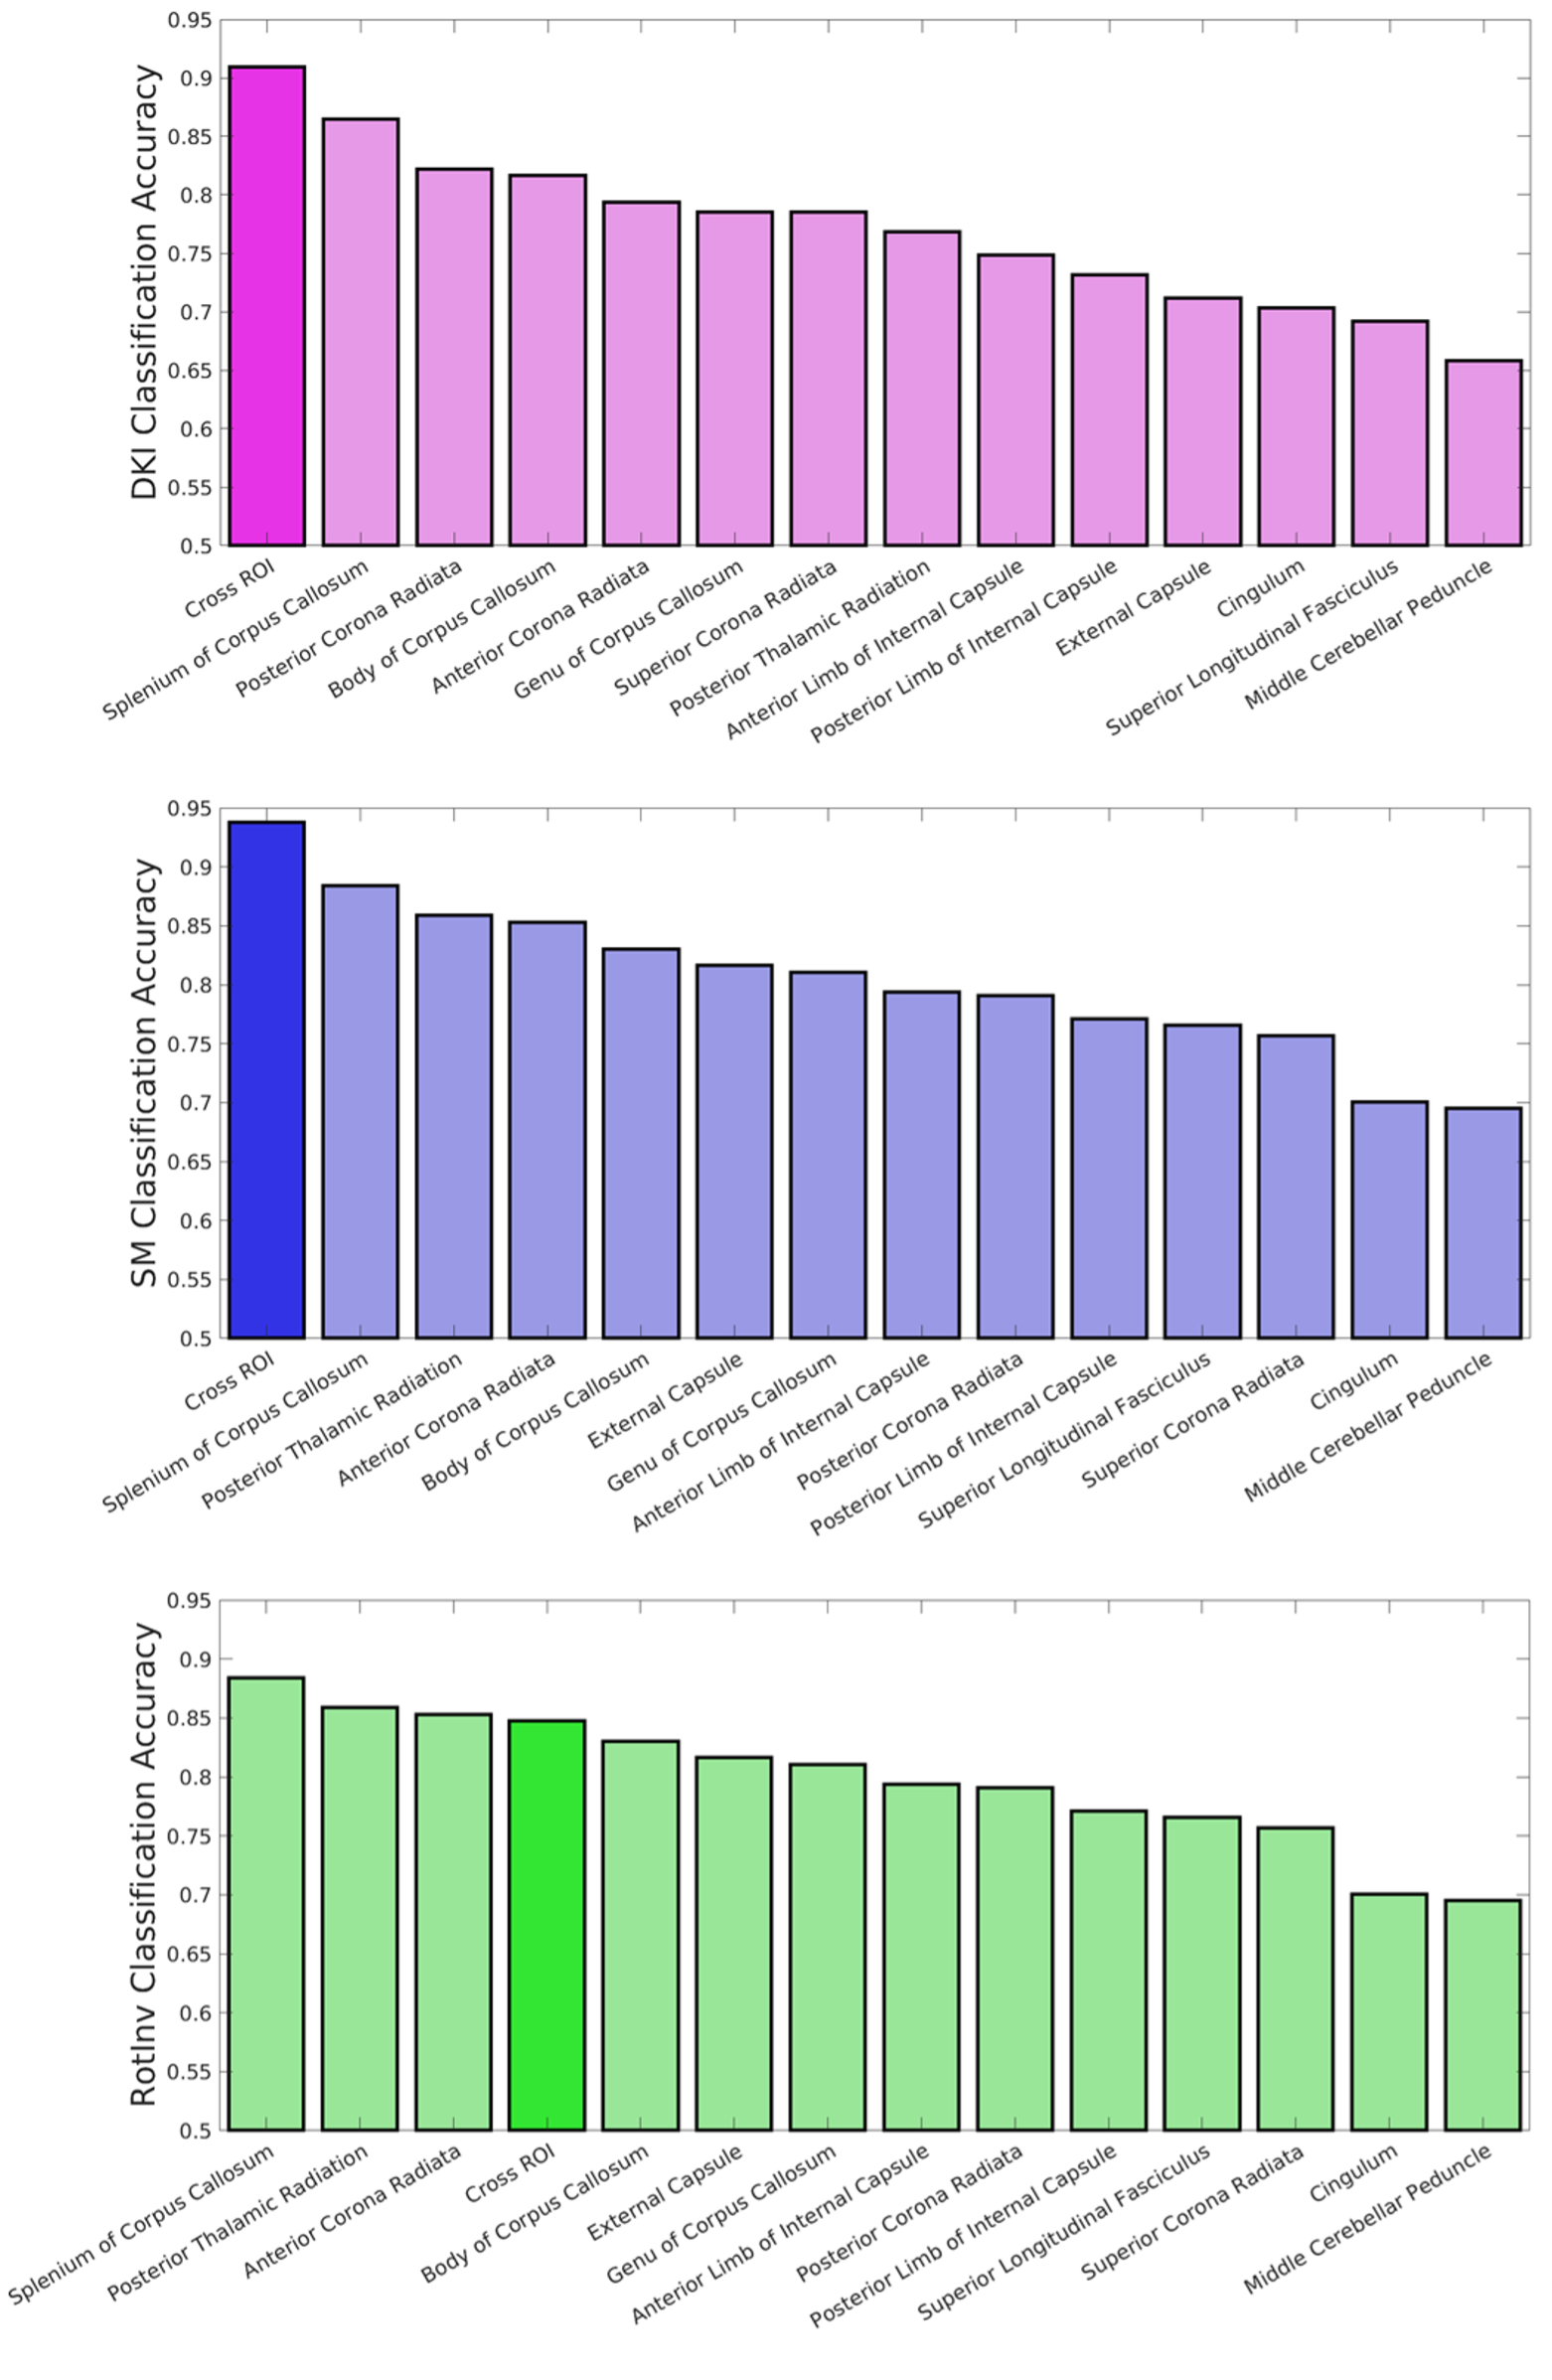
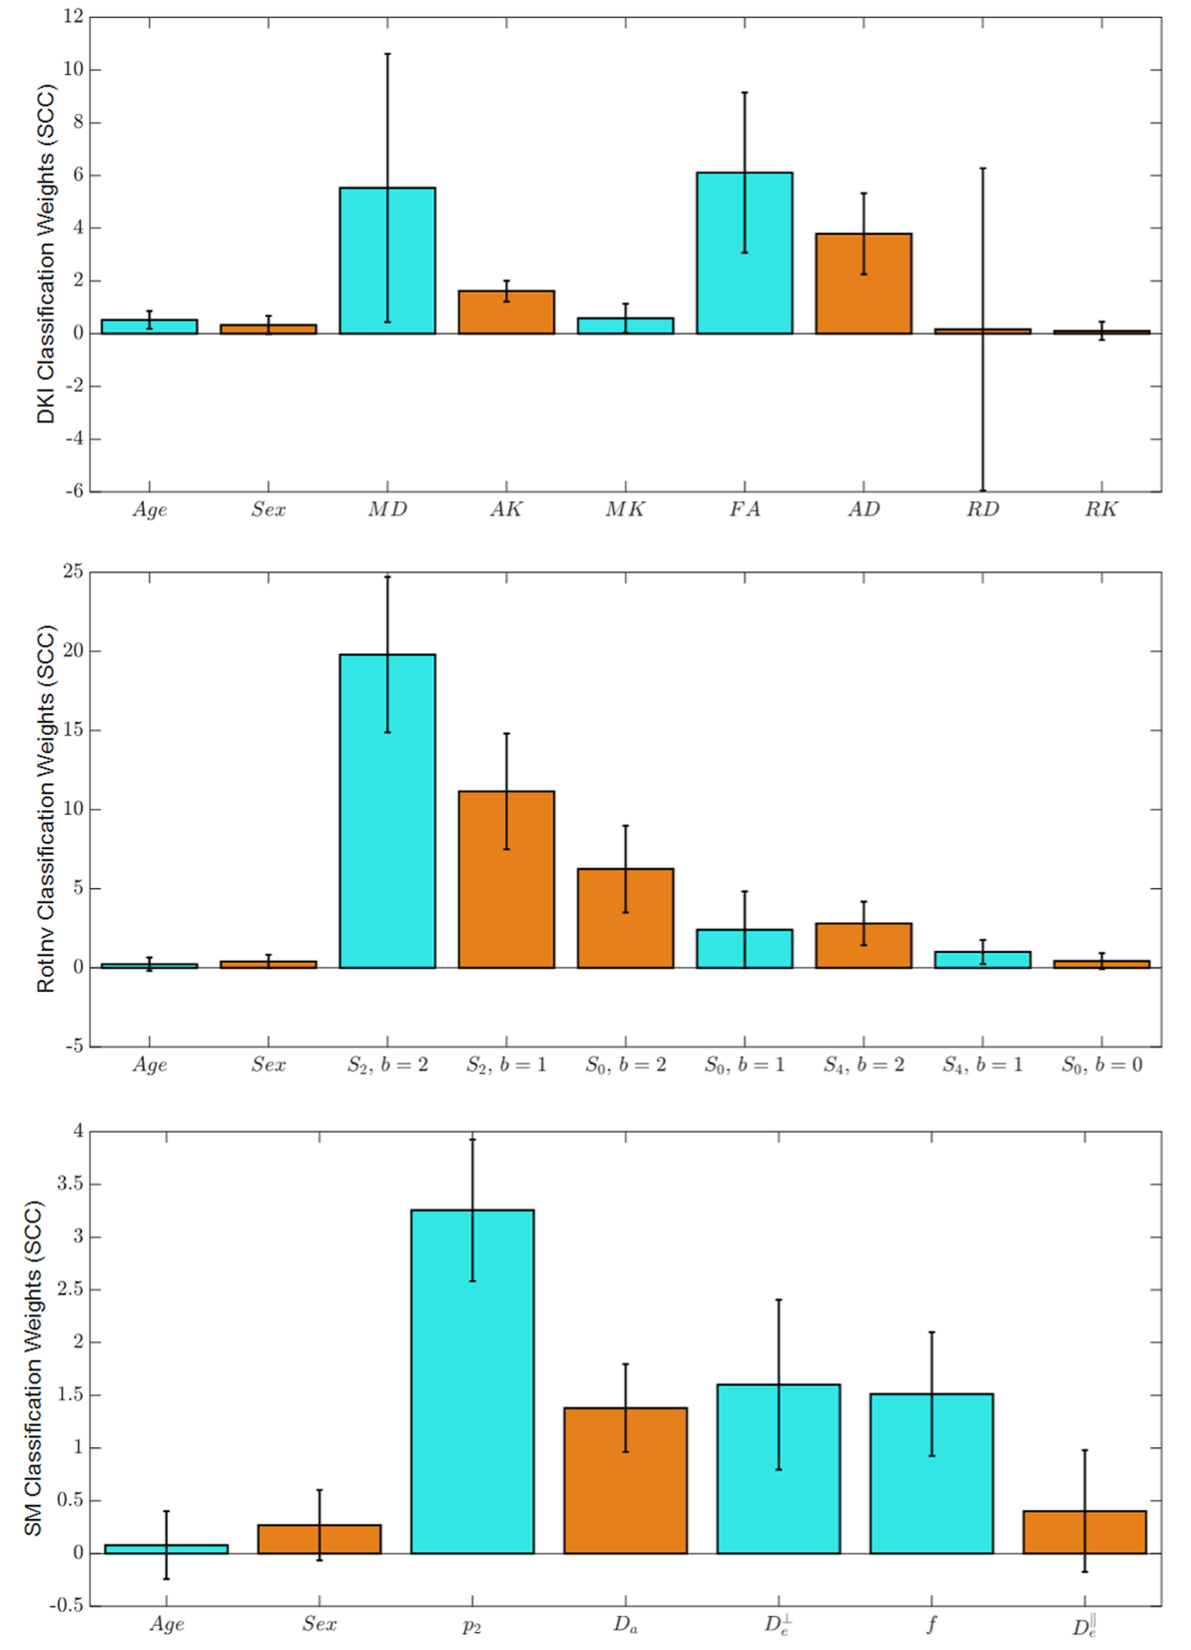
Fig. 1 shows the average accuracy over DKI, SM and RotInv for each ROI. Splenium of corpus callosum (SCC) leads all ROIs with 88% accuracy. Fig. 2 shows the dMRI metrics added at each step of building the classifiers. The classification accuracy rises steadily as more features are added with few signs of overfitting. Overall, classifiers using RotInv and SM metrics hold a moderate advantage over DKI metrics. Fig. 3 shows that by combining metrics from different ROIs, higher accuracy can be achieved for DKI and SM metrics. However, the greedy feature selection did not find the best combination of RotInv features for RotInv, as the cross-ROI classifier is outperformed by that of SCC. Fig. 4 shows the weights of LR classifiers for SCC, where S2 of b = 2 ms/μm2, FA and $$$p_2$$$ carry the largest weight in their corresponding classifiers.Discussions and conclusions
By using a simple linear classifier, we achieve nearly 90% accuracy for MS classification from healthy controls, where SCC is the most sensitive ROI to MS pathology. This result suggests that, outside of MS lesions, NAWM is also clearly affected by MS pathology. With greater specificity to microstructural changes, SM parameters show no loss of sensitivity to MS pathology, compared to signal representations like RotInv and DKI. Further, according to the weights of LR classifiers, the decrease in dMRI signal anisotropy is primarily responsible for differentiating MS patients from controls. Remarkably, S2 of b = 2 ms/μm2, the beyond-spherical-mean RotInv of the largest b-shell in our protocol, contributes mostly to the classification, indicating the nontrivial information content of high-b diffusion signal beyond DTI.Acknowledgements
This work was performed under the rubric of the Center for Advanced Imaging Renovation and Research (CAI24, https://www.cai2r.net), a NIBIB Biomedical Technology Research Center (NIH P41EB017183). This work has been supported by NIH under NINDS award R01NS088040 and NIBIB award R01EB027075.References
[1] Lassmann, Hans, Wolfgang Brück, and Claudia F. Lucchinetti. "The immunopathology of multiple sclerosis: an overview." Brain pathology 17.2 (2007): 210-218.
[2] Frischer, Josa M., et al. "The relation between inflammation and neurodegeneration in multiple sclerosis brains." Brain 132.5 (2009): 1175-1189.
[3] Basser, Peter J., James Mattiello, and Denis LeBihan. "MR diffusion tensor spectroscopy and imaging." Biophysical journal 66.1 (1994): 259-267.
[4] Jensen, Jens H., et al. "Diffusional kurtosis imaging: the quantification of non‐gaussian water diffusion by means of magnetic resonance imaging." Magnetic Resonance in Medicine: An Official Journal of the International Society for Magnetic Resonance in Medicine 53.6 (2005): 1432-1440.
[5] Novikov, Dmitry S., et al. "Rotationally-invariant mapping of scalar and orientational metrics of neuronal microstructure with diffusion MRI." NeuroImage 174 (2018): 518-538.
[6] Reisert, Marco, et al. "Disentangling micro from mesostructure by diffusion MRI: a Bayesian approach." Neuroimage 147 (2017): 964-975.
[7] Polman, Chris H., et al. "Diagnostic criteria for multiple sclerosis: 2010 revisions to the McDonald criteria." Annals of neurology 69.2 (2011): 292-302.
[8] Ades-Aron, Benjamin, et al. "Evaluation of the accuracy and precision of the diffusion parameter EStImation with Gibbs and NoisE removal pipeline." Neuroimage 183 (2018): 532-543.
[9] Veraart, Jelle, et al. "Denoising of diffusion MRI using random matrix theory." Neuroimage 142 (2016): 394-406.
[10] Lee, Hong‐Hsi, Dmitry S. Novikov, and Els Fieremans. "Removal of partial Fourier‐induced Gibbs (RPG) ringing artifacts in MRI." Magnetic Resonance in Medicine 86.5 (2021): 2733-2750.
[11] Andersson, Jesper LR, Stefan Skare, and John Ashburner. "How to correct susceptibility distortions in spin-echo echo-planar images: application to diffusion tensor imaging." Neuroimage 20.2 (2003): 870-888.
[12] Smith, Stephen M., et al. "Advances in functional and structural MR image analysis and implementation as FSL." Neuroimage 23 (2004): S208-S219.
[13] Koay, Cheng Guan, Evren Özarslan, and Peter J. Basser. "A signal transformational framework for breaking the noise floor and its applications in MRI." Journal of magnetic resonance 197.2 (2009): 108-119.
[14] Veraart, Jelle, et al. "Weighted linear least squares estimation of diffusion MRI parameters: strengths, limitations, and pitfalls." Neuroimage 81 (2013): 335-346.
[15] Mori, S., et al. "MRI atlas of human white matter." American Journal of Neuroradiology 27.6 (2006): 1384.
Figures