0961
Automatic segmentation of cortical cytoarchitectonic domains measured with high-resolution MAP-MRI1Eunice Kennedy Shriver National Institute of Child Health and Human Development, National Institutes of Health, Bethesda, MD, United States, 2Center for Neuroscience and Regenerative Medicine, Bethesda, MD, United States, 3Henry M. Jackson Foundation for the Advancement of Military Medicine Inc., Bethesda, MD, United States
Synopsis
Keywords: Microstructure, Gray Matter, MAP-MRI, cortical parcellation, cortical layers
We investigate the feasibility of using advanced diffusion MRI, specifically MAP-MRI, to automatically segment microstructural domains based on subject-specific intrinsic cortical cytoarchitectonic features. Our preliminary results suggest that MAP-derived cytoarchitectonic domains delineate boundaries between cortical areas and layers in good agreement with histology. Segmentation methods that leverage the sensitivity of high-resolution MAP parameters to cortical cytoarchitecture have the potential to augment and refine current techniques for automatic cortical parcellation that rely on atlas registration.Introduction
Cortical parcellation is an indispensable tool for studying the structure, function, and organization of the healthy and diseased brain. Current methods for large-scale cortical parcellation rely on the diffeomorphic registration of a subject’s brain to a standardized template with labeled cortical regions1. The structural T1W or T2W scans used for this purpose have excellent contrast between gray matter (GM) and white matter (WM) but no sensitivity to cortical cytoarchitectonic features. Consequently, atlas-registration-based cortical parcellation methods can accurately delineate boundaries between cortical areas aligned with gross anatomical landmarks such as the major sulci and gyri, but their lack of cytoarchitectonic contrast makes a finer parcellation problematic.Recent studies have shown that high-resolution diffusion MRI in general2-8, and mean apparent propagator (MAP) MRI9,10 in particular, have high sensitivity to cortical cytoarchitectonic features allowing us to distinguish areal boundaries and lamination patterns11. We assess the feasibility of using local k-means clustering of voxelwise high-resolution MAP parameters to refine the cortical parcellation estimation obtained with atlas-based registration and to generate a subject-specific segmentation of cytoarchitectonic domains observed with histology.
Methods
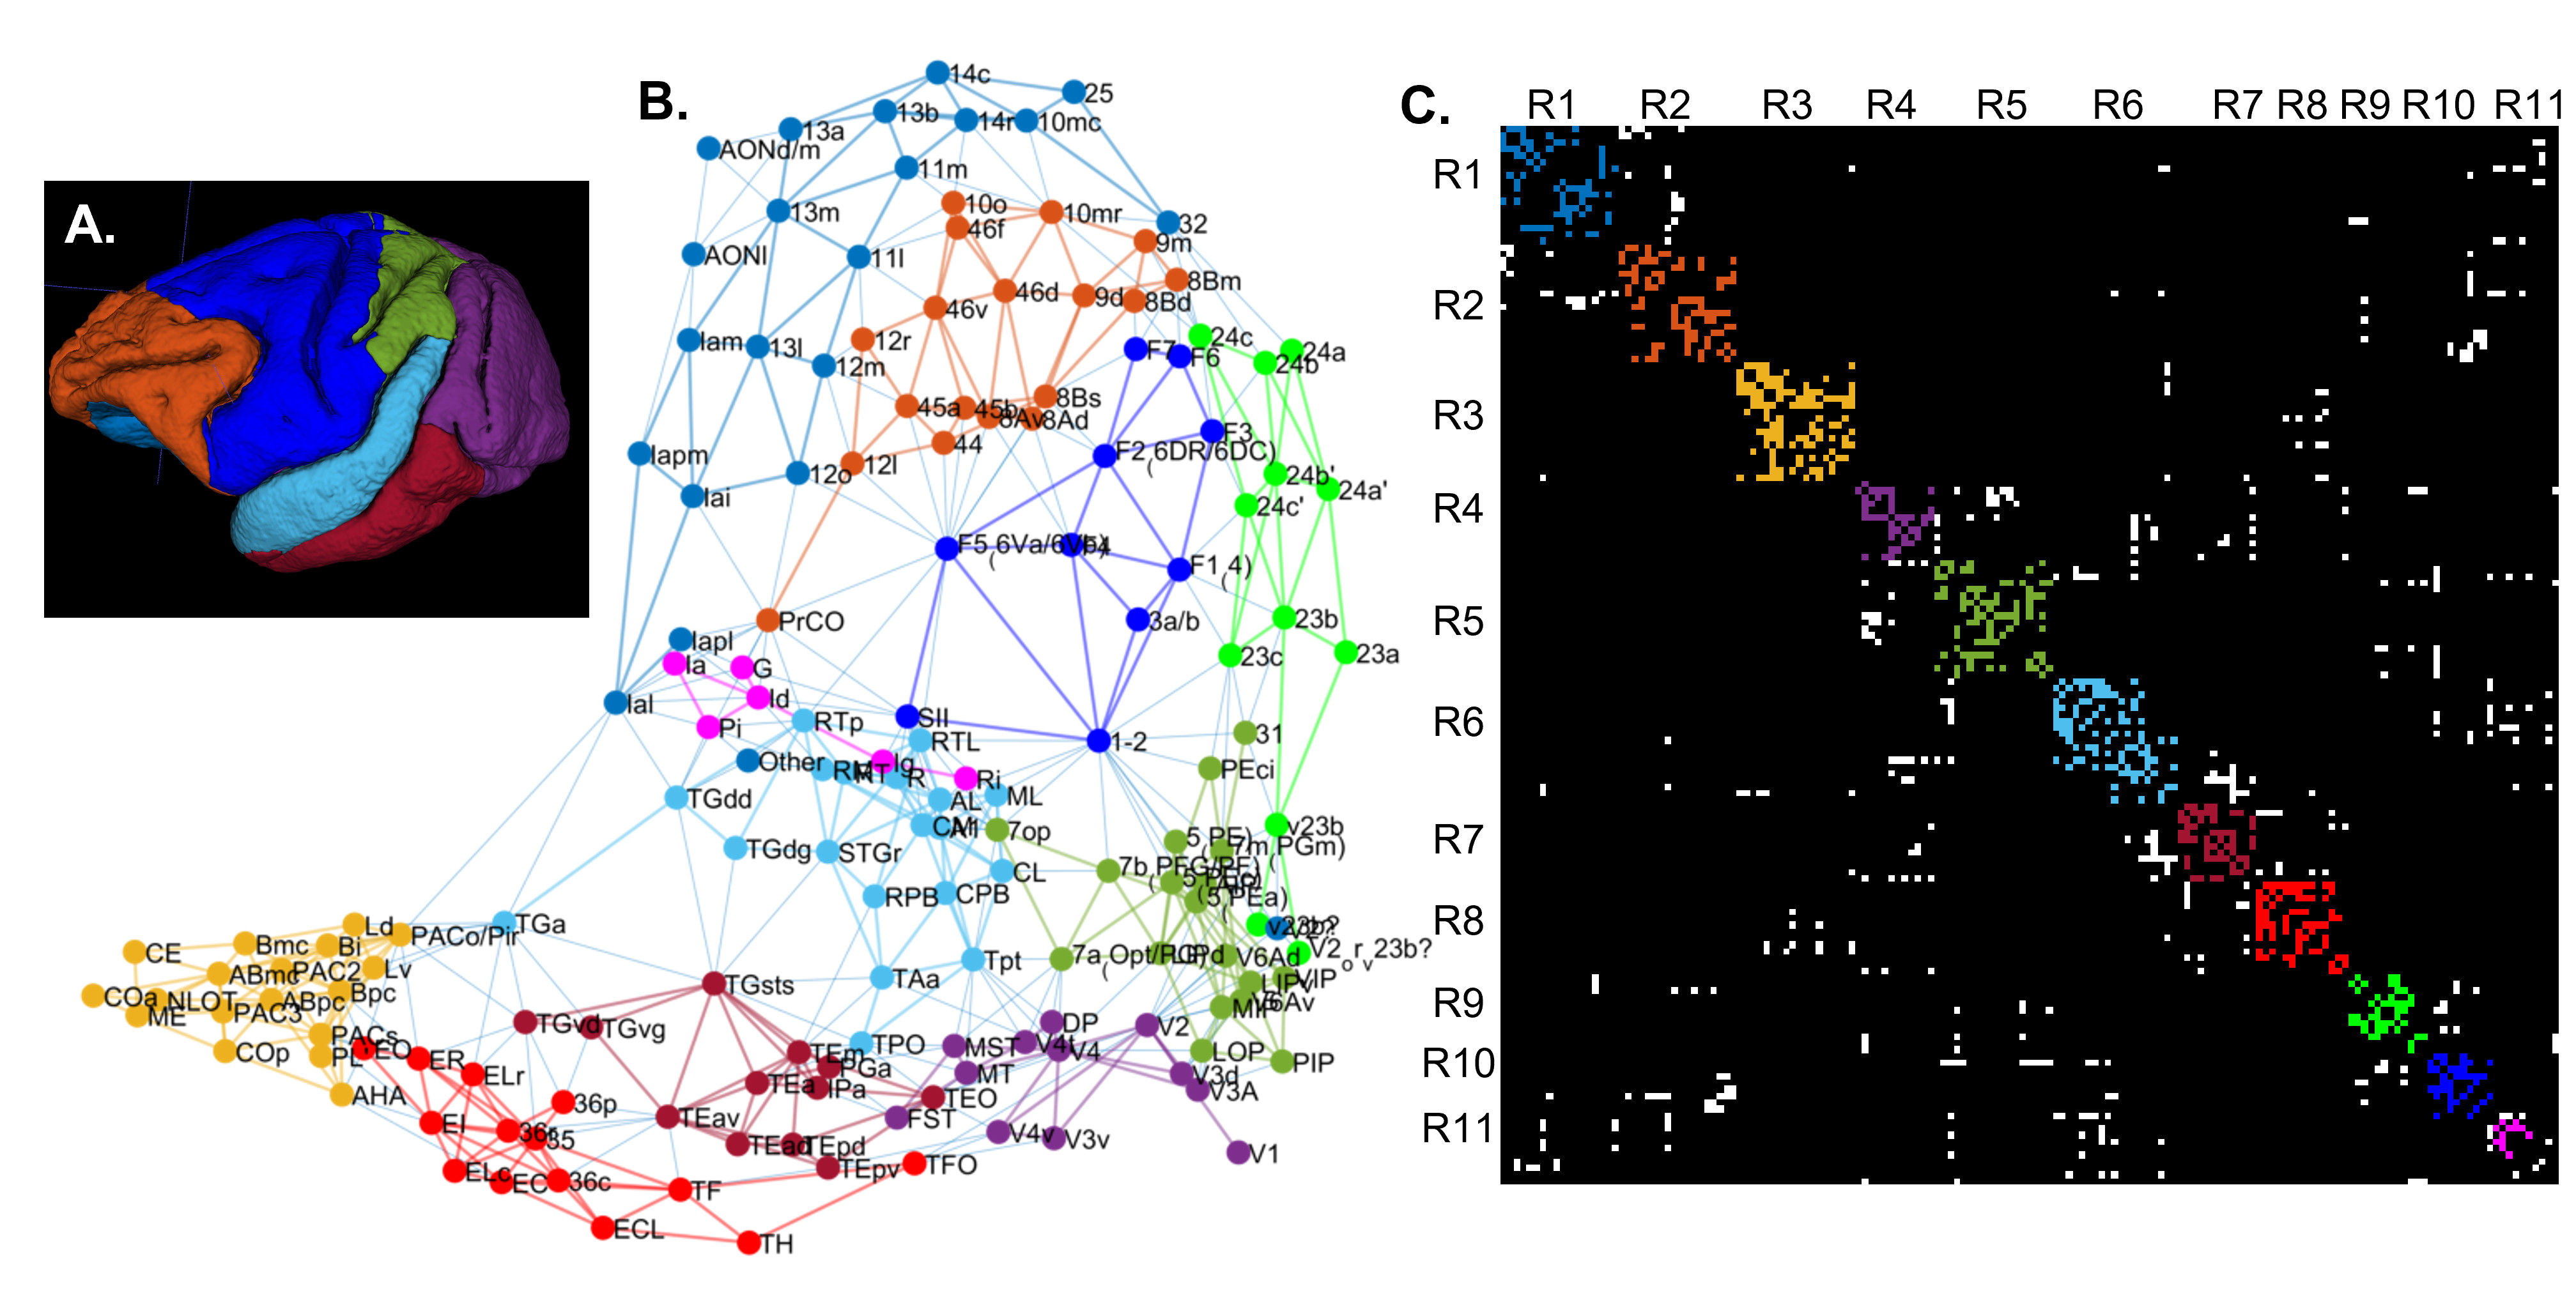
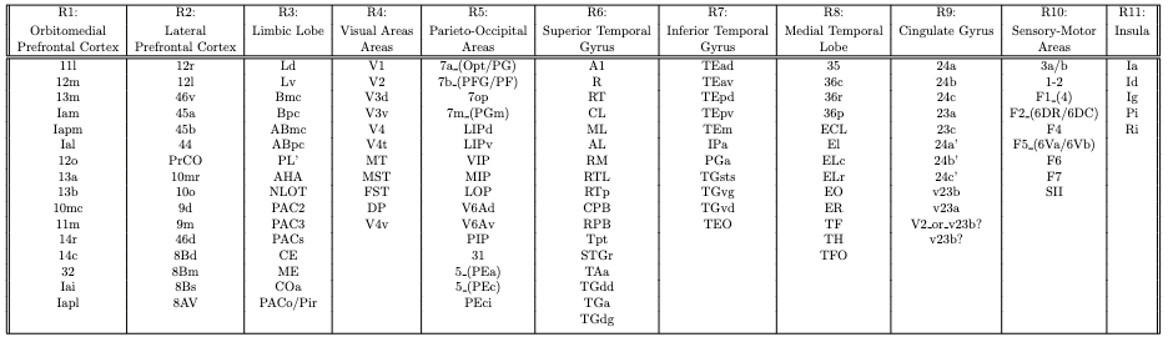
We scanned a perfusion-fixed macaque monkey brain using a MAP-MRI protocol with 200µm spatial resolution, TE/TR=50/650ms, and 112 DWIs with multiple b-values and orientations. After post-processing12 we estimated the MAP coefficients and computed the microstructural parameters: propagator anisotropy (PA), return-to-axis probability (RTAP), and non-gaussianity (NG). In the same session, we acquired magnetization transfer scans from which we segmented the GM/WM boundary with FSL-FAST13. After imaging, we sectioned the brain into 50µm-thick coronal slices which we processed with multiple histological stains, as described in14.Using the histologically defined D99 digital macaque brain atlas14,15, we derived the cortical topology by quantifying the spatial adjacency, or contiguity, of the D99 cortical labels (Fig. 1). We partitioned the D99 cortical labels into 11 major contiguous regions R1-11, in each hemisphere, that roughly correspond to parts of the major lobes (e.g., prefrontal, temporal, occipital, etc.) and are separated by distinctive anatomical landmarks like the major sulci and gyri that can be robustly delineated with atlas-registration-based parcellation (Table 1). Within each region R1-11, we performed k-means clustering of all voxels using the MAP-MRI parameters PA, RTAP, and NG, and the distance from the GM/WM boundary as features. To obtain the final cytoarchitectonic MAP-based segmentation, we processed the results with 3D morphological filters that remove and merge small, isolated clusters that may arise due to noise. We quantified the correspondence between the D99 (atlas-based) and MAP (cytoarchitectonic) segmentations within each region, compared their topologies, cross-tabulated their labels, and assessed their accuracy by comparing them with the corresponding histological images.
Results
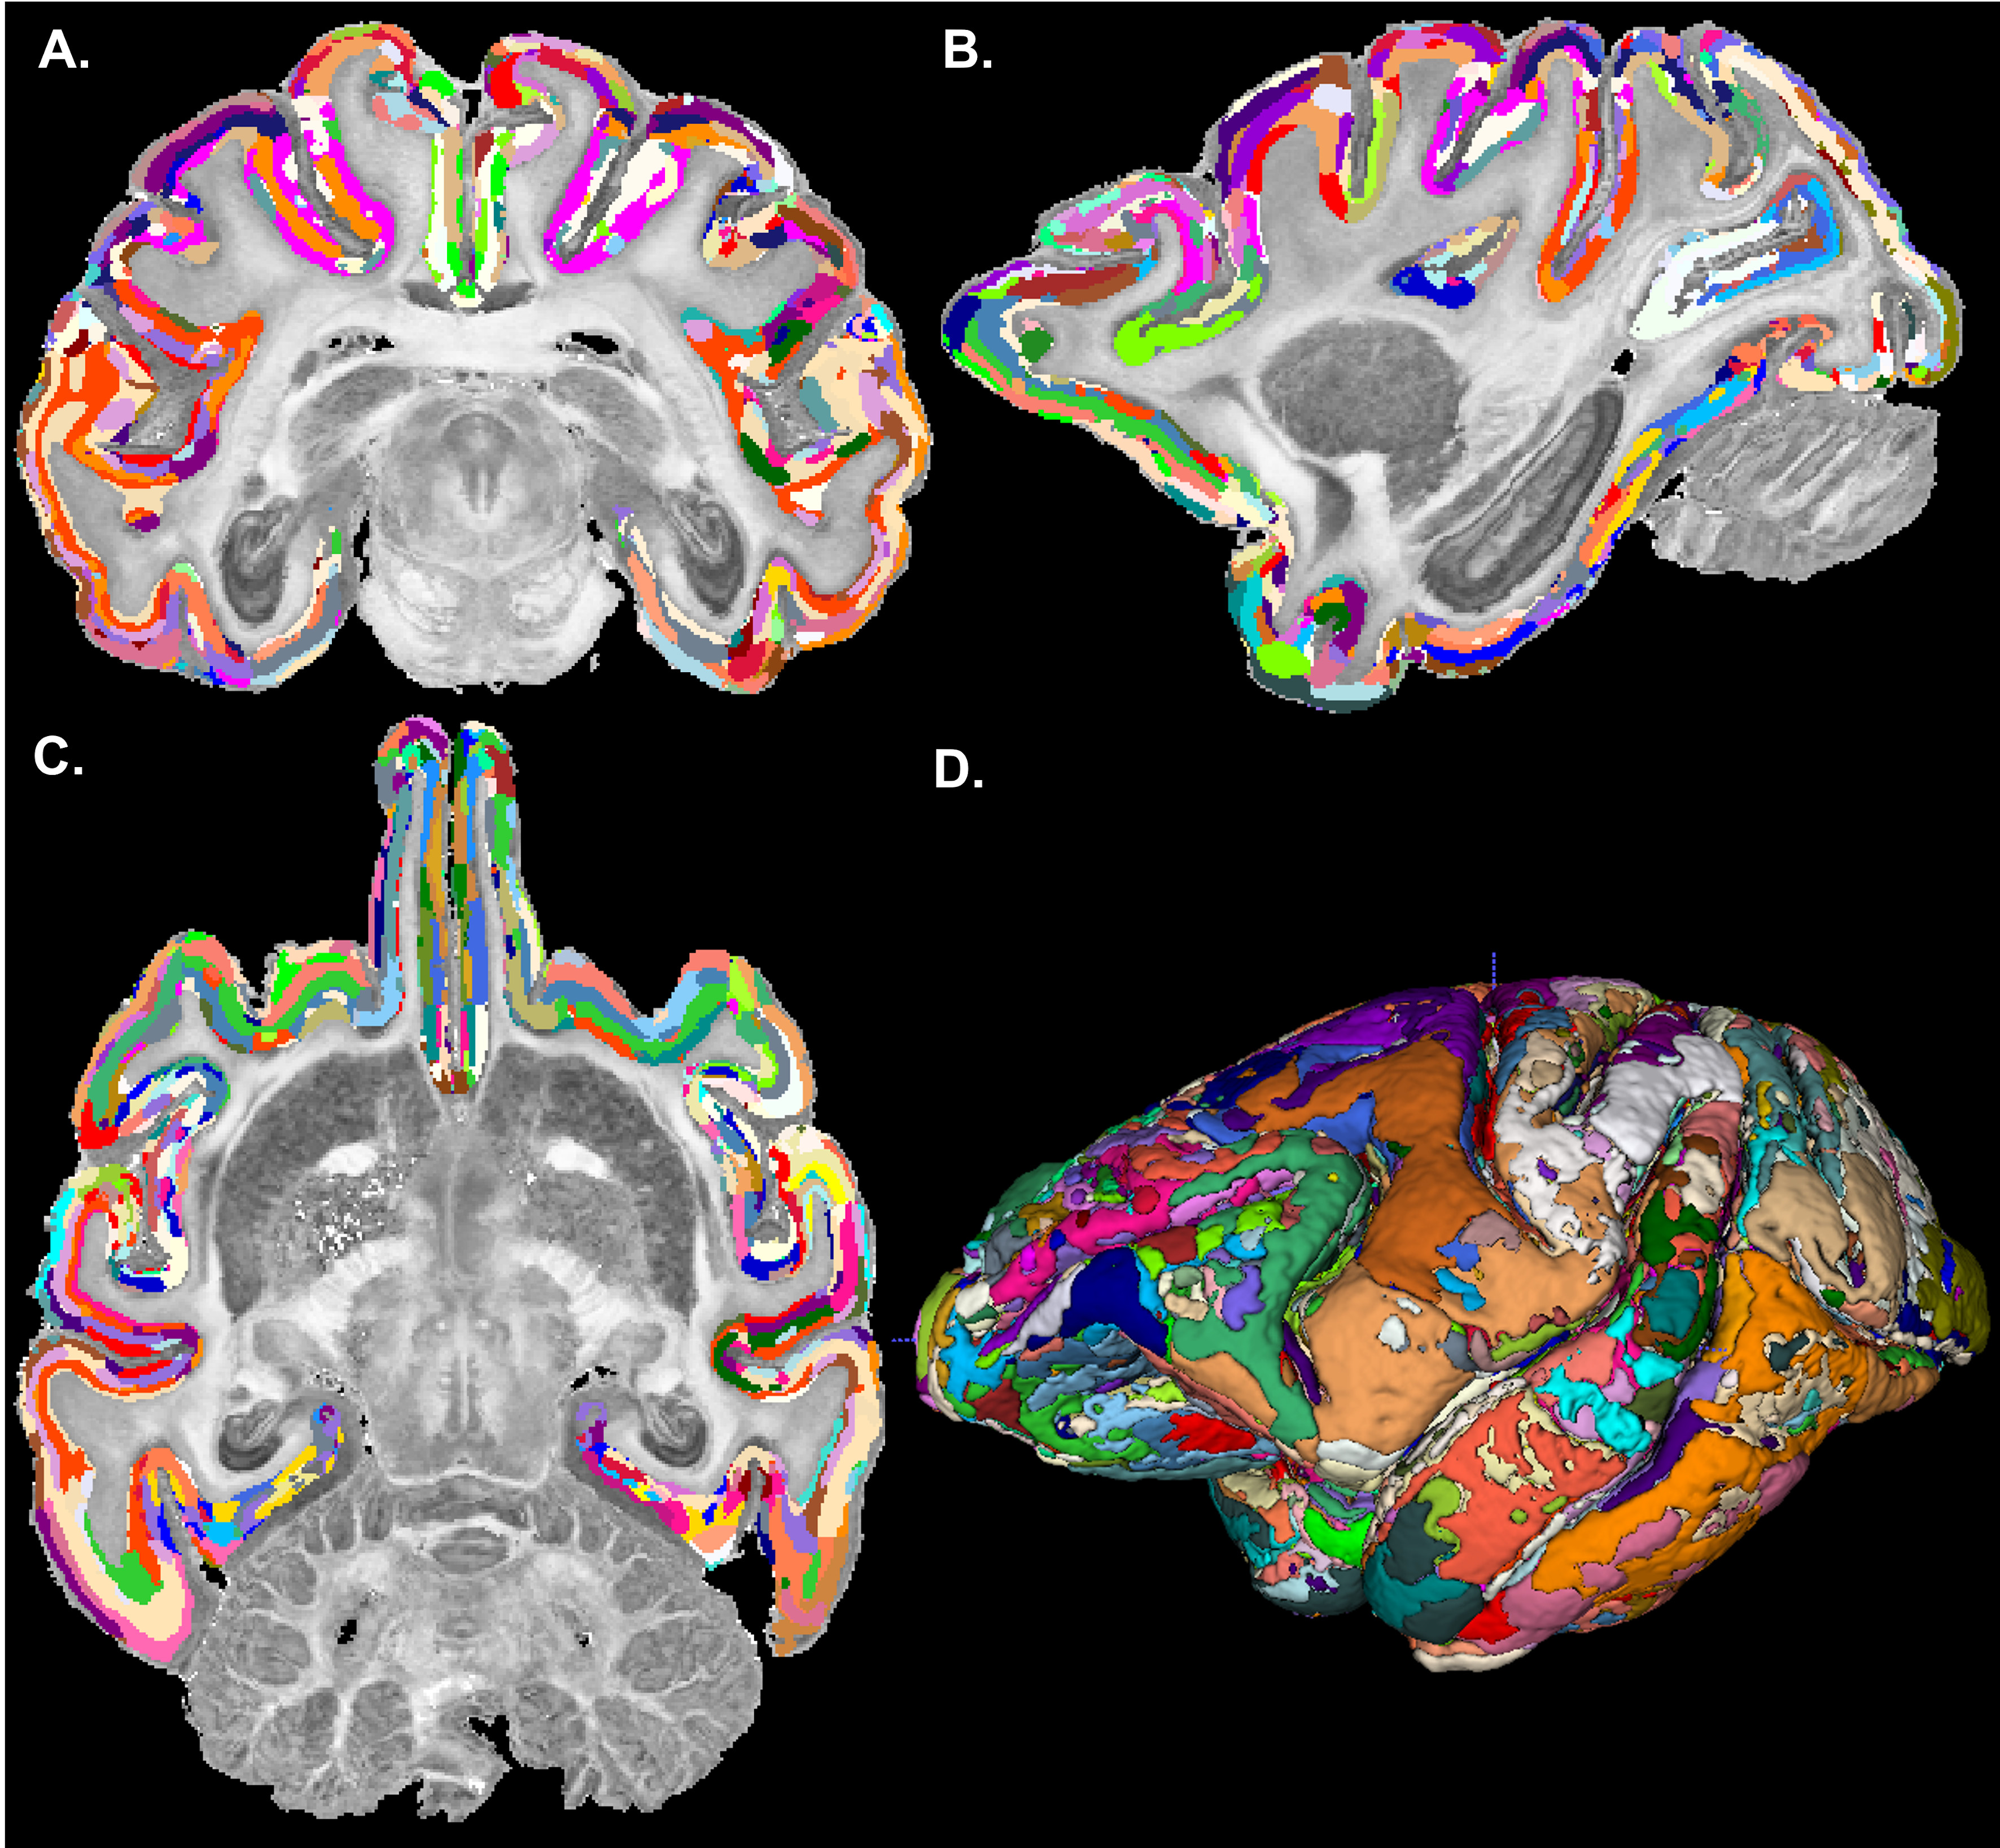
The graph in Fig. 1 shows the topological organization (spatial contiguity) of 157 histologically defined D99 cortical areas grouped into 11 major brain regions (Table 1), shown as color-coded subgraphs. The subgraphs computed separately in the left and right hemispheres were found to be consistent.The MAP-based cytoarchitectonic segmentation of the 3D cortex showed distinct laminar and areal boundaries with a high degree of symmetry between the left and right hemispheres (Fig. 2). Preliminary matching of the labels in the left and right hemispheres was done based on matching median values of MAP parameters computed in these labels.
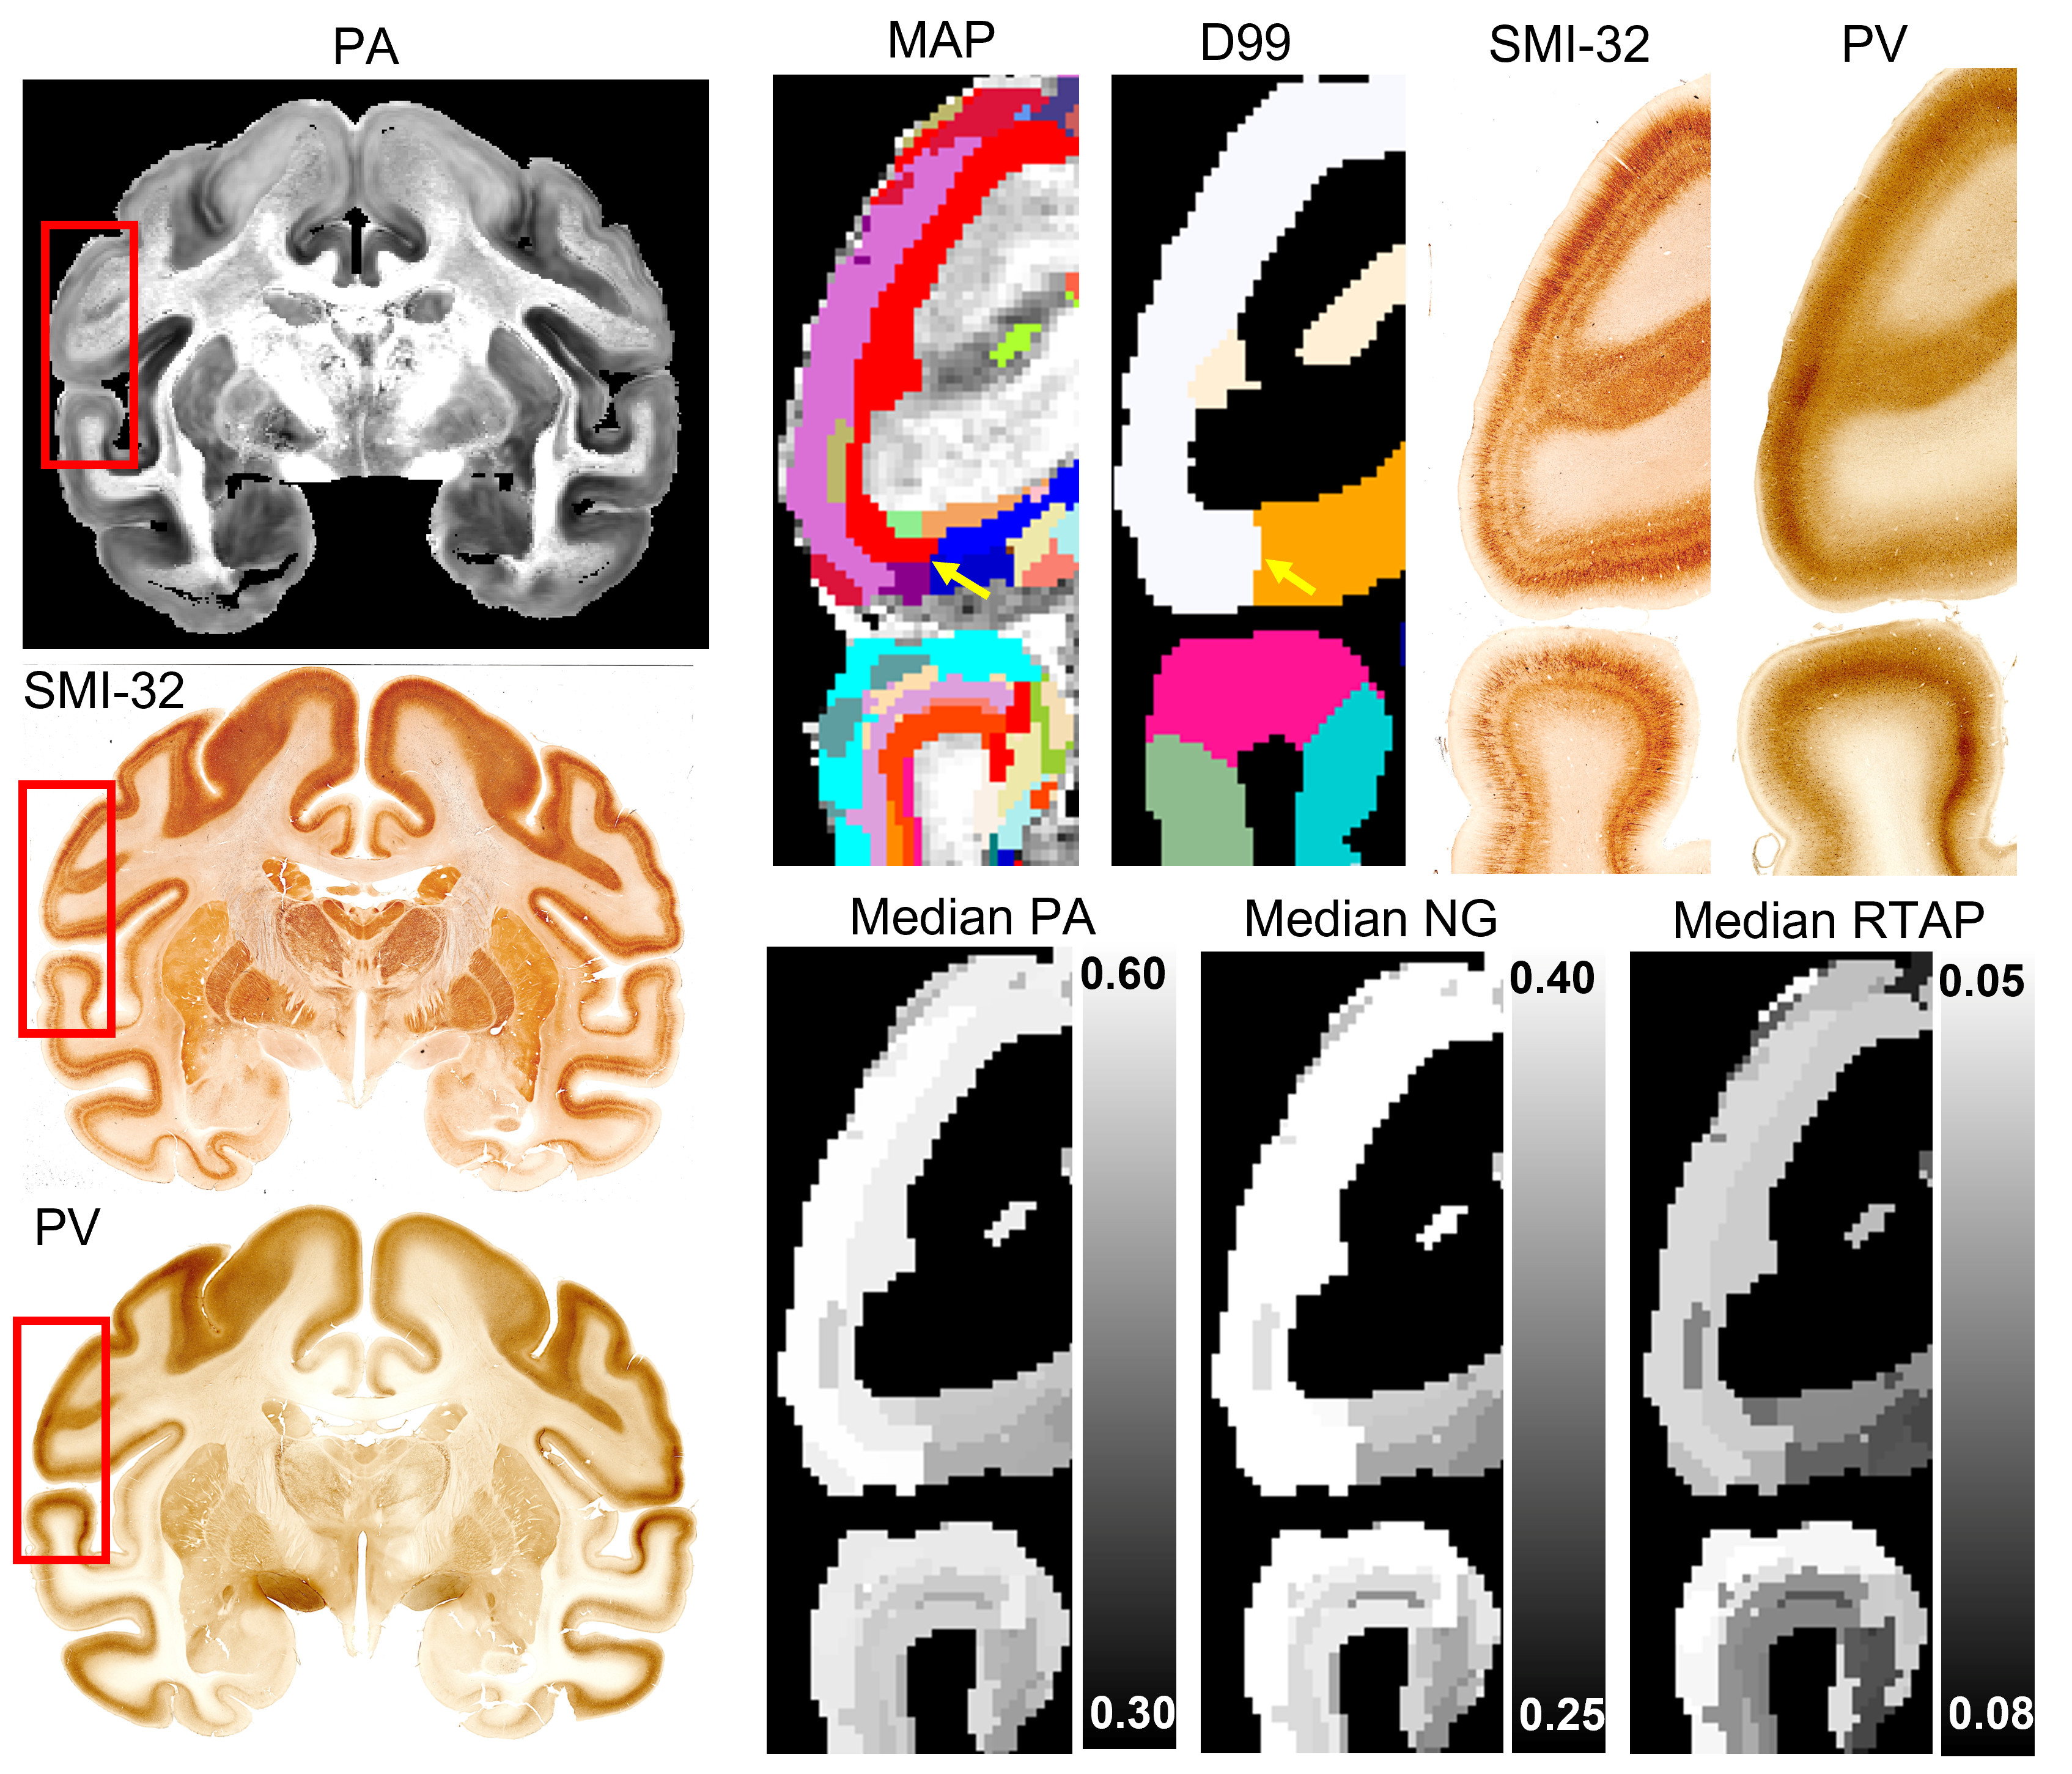
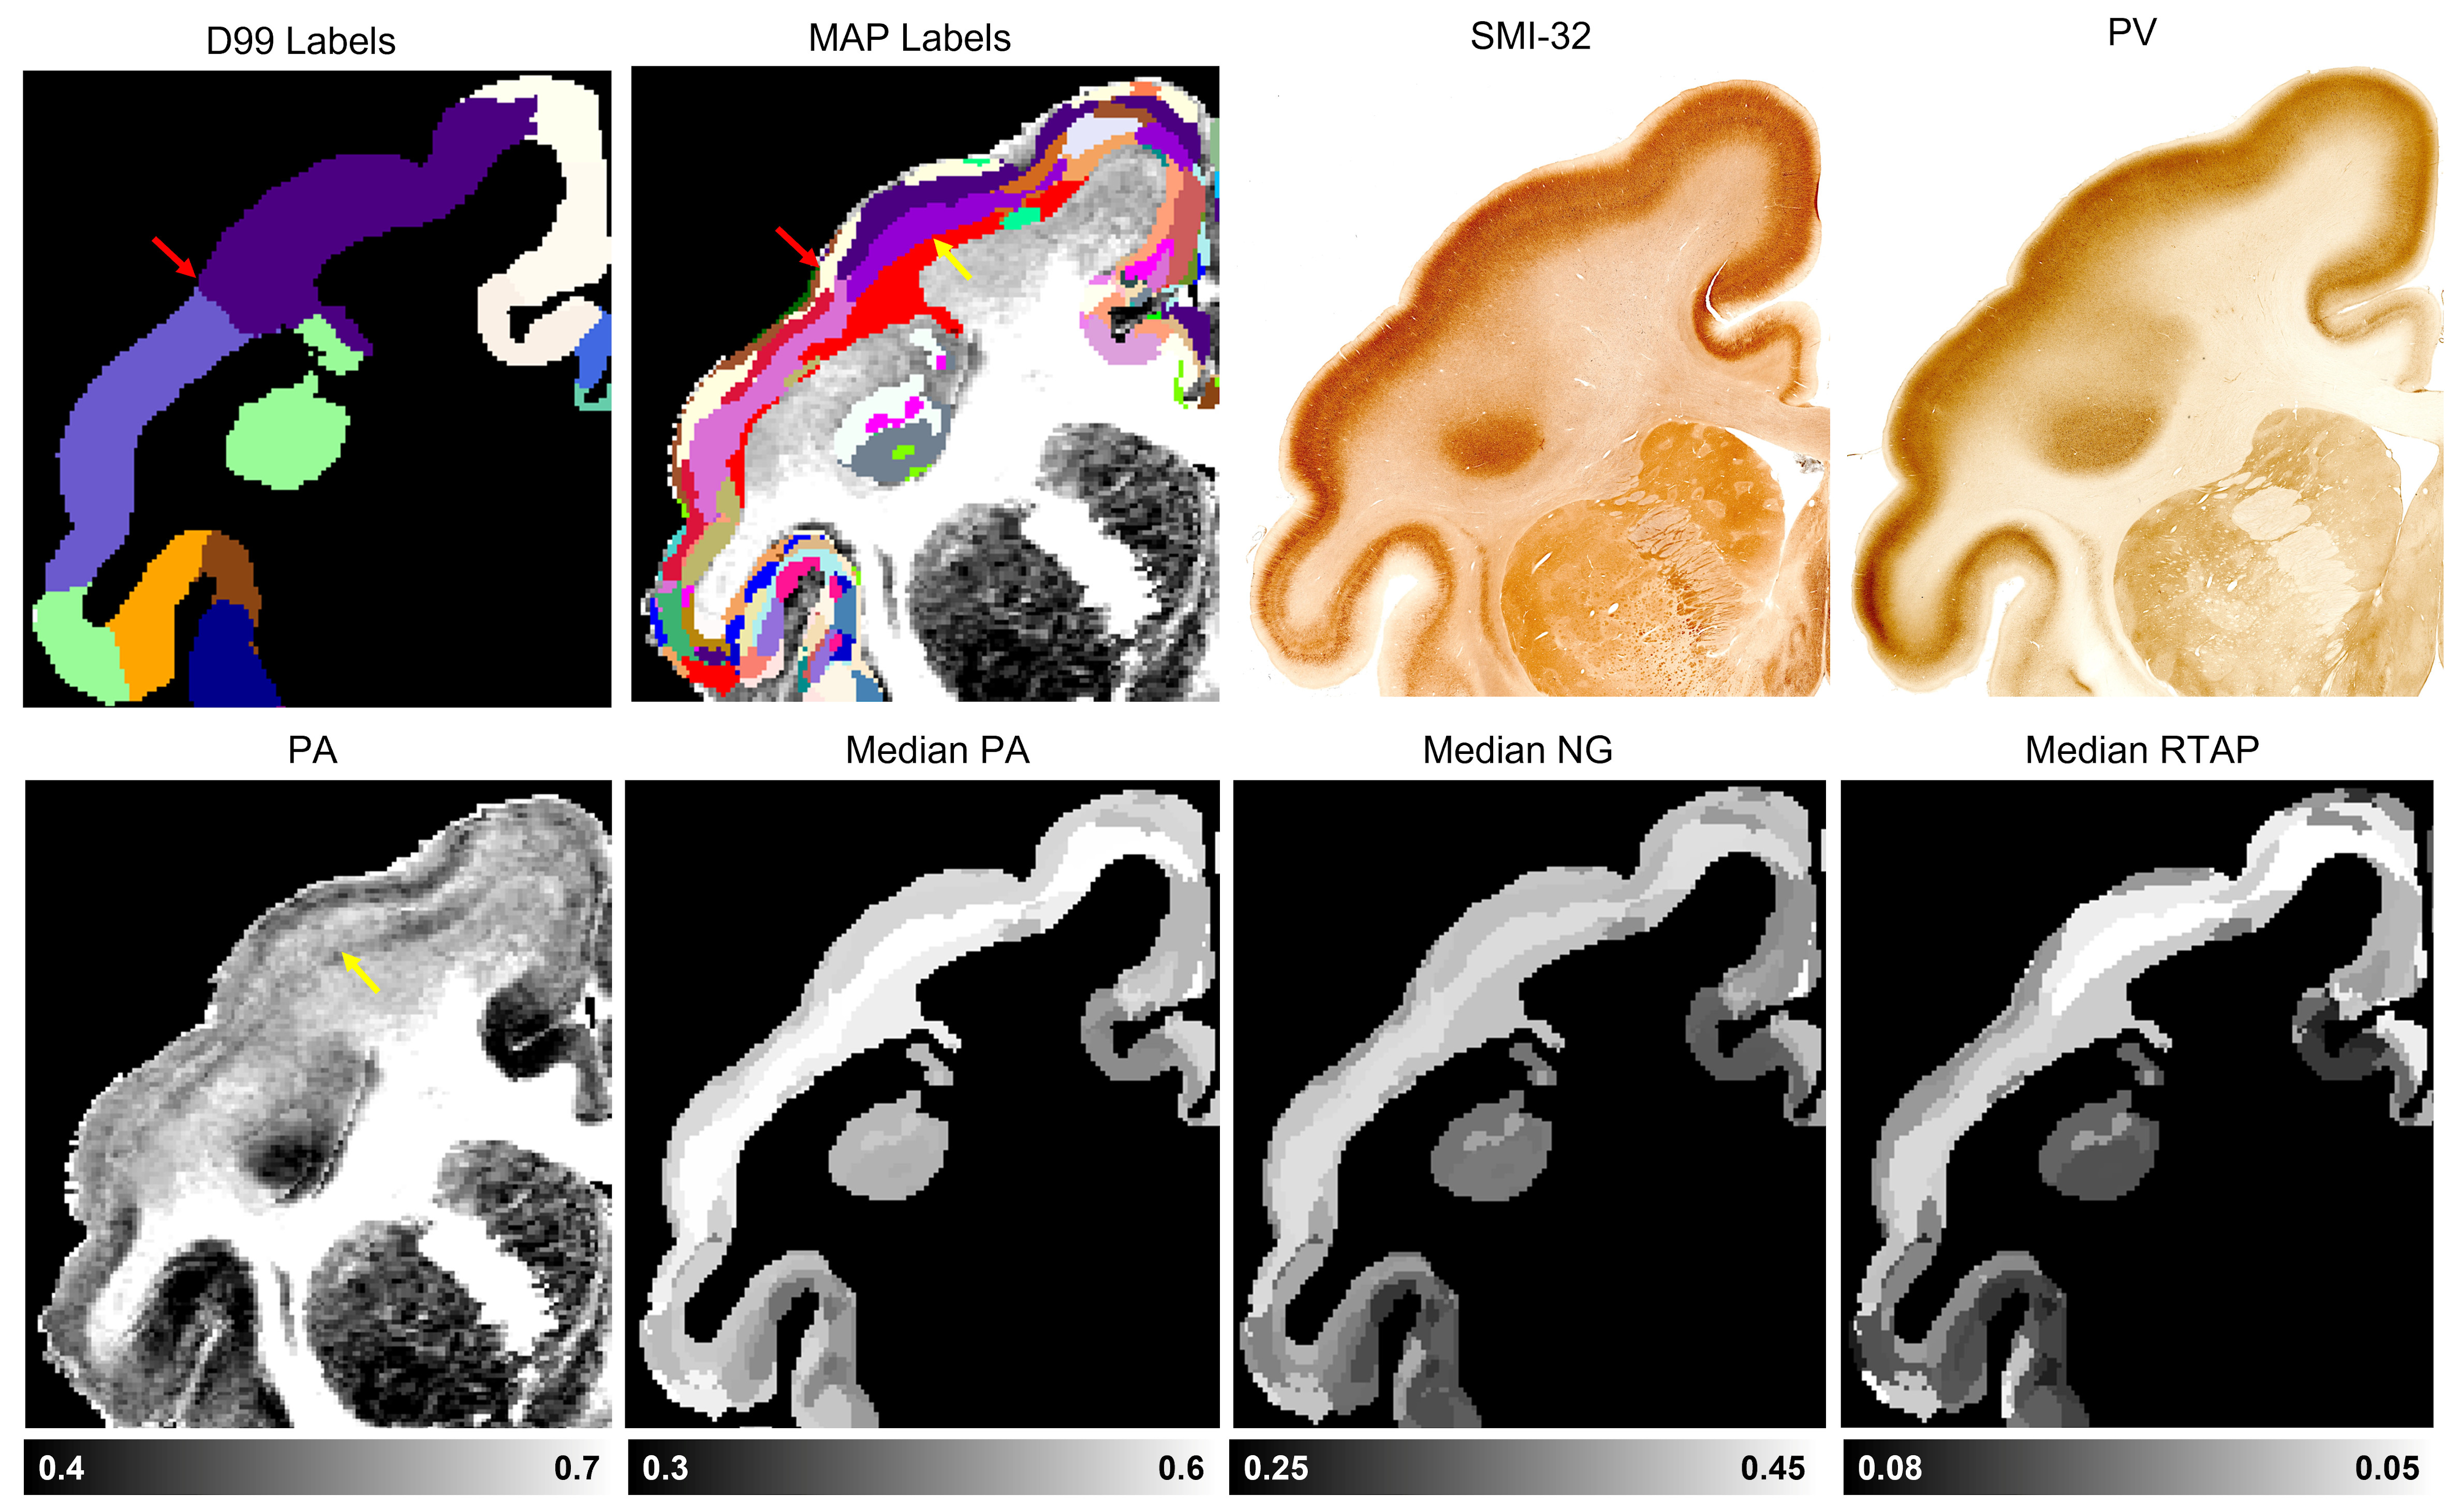
The MAP-based segmentation of cortical cytoarchitectonic domains shows laminar patterns within the cortex that are not present in the D99 atlas. Moreover, the discontinuities between these laminar patterns can be matched to the corresponding D99 cortical labels, although the boundaries estimated with the MAP-based algorithm are more consistent with the cytoarchitecture observed in the corresponding histological images (Fig. 3 and 4). Some MAP cytoarchitectonic domains correspond to different layers that extend across boundaries between cortical layers, while others terminate abruptly (Fig. 4, red arrows). The median MAP parameter values (PA, NG, RTAP) within each label quantify the coordinates of the k-means centroids and provide a rationale for delineating specific boundaries between MAP-derived cytoarchitectonic domains. Median values of PA, NG, and RTAP computed along the borders of the 11 major regions also showed high contrast.
Quantifying the cross-tabulation, i.e., the contingency matrix, between the MAP and D99 parcellations, we found that 90% of the volume of any D99 cortical label was covered by at most five distinct MAP labels, potentially reflecting the presence of a laminar pattern. Meanwhile, 99% of the volume of all 157 D99 cortical labels was completely covered using only 367 MAP labels.
Discussion and Conclusion
We produce a fine segmentation of cytoarchitectonic domains by leveraging the microstructural sensitivity of high-resolution MAP parameters and by focusing separately on 11 contiguous subregions per hemisphere which decreases the number of voxels without reducing the variance of the clustering features. Local k-means clustering of voxelwise MAP parameters can identify boundaries between cortical areas with improved accuracy compared to atlas-based registration. and can delineate laminar structures corresponding observed with histology. Clustering methods that leverage the microstructural sensitivity of MAP parameters could enable subject-specific parcellation into cortical areas and layers in most of the cortex. They could complement histological analyses, refine boundaries between cortical areas estimated with atlas-based cortical parcellation, and enable the construction of digital 3D cytoarchitectonic brain atlases for use in neuroscience and clinical research.Acknowledgements
This work was supported by the Intramural Research Program (IRP) of the Eunice Kennedy Shriver National Institute of Child Health and Human Development, the NIH BRAIN Initiative grant “Connectome 2.0: Developing the next generation human MRI scanner for bridging studies of the micro-, meso- and macro-connectome” (1U01EB026996-01), and the CNRM Neuroradiology-Neuropathology Correlation/Integration Core, 309698-4.01-65310, (CNRM-89-9921). This work utilized computational resources of the NIH HPC Biowulf cluster (http://hpc.nih.gov). The opinions expressed herein are those of the authors and not necessarily representative of those of the Uniformed Services University of the Health Sciences (USUHS), the Department of Defense (DoD), VA, NIH or any other US government agency, or the Henry M. Jackson Foundation.References
1 Fischl, B. FreeSurfer. NeuroImage 62, 774-781, doi:10.1016/j.neuroimage.2012.01.021 (2012).
2 Aggarwal, M., Nauen, D. W., Troncoso, J. C. & Mori, S. Probing region-specific microstructure of human cortical areas using high angular and spatial resolution diffusion MRI. NeuroImage 105, 198-207, doi:https://doi.org/10.1016/j.neuroimage.2014.10.053 (2015).
3 Kleinnijenhuis, M. et al. Layer-specific diffusion-weighted imaging in human primary visual cortex in vitro. Cortex 49, 2569-2582, doi:https://doi.org/10.1016/j.cortex.2012.11.015 (2013).
4 Assaf, Y. Imaging laminar structures in the gray matter with diffusion MRI. NeuroImage 197, 677-688, doi:https://doi.org/10.1016/j.neuroimage.2017.12.096 (2019).
5 Leuze, C. W. et al. Layer-specific intracortical connectivity revealed with diffusion MRI. Cereb Cortex 24, 328-339, doi:10.1093/cercor/bhs311 (2014).
6 McNab, J. A. et al. Surface-based analysis of diffusion orientation for identifying architectonic domains in the in vivo human cortex. NeuroImage 69, 87-100, doi:https://doi.org/10.1016/j.neuroimage.2012.11.065 (2013).
7 Ganepola, T. et al. Using diffusion MRI to discriminate areas of cortical grey matter. NeuroImage 182, 456-468, doi:https://doi.org/10.1016/j.neuroimage.2017.12.046 (2018).
8 Nagy, Z., Alexander, D. C., Thomas, D. L., Weiskopf, N. & Sereno, M. I. Using High Angular Resolution Diffusion Imaging Data to Discriminate Cortical Regions. PLOS ONE 8, e63842, doi:10.1371/journal.pone.0063842 (2013).
9 Özarslan, E. et al. Mean apparent propagator (MAP) MRI: A novel diffusion imaging method for mapping tissue microstructure. NeuroImage 78, 16-32, doi:10.1016/j.neuroimage.2013.04.016 (2013).
10 Avram, A. V. et al. Clinical feasibility of using mean apparent propagator (MAP) MRI to characterize brain tissue microstructure. NeuroImage 127, 422-434, doi:https://doi.org/10.1016/j.neuroimage.2015.11.027 (2016).
11 Avram, A. V. et al. High-resolution cortical MAP-MRI reveals areal borders and laminar substructures observed with histological staining. NeuroImage 264, 119653, doi:https://doi.org/10.1016/j.neuroimage.2022.119653 (2022).
12 Pierpaoli, C. et al. in 18th Scientific Meeting of the International Society for Magnetic Resonance in Medicine. 1597.
13 Zhang, Y., Brady, M. & Smith, S. Segmentation of brain MR images through a hidden Markov random field model and the expectation-maximization algorithm. IEEE transactions on medical imaging 20, 45-57 (2001).
14 Saleem, K. S. et al. High-resolution mapping and digital atlas of subcortical regions in the macaque monkey based on matched MAP-MRI and histology. NeuroImage 245, 118759, doi:https://doi.org/10.1016/j.neuroimage.2021.118759 (2021).
15 Reveley, C. et al. Three-dimensional digital template atlas of the macaque brain. Cerebral cortex 27, 4463-4477 (2017).
Figures