0960
Diattenuation and retardance metrics from complete polarimetry differentiate microscale and macroscale anisotropy1Biomedical Engineering, University of Arizona, Tucson, AZ, United States, 2Wyant College of Optical Sciences, University of Arizona, Tucson, AZ, United States
Synopsis
Keywords: Data Acquisition, Multimodal, Polarized Light Imaging, Optics, Ferret
This study uses complete polarimetry to capture diattenuation and retardance in post-mortem ferret optic chiasm (OC) chosen for its well understood fiber structure. These methods are novel due to the limited analysis of diattenuation metrics on tissue. Our results suggest that retardance measurements are sensitive to microscale features rather than to macroscale geometry when compared to fractional anisotropy (FA) and propagator anisotropy (PA). In addition, we have shown fiber orientation distributions (FODs) created through direct optical measurement of the tissue on a 2D plane are comparable to diffusion FODs.Introduction
Estimating within-voxel fiber dispersion is essential to improve tractography and fiber orientation distribution (FOD) algorithms from diffusion MRI (dMRI) and to validate microscale anisotropy metrics. Comparison of anisotropy and orientation estimates to direct ground truth values are necessary to improve the accuracy of these dMRI derived models1,2.One method used to obtain orientational features within tissue is polarized light imaging (PLI) which derives signal from the optical birefringence in brain tissue–primarily from the myelin sheath–that can exhibit structural anisotropy3. PLI is a useful tool for ground truth validation of tissue structure due to its stain-free contrast and direct quantitative measurements of angular features. Unfortunately, traditional PLI is limited to transmission imaging of thin tissue slices and only measures retardance, ignoring other relevant polarization metrics such as diattenuation or depolarization4. In this study we use complete polarimetry to capture diattenuation and retardance and compare features across dMRI metrics in a thick tissue specimen.
The objective of this study is to advance PLI methodology5 for the imaging of microscale orientational features in thick tissue specimens by using backscattering Mueller Matrix PLI in the optic chiasm (OC). The first aim is to determine PLI sensitivity to microstructural features by comparing retardance and diattenuation to fractional anisotropy (FA) and propagator anisotropy (PA). The next aim is to compare angular PLI metrics to tractography and fiber orientation distribution (FOD) glyphs. Ultimately, advancing these techniques will enable a more robust and widely applicable validation of diffusion MRI data.
Methods
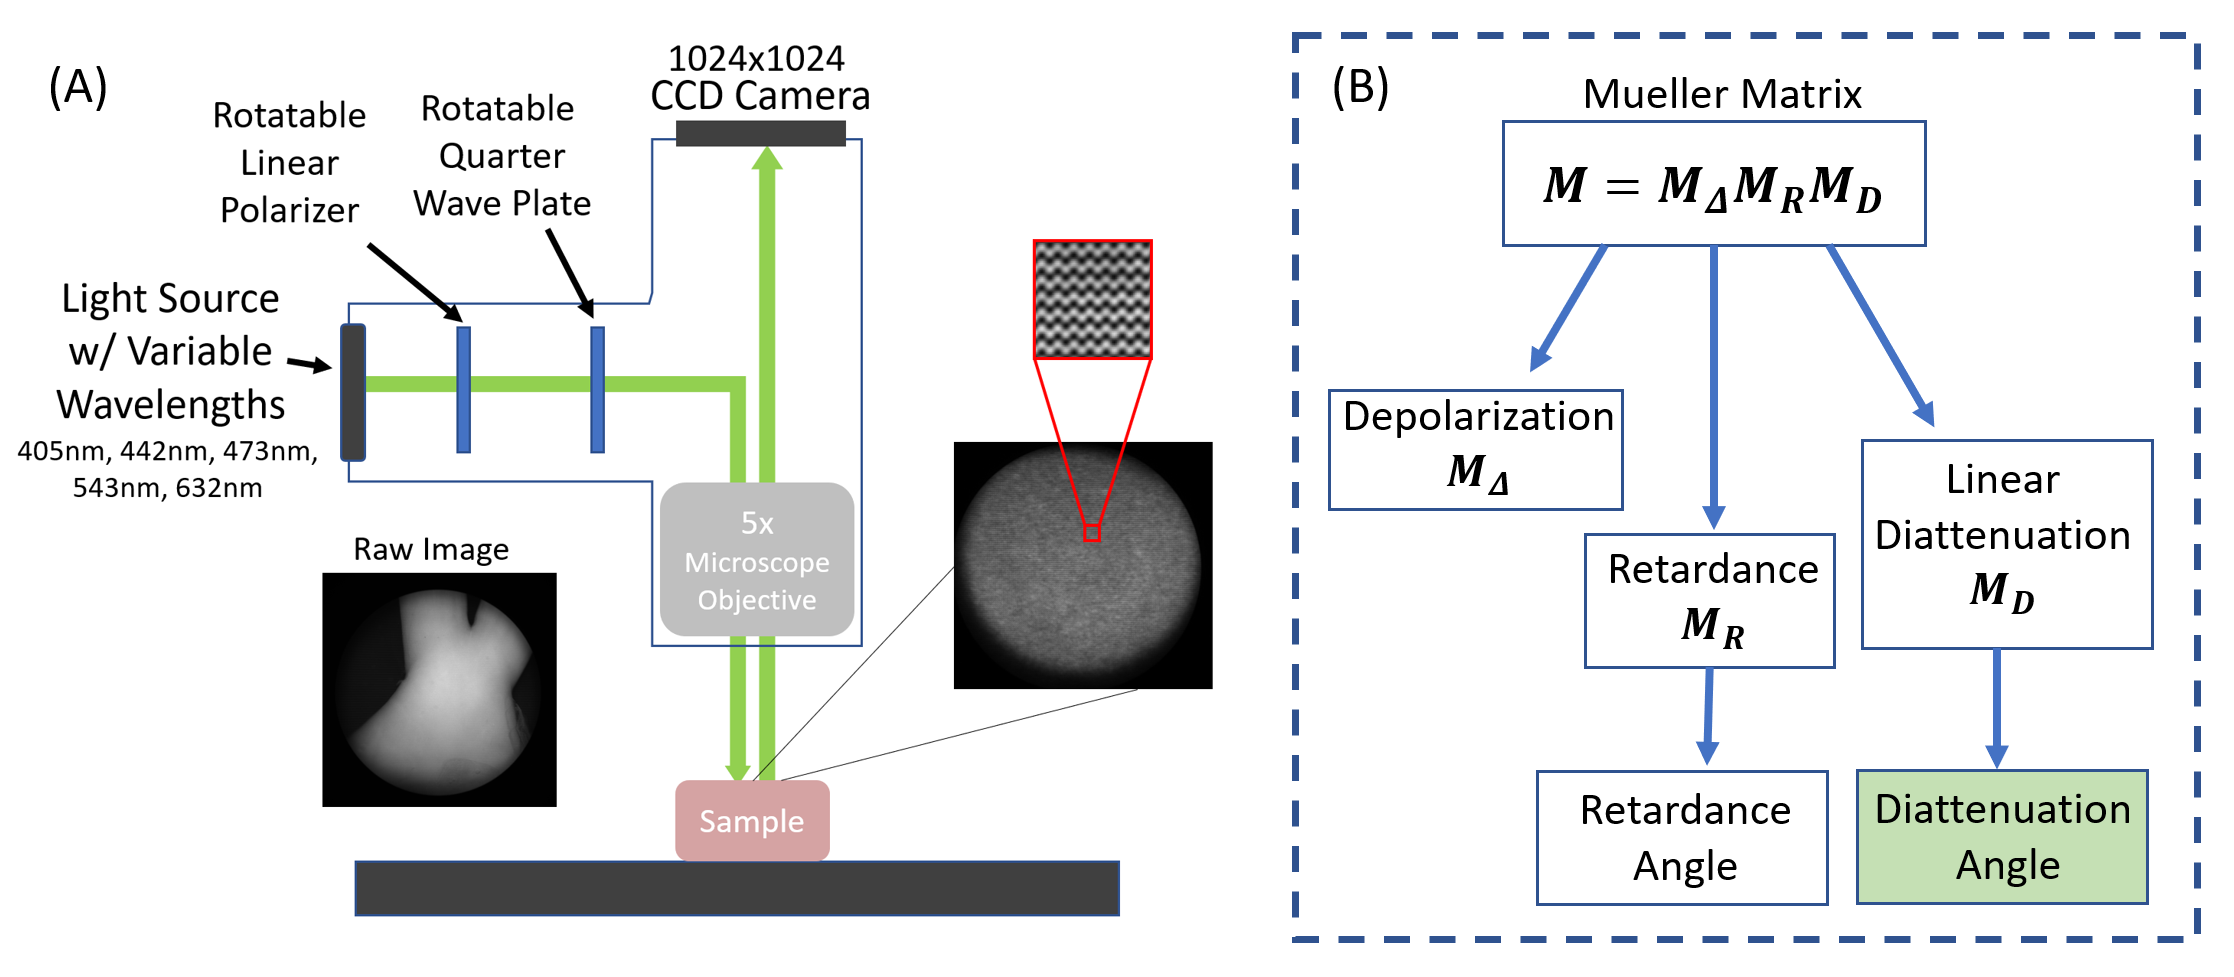
Perfusion-fixed and re-hydrated ferret brain specimens were imaged using a Bruker 7T MRI scanner to acquire 3D EPI volumes with 200-micron isotropic resolution and a high angular resolution diffusion imaging (HARDI) encoding scheme with b=10,000 s/mm2 and 87 non-colinear directions and an unweighted volume. MRtrix3 software6,7 was used to perform constrained spherical deconvolution (order=6) and whole brain white matter tractography. Fiber orientation distributions (FODs) and tractograms were visualized in regions corresponding to PLI analysis. TORTOISE software8 was used to estimate the diffusion tensor and mean apparent propagator and to calculate metrics for FA and PA.After MR imaging, the optic chiasm (OC) was removed from the brain and was measured using a Nikon BX41 Mueller Matrix Polarimeter9.The instrument operates in reflectance mode and illuminates the sample sequentially with five visible wavelengths (405nm, 445nm, 473nm, 543nm, 632nm) using a fiber-coupled multi-LED light source (Figure 1). Images were collected using a 5x microscope objective. The polarization state of the illumination arms are automatically cycled during acquisition to capture the full polarization interaction of the sample. The acquired data is a spatial mapping of the sixteen Mueller Matrix parameters for the sample.
The Mueller Matrix for each pixel was decomposed using the Lu-Chipman Decomposition technique (Figure 1) to isolate effects of diattenuation and retardance using the pySCATMECH package in Python 3.
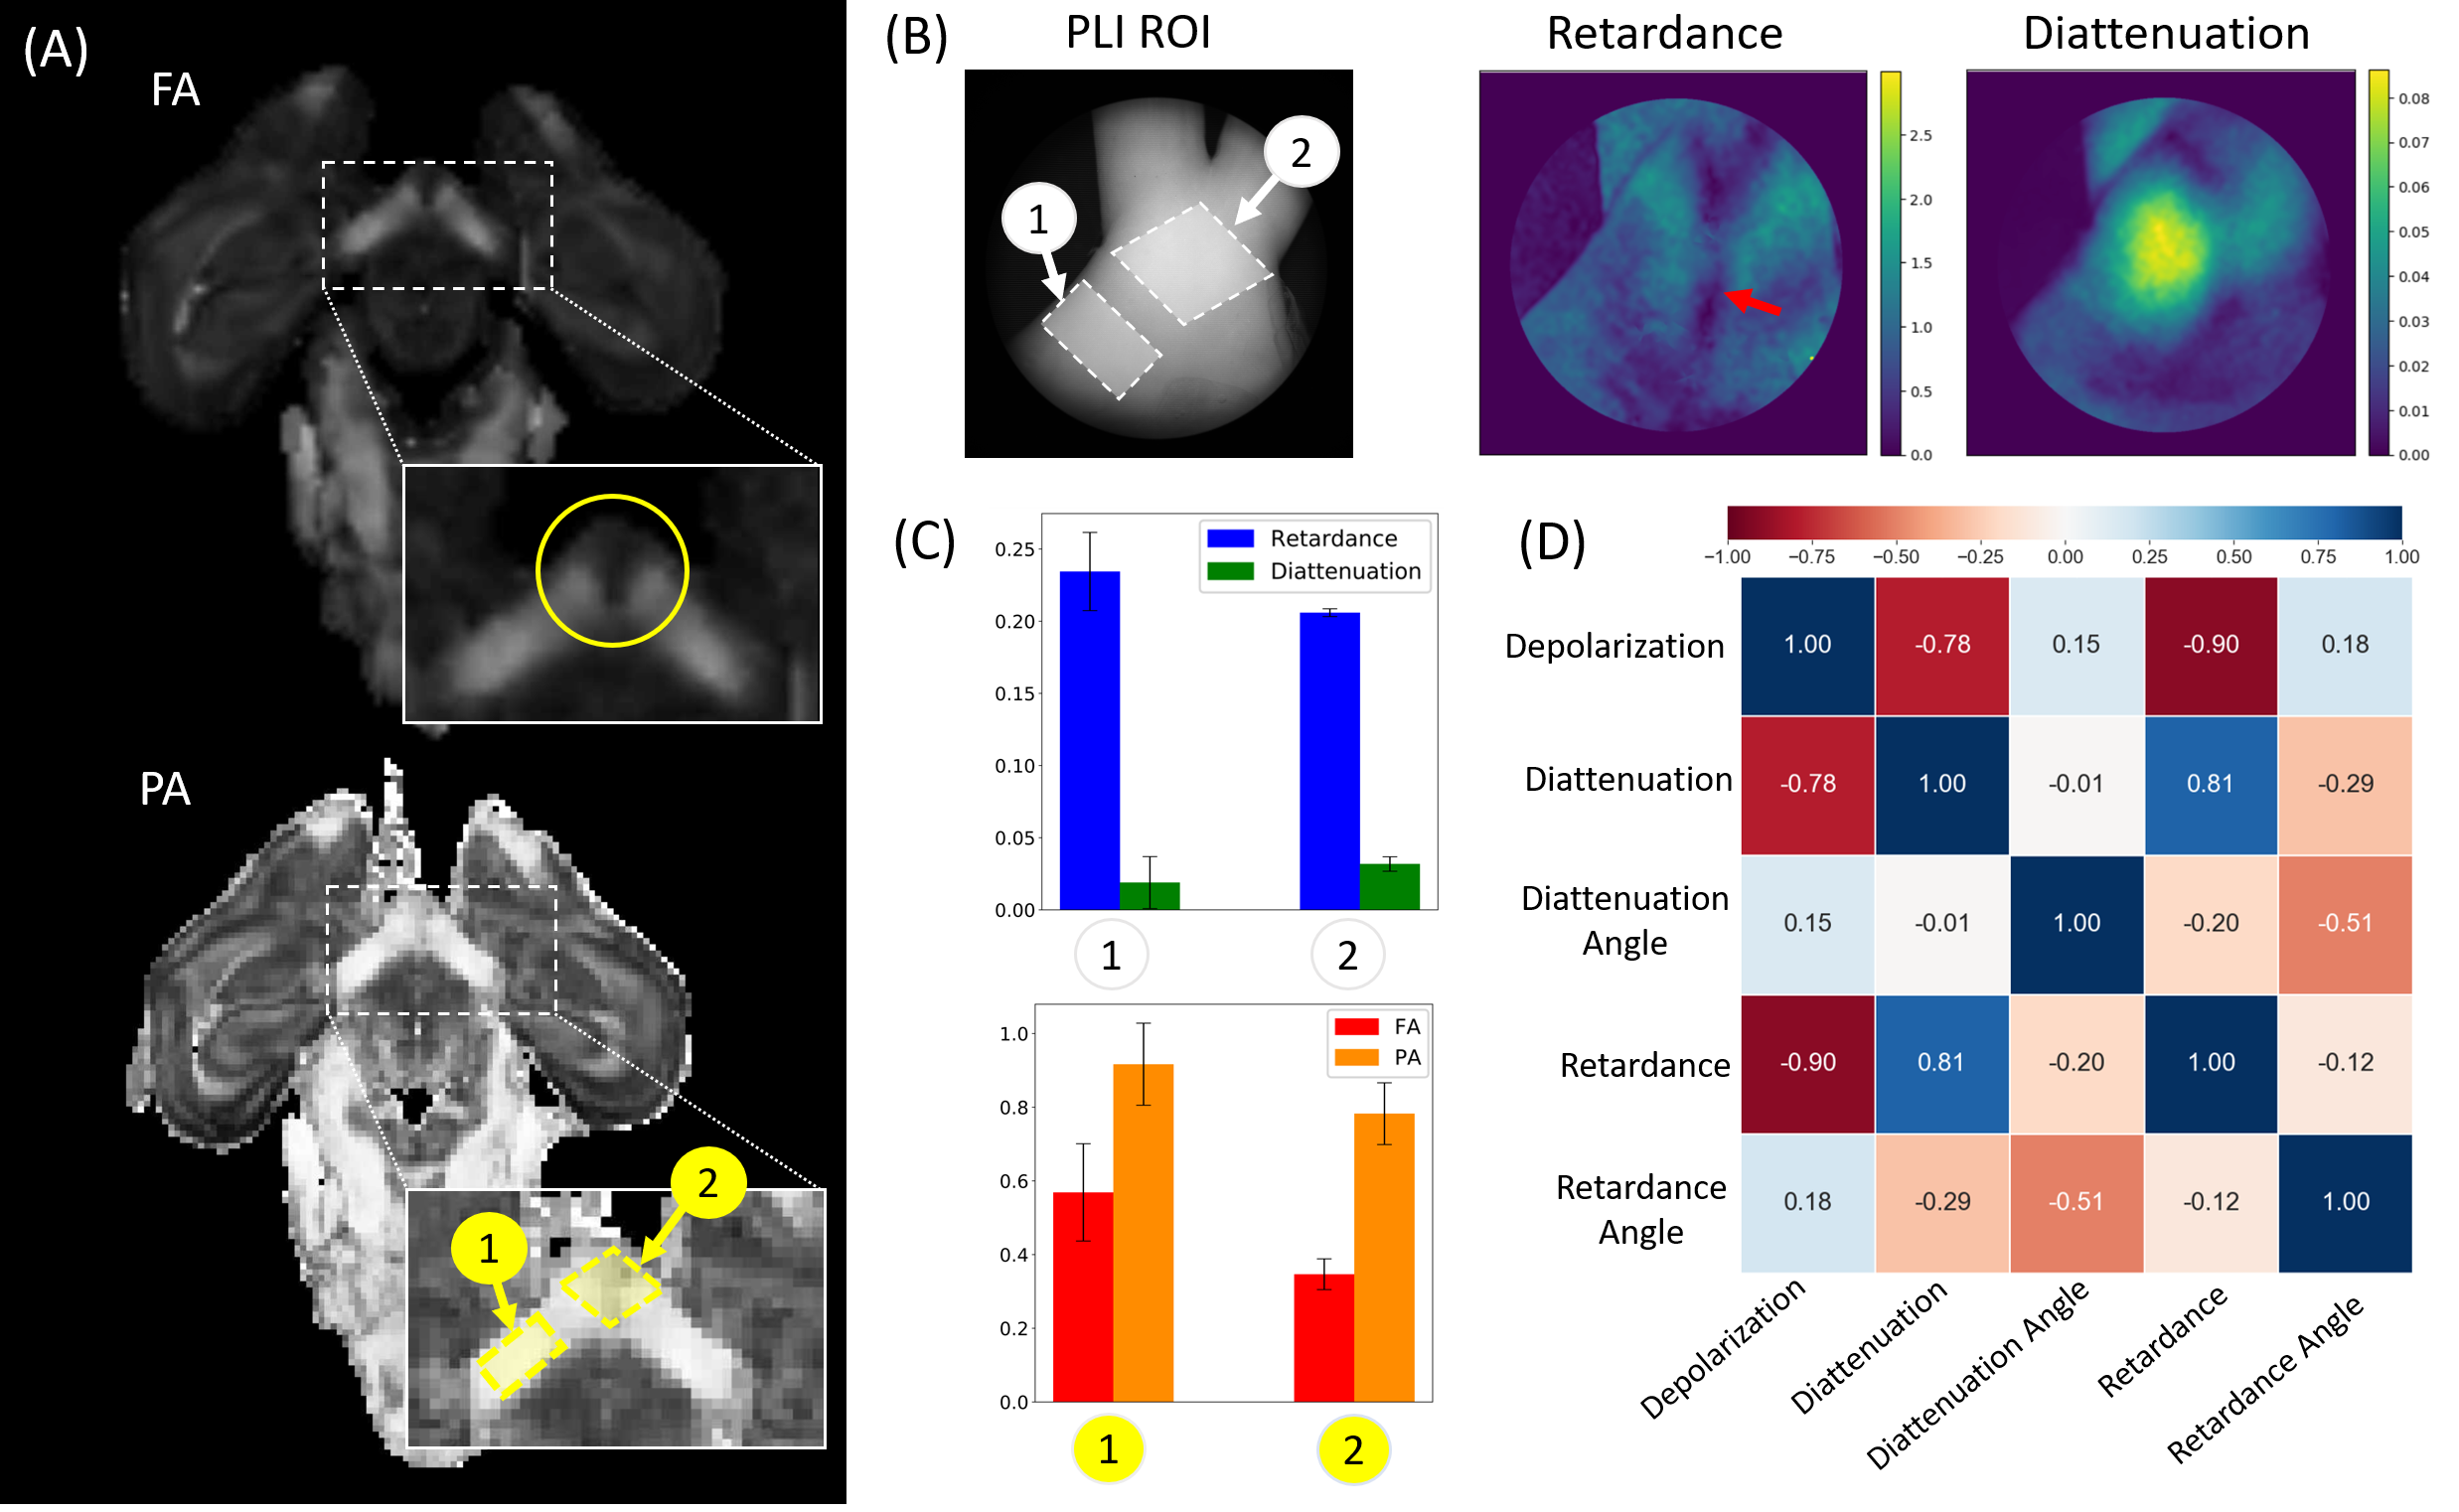
Masks were manually drawn in one coherent fiber region and one crossing fiber region for a single OC specimen. The two regions of interest (ROIs) from diffusion images FA and PA were compared to five PLI images of the same tissue, each having two ROIs. Pixel-wise PLI correlation was performed on the full image using Pearson correlation across the different metrics.
Results
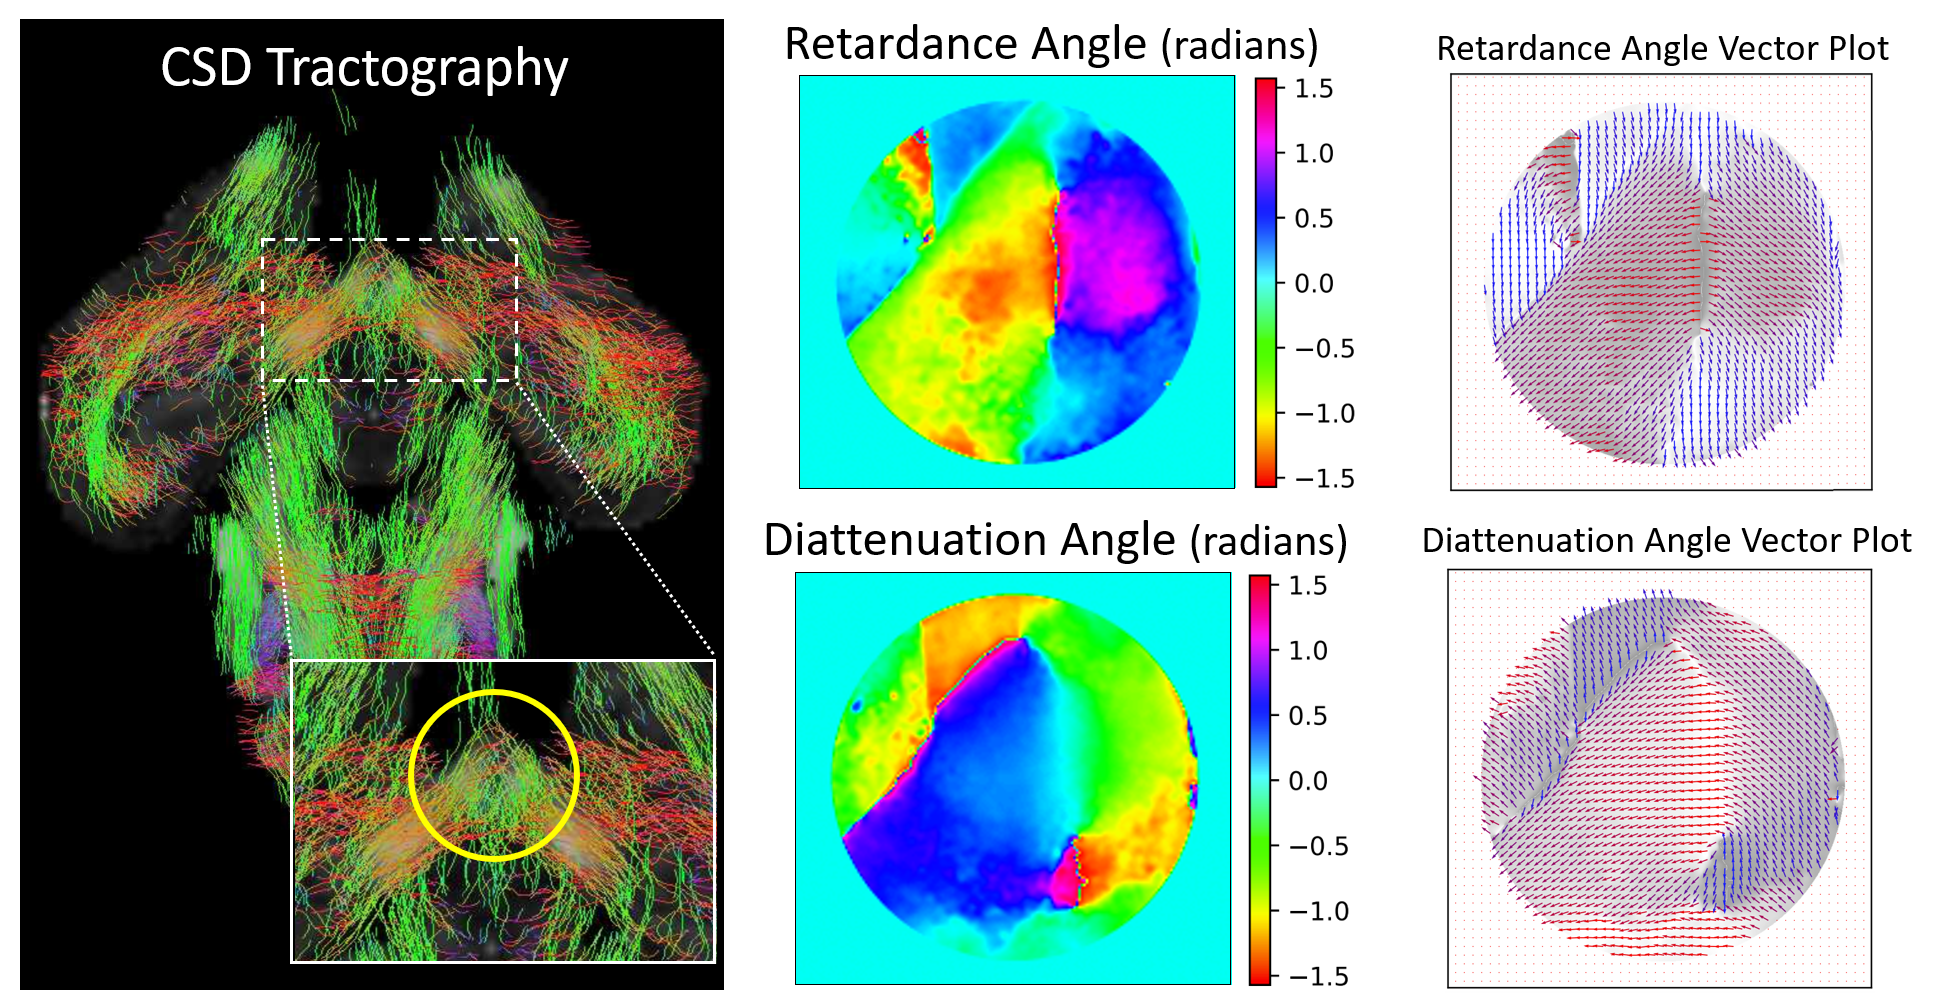
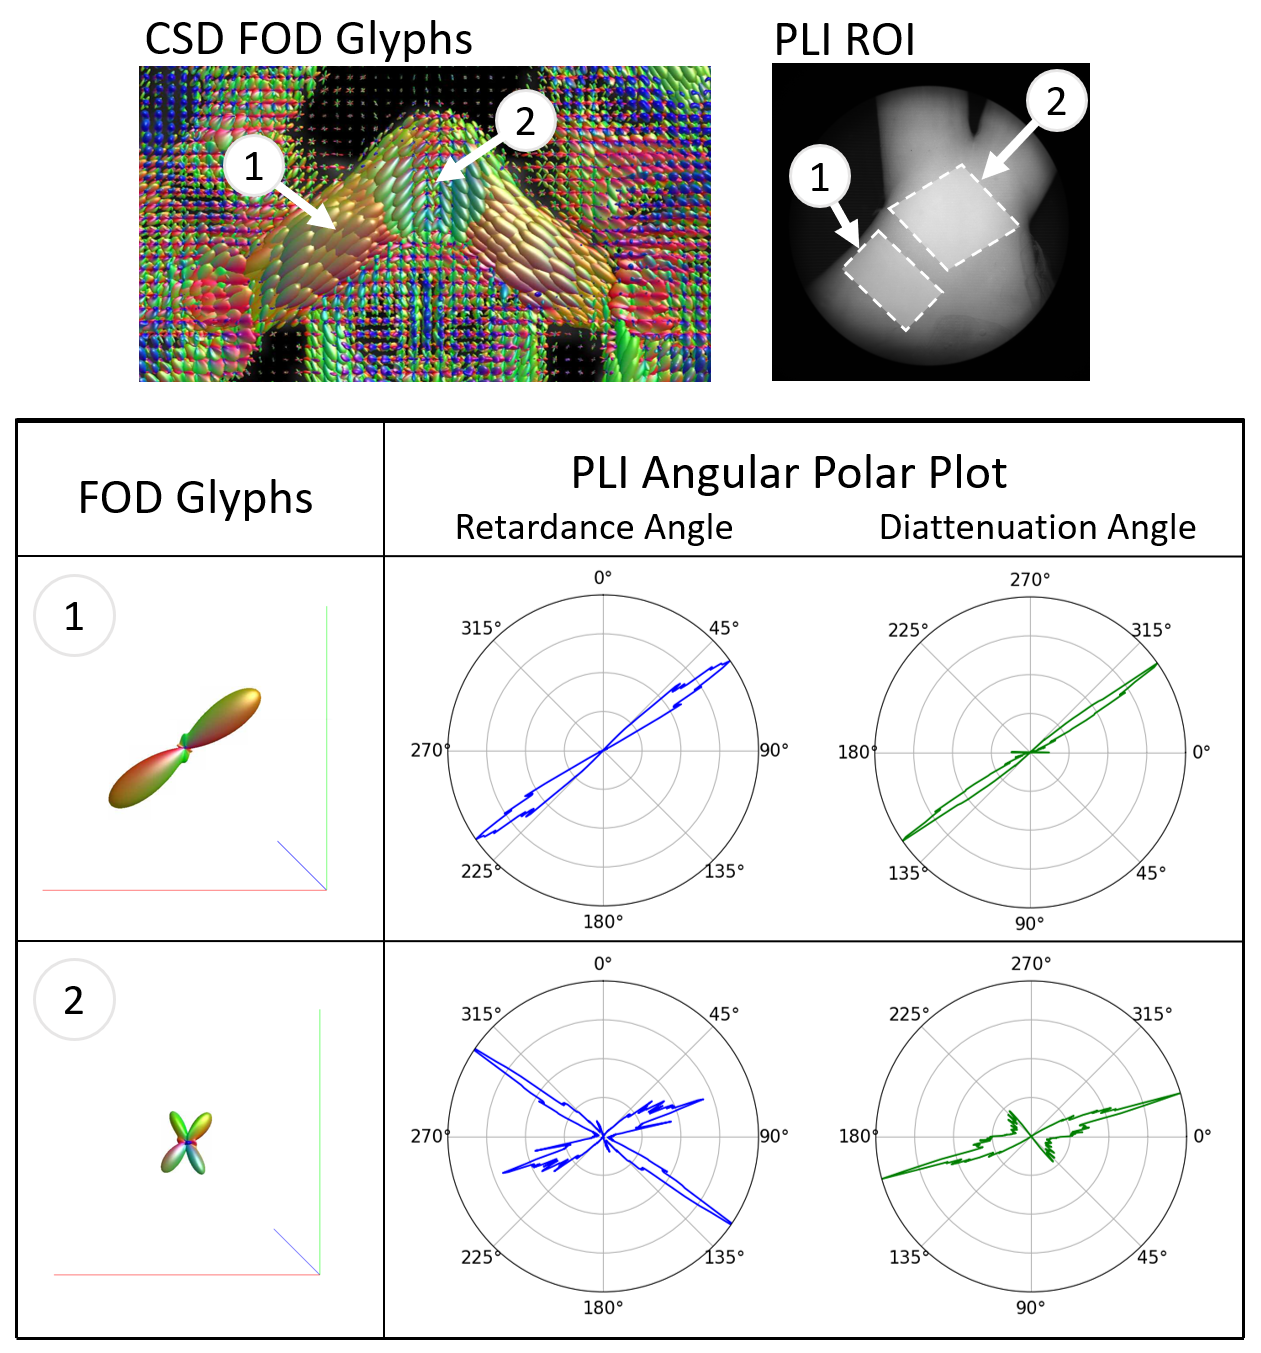
A comparison of retardance and diattenuation metrics obtained with a 632nm light source to dMRI metrics FA, PA, tractography and FOD glyphs are shown in Figures 2-4. Due to the lack of wide-spread signal loss in the area of crossing fibers for retardance, noted by the red arrow (Figure 2), retardance appears sensitive to microstructural features rather than macroscopic geometry in this area. The bright spot in diattenuation caused by noise makes it more difficult to visually determine its microstructural sensitivity. When comparing orientational features across the OC (Figure 3), we observe concordance across the tractogram, retardance angle, diattenuation angle, and both vector plots. Diffusion FODs appear visually similar to polar plots derived from retardance and diattenuation angle (Figure 4). In the coherent fiber region, diattenuation angle has a smaller angular spread when compared retardance angle. In the crossing fiber region, diattenuation angle appears less sensitive to fiber orientation, failing to capture the two fiber directions with equal intensity.Discussion
We have demonstrated that complete polarimetry is a promising tool for dMRI validation. We observe that diattenuation and retardance are distinct metrics that capture orientational information from the tissue specimen that is in concordance with known brain physiology within the OC. We have shown that correlation exists between PLI metrics retardance and diattenuation and dMRI metrics FA and PA. In addition, retardance and diattenuation show promising sensitivity to micro and macro architecture that inform its ability to represent FODs.Conclusion
These results suggest that backscattering Mueller Matrix PLI shows promise as a validation tool for dMRI orientational features in thick tissue specimens. Advancing the techniques proposed in this study have potential to enable a more robust and widely applicable validation of diffusion MRI data. Future directions include investigating the limitations of polar plots as a recreation of FODs in more complex structures, migrating this technique for in-vivo validation, and determining the influence of wavelength on the sensitivity of PLI values to different structures and tissue depth.Acknowledgements
All MRI was performed in the UA translational bioimaging resource (TBIR) and made possible by the NIH small instrumentation grant: S10 OD025016. All image processing was performed using the UA High Performance Computing (HPC) resources. We thank Nikon Research Corporation of American for use of the polarimeter system and processing software, Saito Naooki for technical guidance, as well as Faith Rice and Jennifer Barton for laboratory assistance and instrument maintenance.References
1. Mollink J, Kleinnijenhuis M, van Cappellen A, et al. Evaluating fibre orientation dispersion in white matter: Comparison of diffusion MRI, histology and polarized light imaging. NeuroImage. 2017; 157: 561-574.
2. Maier-Hein K, Neher P, Houde J, et al. The challenge of mapping the human connectome based on diffusion tractography. Nature Communications. 2017; 8: 1349.
3.
Jain A, Ulrich L, Jaeger M, et al. Backscattering
polarimetric imaging of the human brain to determine the orientation and degree
of alignment of nerve fiber bundles. Biomed Opt Express. 2021; 12(7): 4452-4466.
4. Larsen L, Griffin L, Greäβel D, et al. Polarized
Light Imaging of White Matter Architecture. Microscopy Research and Technique. 2007;
70:851–863.
5.
Bonaventura, Justina, et al. "Backscattering
Mueller Matrix polarimetry on whole brain specimens shows promise for minimally
invasive mapping of microstructural orientation features." bioRxiv (2022).
6. Tournier J, Calamante F, Connelly A. MRtrix: diffusion tractography in
crossing fiber regions. Int J Imaging Syst Technol. 2012;22(1):53–66.
7. Tournier JD, Smith R, Raffelt D, et al. MRtrix3: A fast, flexible and open software framework for medical image processing and visualisation [Internet]. Vol. 202, NeuroImage. Academic Press Inc. 2019.
8. Irfanoglu, M. O., A. Nayak, J. Jenkins and C. Pierpaoli (2017). TORTOISE v3: Improvements and New Features of the NIH Di. 25th Annual Meeting of the International Society fro Magnetic Resonance in Medicine, Honolulu, HI.
9. Saito N, Sato K, Fujii T, et al. Multispectral Mueller matrix imaging dark-field microscope for biological sample observation. Proc.SPIE. 2019; 10890:108901A.
Figures