0957
Variation in 8 years Cartilage Loss Trajectories Based on Baseline Pain and Deep Learning-Assessed ROAMES Morphological Phenotypes
Madeline Hess1, Sharmila Majumdar1, and Valentina Pedoia1
1University of California San Francisco, San Francisco, CA, United States
1University of California San Francisco, San Francisco, CA, United States
Synopsis
Keywords: Osteoarthritis, Osteoarthritis
We find that the presence or absence of ROAMES morphological phenotypes as predicted from MRI is a useful indicator of osteoarthiris progression over 8 years as measured by cartilage thinning.Introduction
It has been previously demonstrated that Rapid Osteoarthritis MRI Eligibility Scores (ROAMES) can be successfully employed to differentiate knees into structural categories based on morphological phenotypes which indicate different trajectories of osteoarthritis (OA) progression. Differences in change in cartilage thickness and t2 relaxation times over 4 years has been previously demonstrated to vary in trajectory based on the presence or absence of each ROAMES morphological phenotype on the Osteoarthritis Initiative (OAI) cohort. We seek to expand this analysis to the 8-year timeframe of the OAI study, model linear differences in trends between knees with and without each ROAMES morphological phenotype and consider nonlinear dynamics in change in cartilage thickness using velocity and acceleration.Methods
In this analysis, we model changes in cartilage thickness over 8 years for 41848 knees using the OAI longitudinal open-source dataset by regressing cartilage thickness on each ROAMES phenotype1,2. We aggregated ROAMES phenotypes for each subject knee at the baseline timepoint using a deep learning model trained for a previous study3. We also leveraged results from another previous study4 on deep learning-based cartilage segmentation from dual-echo steady state MRI volumes to collect mean knee cartilage thickness measurements at each timepoint (0, 12, 24, 36, 48, 72, and 96 months) for each of the following compartments: patella (P), lateral tibial (LT), lateral femoral (LF), medial femoral (MF), and medial tibial (MT). In addition to each phenotype, we consider pain presence or absence as measured by a Western Ontario and McMaster Universities Osteoarthritis (WOMAC) score of greater than or equal to 5 at baseline to be an explanatory variable of cartilage degeneration, consistent with the findings of Lee et al. (2019)5.We perform three Ordinary Least Squares regressions to model change in cartilage thickness over time. First, we regress cartilage thickness on phenotype presence for the inflammatory, bone, meniscus, and hypertrophy phenotypes, as well as pain presence. We control for age, gender, and Body Mass Index (BMI). We next fit a second-degree polynomial to cartilage thickness over each of the timepoints to extract velocity and acceleration of change and then perform the same regression using these metrics as our outcome of interest. We take our threshold of statistical significance to be alpha=0.05 to account for multiple hypothesis testing across cartilage compartments.
Results
Results are summarized in Tables 1, 2, and 3. Figures 1 and 2 are useful for visualizing differences in trends of average cartilage thickness over time between pain/no pain groups and phenotype/no phenotype groups.We find statistically significant explanatory power for the pain indicator, each of the phenotype indicator variables, and each of the controls for each compartment when we consider cartilage thickness the outcome variable of interest. We find mixed statistically significant results for the explanatory power of the inflammatory, hypertrophy and pain indicators in some compartments when we consider acceleration of cartilage thinning to be the outcome variable of interest. When we consider velocity of cartilage thinning to be the outcome variable of interest, we find the patellar and tibial cartilage compartments to have the most results indicating statistically significant explanatory power for the pain, bone, and meniscus/cartilage phenotypes.
In application, the regression coefficients in Tables 1 and 3 imply that subject knees with the bone (osteophyte) phenotype tended to have 156.1 micrometers less cartilage on average in the patellar compartment and tended to thin 5 micrometers faster at each timepoint than subject knees without. To understand the magnitude of this change, we observe that the patella compartment has an average cartilage thickness of 2.112 millimeters across all subjects. This interpretation of regression coefficients can be applied to all statistically significant results.
Discussion
These results suggest that the presence or absence of each of the ROAMES morphological phenotypes in a subject is likely predictive of OA disease trajectory as measured by cartilage thinning. Regression coefficients in Table 1 imply that knees with each ROAMES morphological phenotype tend to have decreased cartilage thickness at each timepoint in each compartment as compared with knees without each phenotype. Findings indicate that the presence or absence of pain and inflammation have statistically significant explanatory power of cartilage thickness over time. Further, these results indicate that velocity of cartilage degradation could be related presence or absence of bone and cartilage lesions phenotypes than to traumatic or late-stage disease indicators like the inflammatory or hypertrophy phenotypes. This expanded analysis aligns with previous work to suggest that a difference in progression trends exists for knees with and without each ROAMES morphological phenotype as predicted from MRI3,5.Conclusion
We find that the presence or absence of ROAMES morphological phenotypes as predicted from MRI is a useful indicator of cartilage thinning over time. Understanding and modeling the different trends and pathways of OA disease progression is essential to understanding the efficacy of disease modifying osteoarthritis drugs in clinical trials, as well as to improving prognosis and outcomes for patients.Acknowledgements
Thank you to the National Institute of Health for funding this work with grants R00AR070902 and R33AR073552.References
- Roemer, F. W. et al. MRI-based screening for structural definition of eligibility in clinical DMOAD trials: Rapid OsteoArthritis MRI Eligibility Score (ROAMES). Osteoarthritis Cartilage 28, 71–81 (2020).
- NIMH Data Archive - OAI. https://nda.nih.gov/oai/.
- Namiri, N. K. et al. Deep learning for large scale MRI-based morphological phenotyping of osteoarthritis. Sci. Rep. 11, 10915 (2021).
- Iriondo, C. et al. Towards understanding mechanistic subgroups of osteoarthritis: 8-year cartilage thickness trajectory analysis. J. Orthop. Res. 39, 1305–1317 (2021).
- Lee, J., Liu, F., Majumdar, S. & Pedoia, V. (ISMRM 2019) Predicting Pain Trajectories in Knee Osteoarthritis Subjects by Learning Image Biomarkers from Structural MRI. https://archive.ismrm.org/2019/1411.html.
Figures
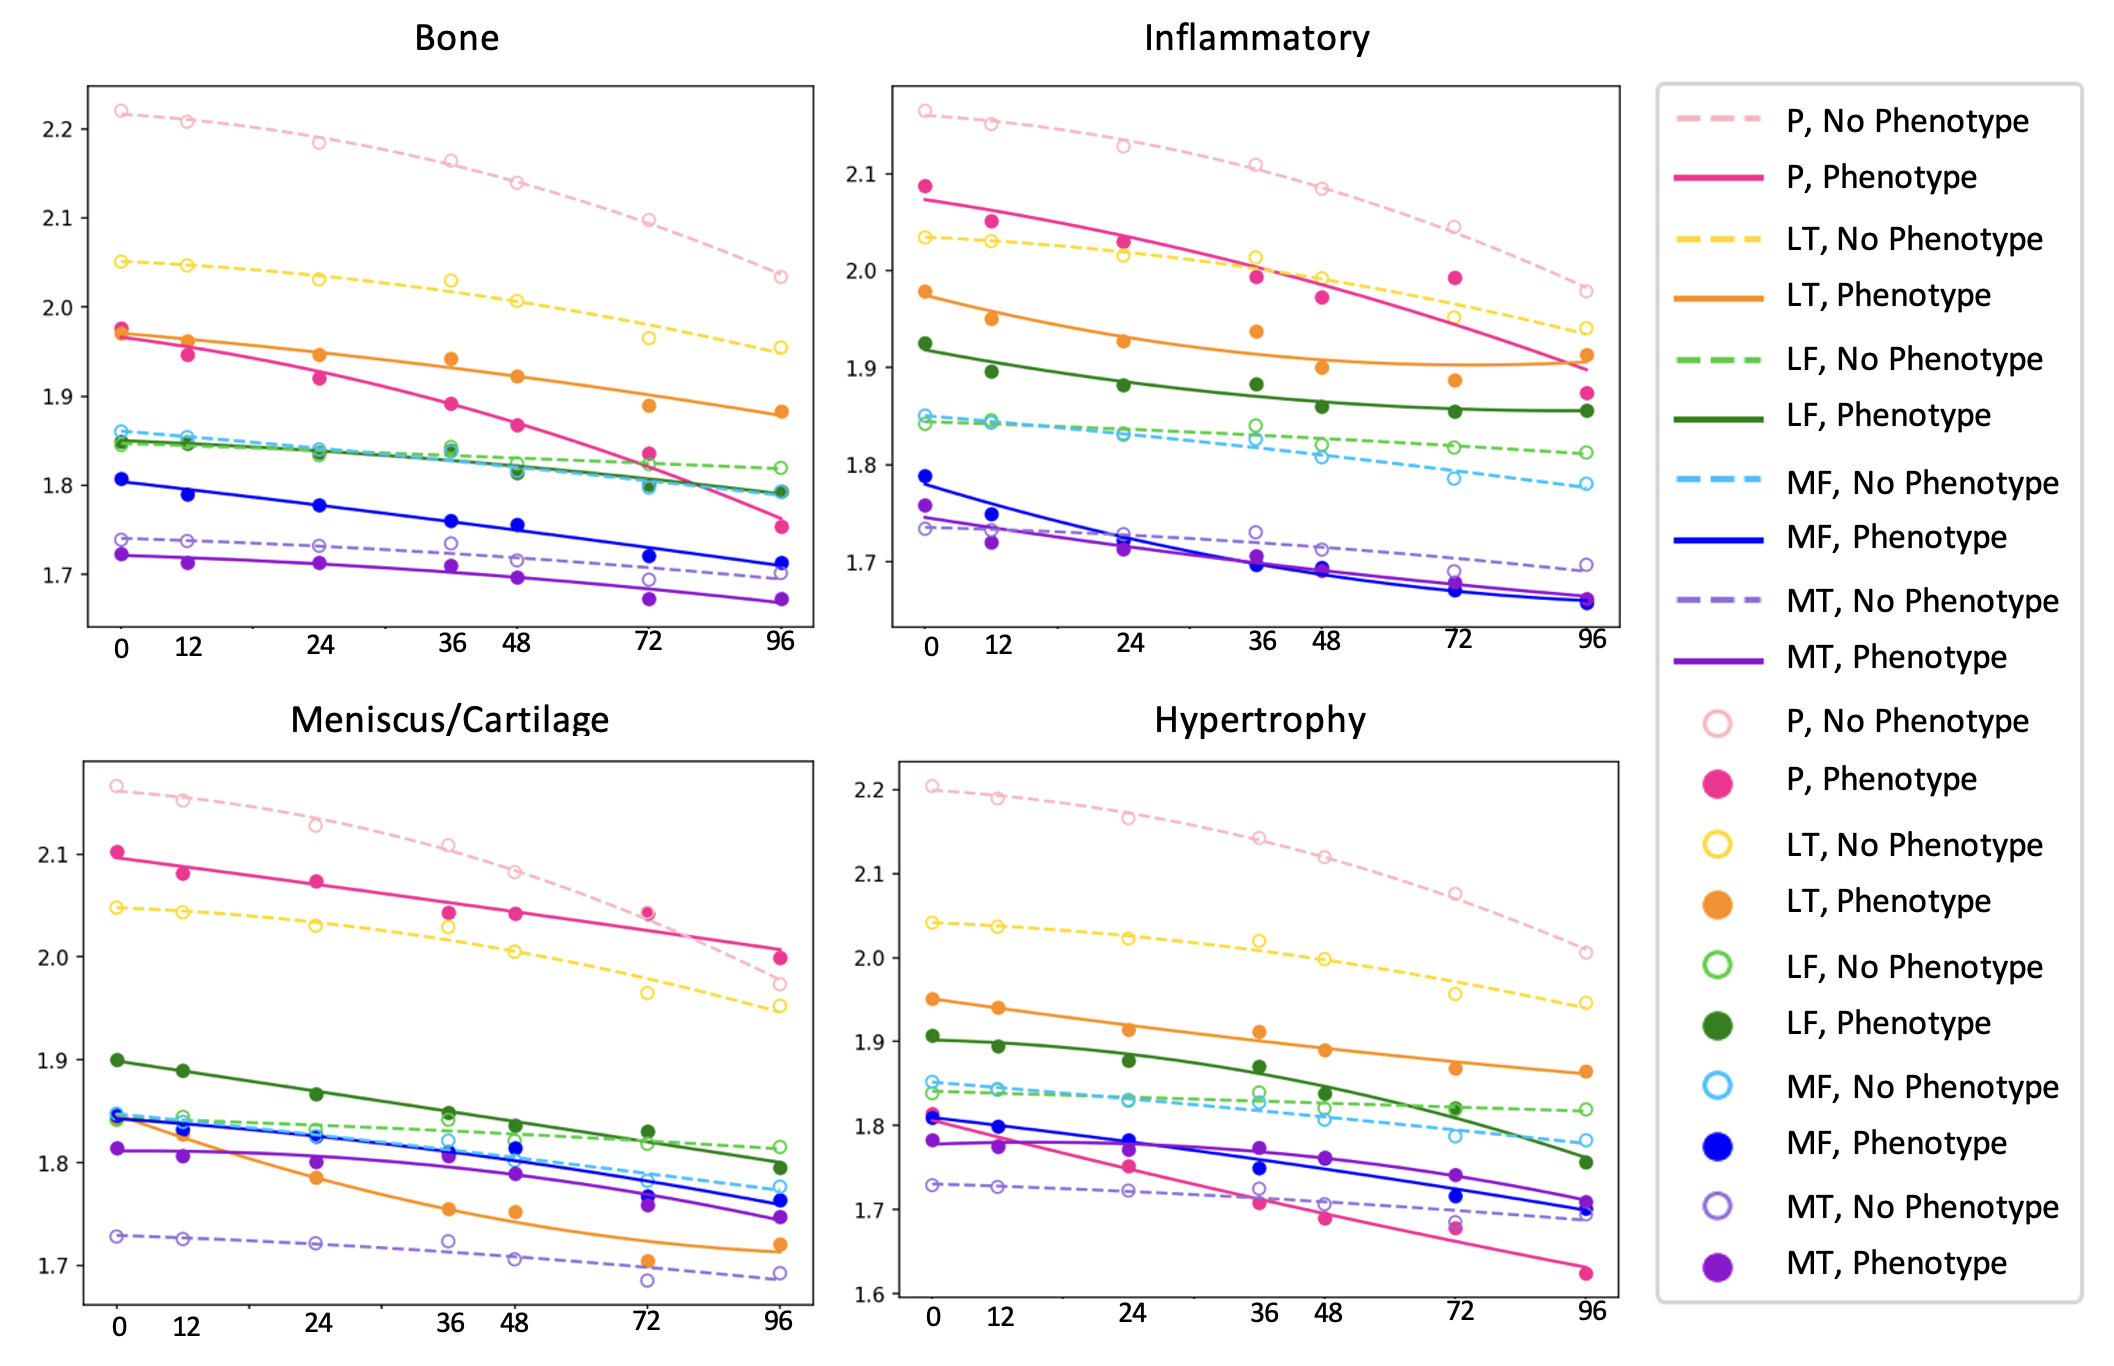
Figure 1: Mean cartilage thickness in millimeters (y) across all knees versus time in months (x), grouped by the presence or absence of each ROAMES morphological phenotype in each knee as identified from MRI.
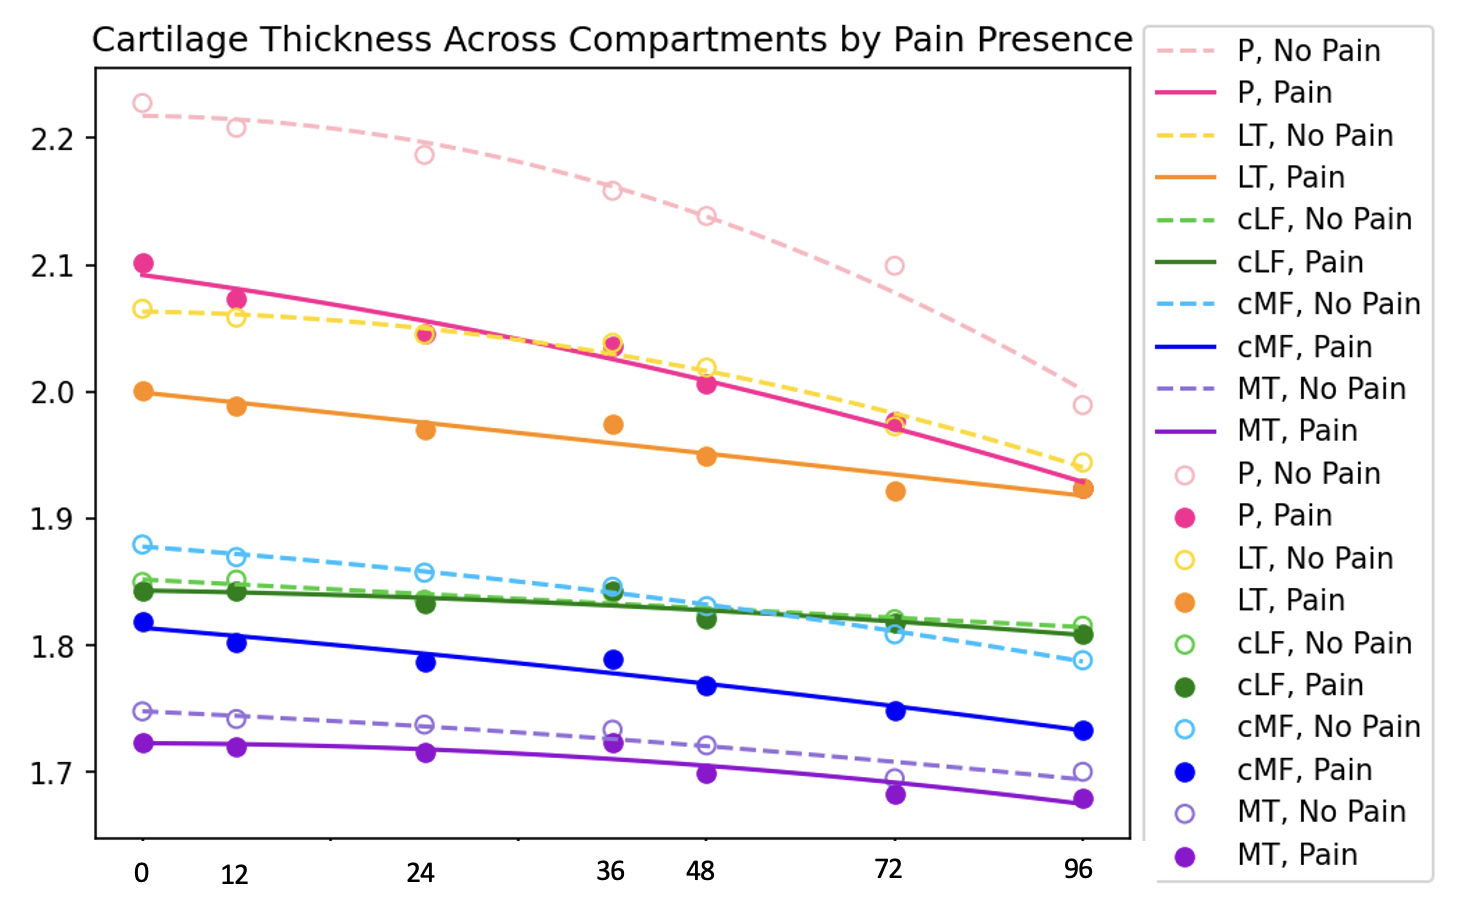
Figure 2: Mean cartilage thickness in millimeters (y) across all knees versus time in months (x), grouped by the presence or absence of pain in the knee as defined by WOMAC ³ 5.
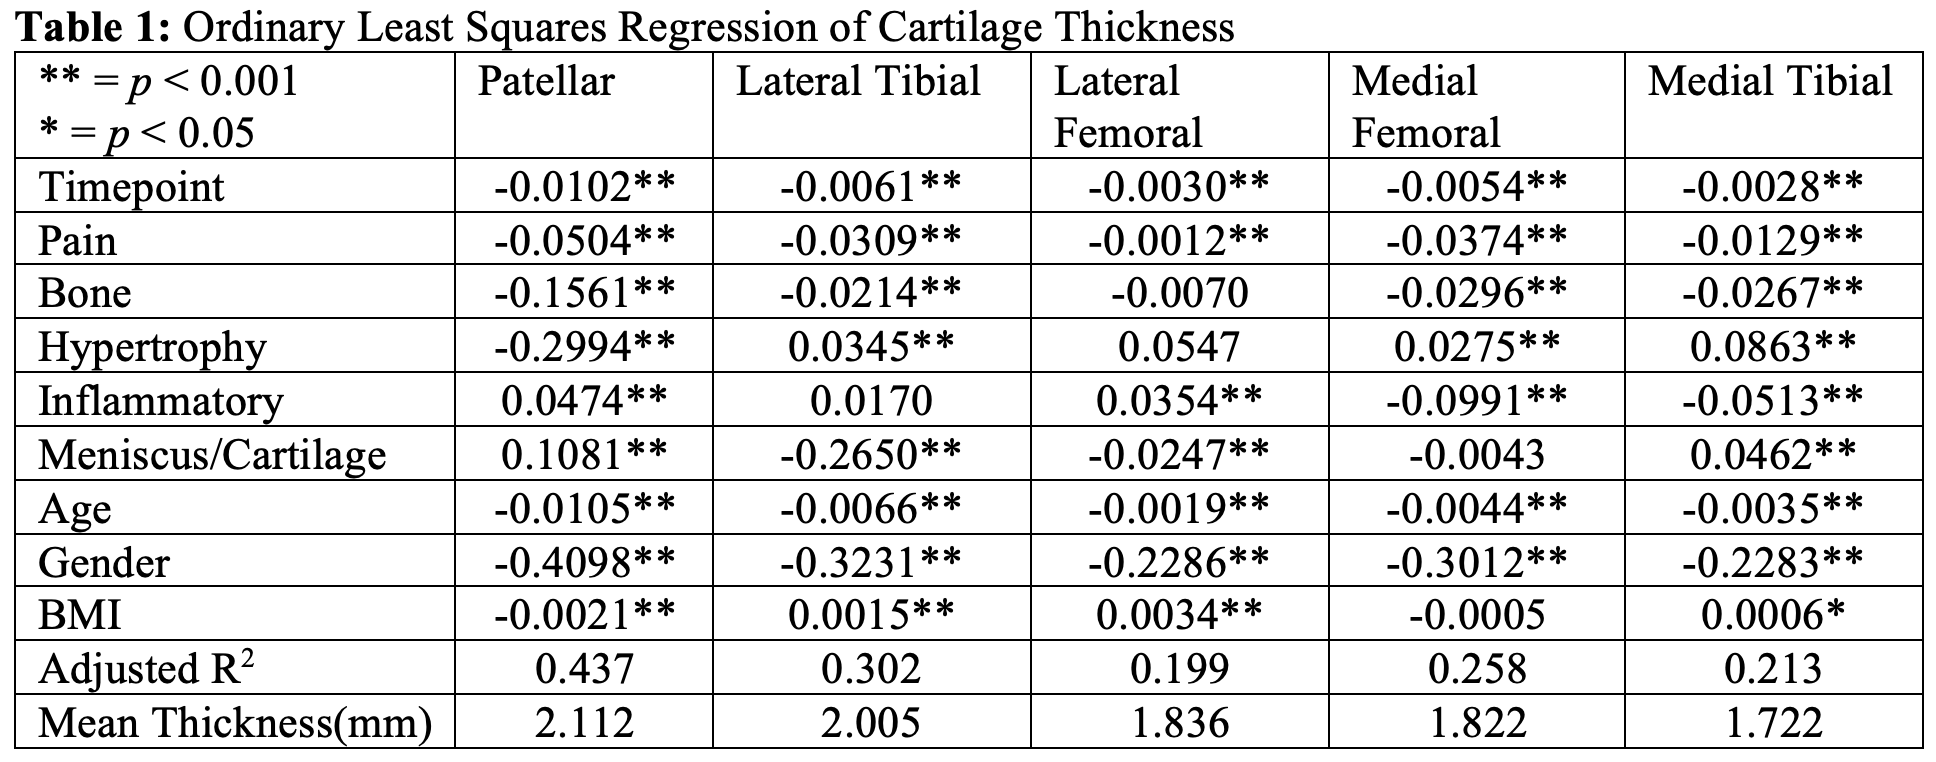
Table 1: Ordinary Least Squares Regression of Cartilage Thickness
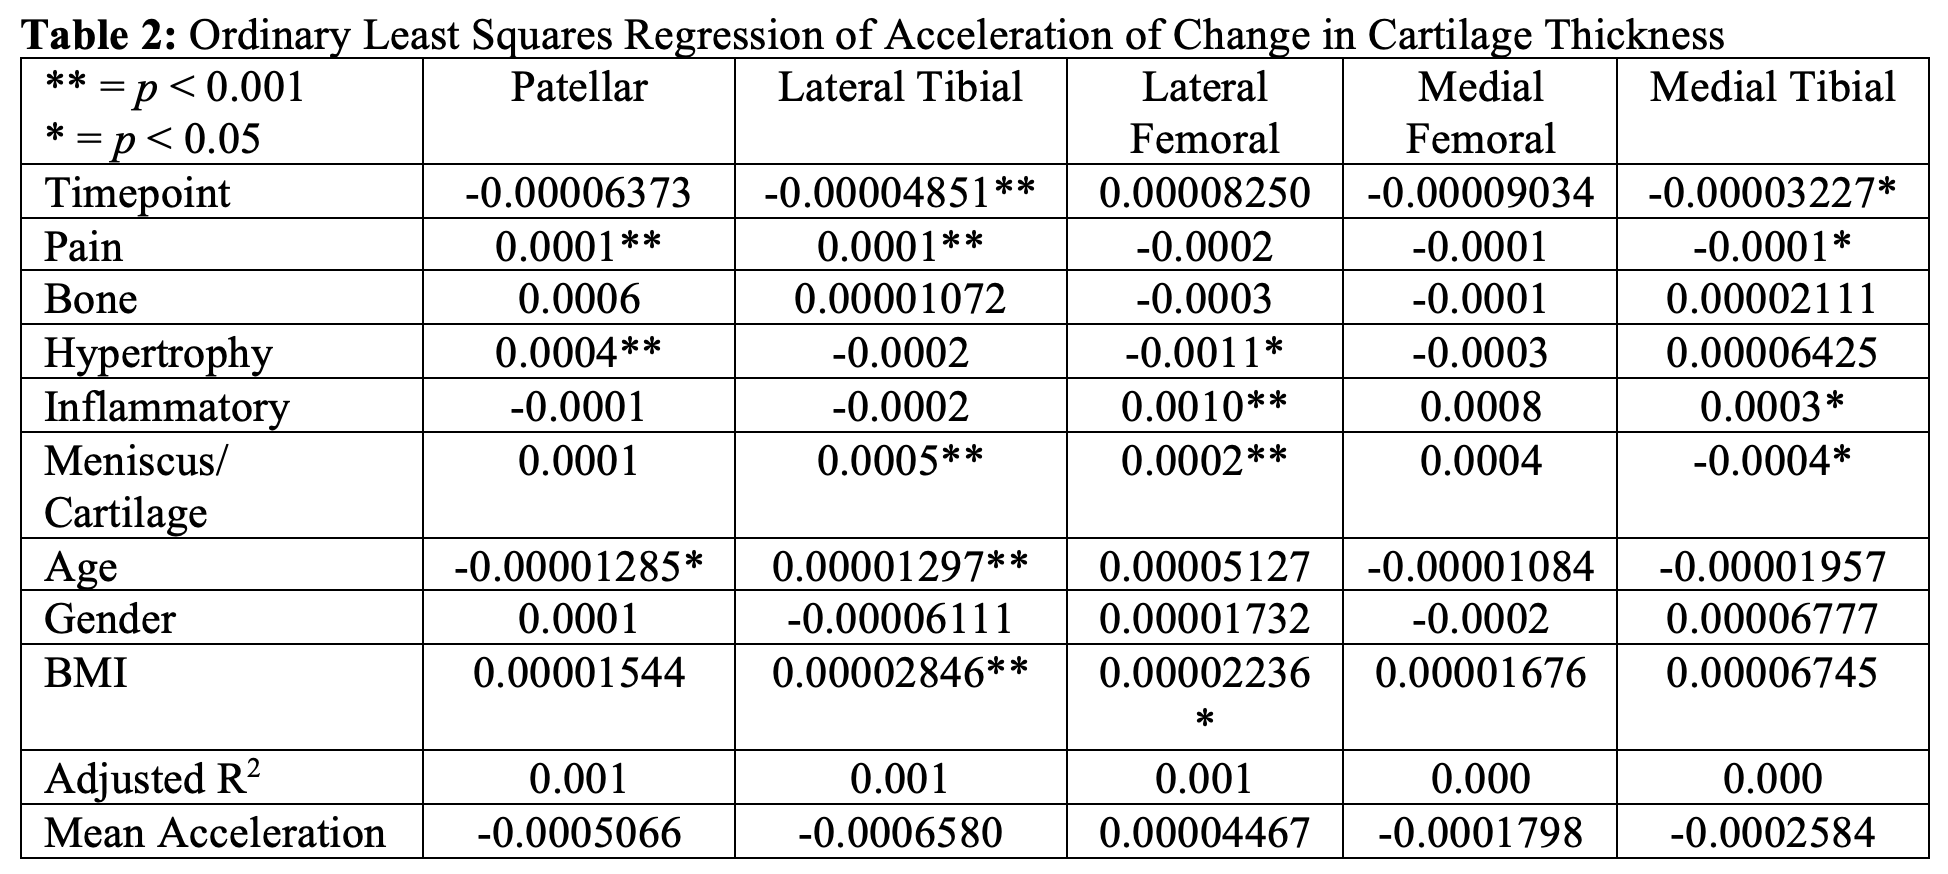
Table 2: Ordinary Least Squares Regression of Acceleration of Change in Cartilage Thickness
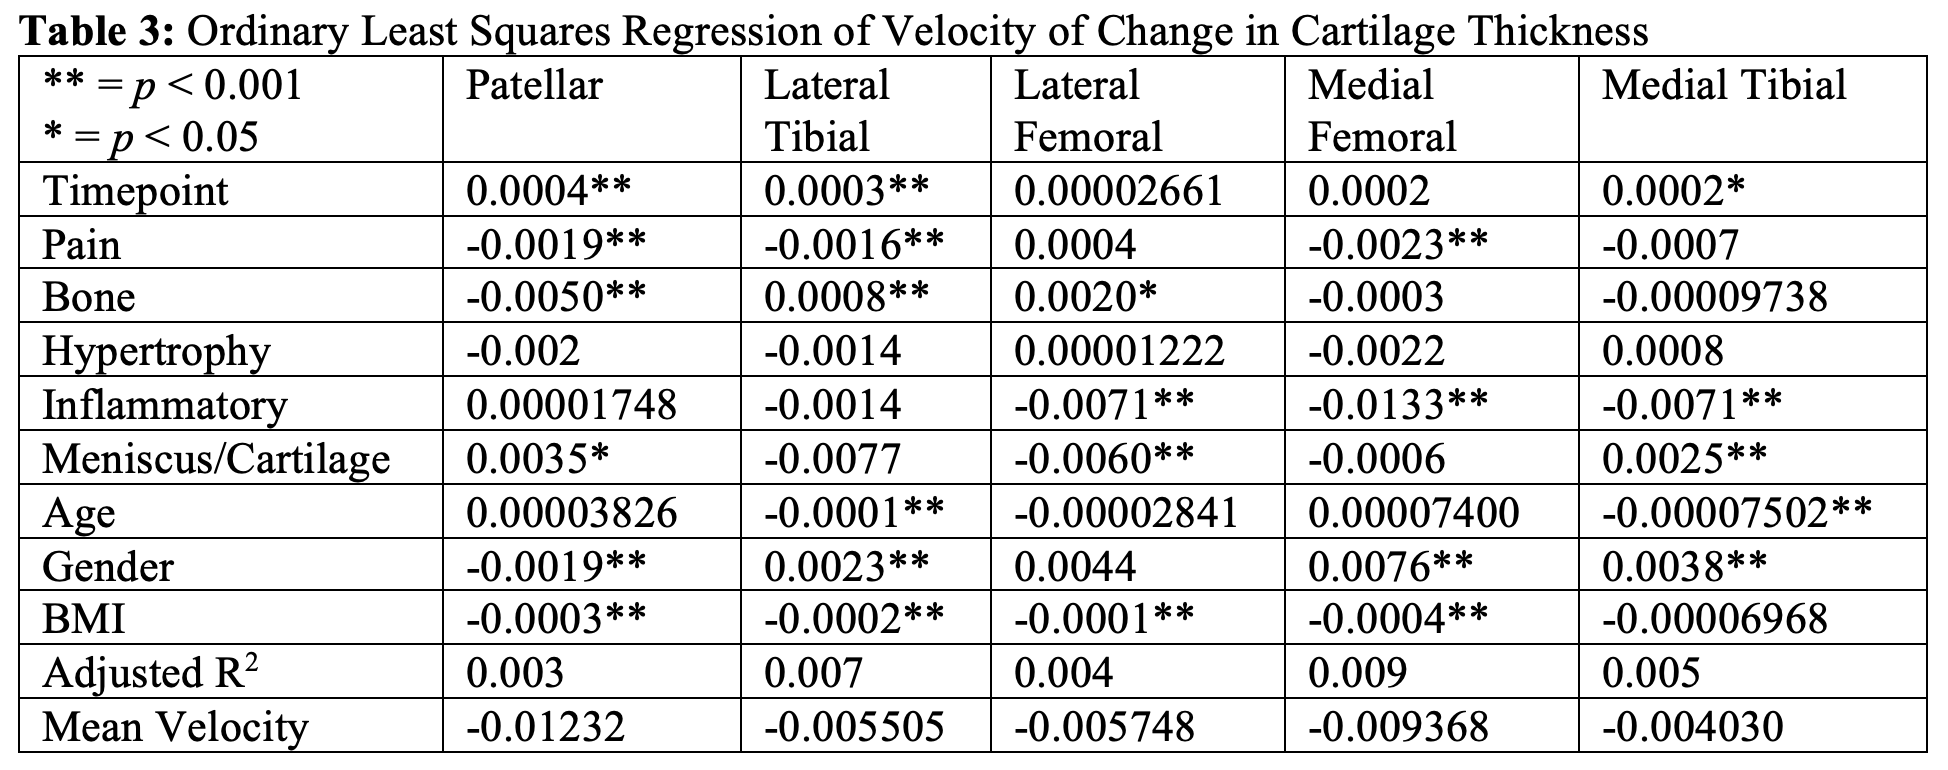
Table 3: Ordinary Least Squares Regression of Velocity of Change in Cartilage Thickness
DOI: https://doi.org/10.58530/2023/0957