0956
Assessing Sex Differences in Abdominal Fat Depots of People with Obesity under Weight Loss using Automated Segmentation1Department of Diagnostic and Interventional Radiology, School of Medicine, Technical University of Munich, School of Medicine, Technical University of Munich, Munich, Germany, 2Institute for Nutritional Medicine, School of Medicine, Technical University of Munich, Munich, Germany, 3Else Kroener-Fresenius-Center of Nutritional Medicine, School of Life Sciences, Technical University of Munich, Freising, Germany
Synopsis
Keywords: Fat, Metabolism, Obesity
A deep-learning algorithm based on the nnU-Net and using water-fat images enabled robust automatic segmentation of abdominal organs including visceral and subcutaneous adipose tissue, liver, iliopsoas and erector spinae muscle groups. Each organ's volume and fat content were examined in a weight loss study comprising 127 subjects with BMI of 30-39.9kg/m2, who followed a low caloric diet (LCD). Dixon water-fat images were acquired before and after diet. Differences in fat distribution among abdominal organs and fat content was assessed among both sexes. Differences in the changes of organ volume and fat fraction as a response to the LCD were revealed.Introduction
With a rapid increase of the prevalence of obesity[1], the amount of research in effective weight loss studies has grown[2,3]. Body composition profiling using MRI can non-invasively assess the distribution of fat, adipose tissue, and fat-free mass in the body, but requires accurate and automated segmentation. Deep learning methods have gained attention for tissue segmentation in MRI[4,5].Recently, nnU-Net was proposed that automatically sets the optimal configurations and creates a specific pipeline of a U-Net-like network with its corresponding hyperparameters[6], and it had been used for segmentation of abdominal organs for volume estimation[7]. In the present work, an nnU-Net-based automated segmentation method based on water-fat images was used to evaluate the organ volume and fat content in the most important abdominal fat depots including visceral adipose tissue (VAT), subcutaneous adipose tissue (SAT), and ectopic fat in the liver, the iliopsoas muscle, and the erector spinae muscle groups.
Methods
MRI measurements All scans were performed on a 3T scanner (Ingenia Elition X, Philips Healhcare). A 3D multi-echo gradient echo sequence with bipolar readout and 6 echoes was used. 4 stacks covering the abdomen and pelvis were acquired during breath-hold scans of 10.3 seconds per stack. ($$$TR/TE_1/\Delta TE = 7~ms /1.14 ~ms / 0.8~ ms$$$, flip angle = $$$3^\circ$$$, acquisition voxel size $$$= 3\times3\times6~ mm^3$$$, $$$FOV = 400~mm \times 543.4~mm \times 144~mm ~(AP \times RL \times FH)$$$, CS-SENSE reduction factor = 3.5, bandwidth = 2367.4 Hz).Chemical shift encoding-based water-fat separation was performed on the scanner which rendered water- and fat-separated images, as well as PDFF and T2* maps.Study cohort
127 subjects of the lifestyle intervention study (LION)[3] were participating in MR scanning. A low calorie diet (LCD) was followed for a duration of 8 weeks. MR scans were performed at baseline, and the follow-up scans were performed after 8 weeks of the LCD. Of the 127 subjects, 82 received the follow-up scans.
Training In total, 98 data sets with manual segmentations were available (split of training:testing=80:18). We trained a 3D-UNet[8] and the nnU-Net[6] using an Ubuntu 16.04 system with an Intel Core i7-6700 CPU on a CuDNN version 8200 and CUDA 11.3. Available GPUs were a 24 GB Nvidia Quadro P6000, and a 12 GB Nvidia Titan Xp.
Statistics Statistical analysis of sex differences was conducted in Python. As the Shapiro–Wilk analysis revealed no normal distribution for our examined data, the Mann-Whitney U test was used thereafter.
Results
nnU-Net vs 3D U-NetnnU-Net showed a better performance both by visual inspection of the segmentation outcome (Fig.1), and the Dice score(Fig.2). A small improvement in terms of Dice score was observed when using T2* maps as additional input channel(Fig.2A)). Bland-Altman plots for each organ's volume and mean PDFF were computed (Fig.2B)). Example segmenation for one subject before and after diet is shown in Fig.3.
The slice-wise distribution of SAT, VAT, as well as lean tissue(LT), before starting the diet, is represented in Fig.4A) as a 1D projection onto the z-axis. In Fig.4B) the projected volume change per z location is shown. The amount of SAT, VAT and LT per slice is plotted onto a normalized axis between the start of the liver dome and the center of the femur head.
Study outcome
The median BMI at baseline was $$$33.75 \frac{kg}{m^2}$$$ and $$$29.64 \frac{kg}{m^2}$$$ after diet.
All organ volumes at baseline were significantly larger in the male obese cohort compared to the female sub-cohort, except for SAT volume. Female participants showed a slightly larger SAT volume at baseline (p=0.04) (Fig.5). The highest weight loss contribution originates from the SAT volume change for both male and female participants. Significant difference in terms of organ volume change between sexes was observed in the psoas, and erector muscle, as well as VAT (all p<0.001). No significant difference was seen in SAT and liver volume change.
Mean organ PDFF at baseline was significantly higher for females in the erector muscle and the SAT. In contrast, mean PDFF was significantly higher in liver and VAT for male participants. No significant difference was detected in the psoas muscle (Fig.5). A significant difference in organ PDFF change was observed in the SAT, and the liver, where the PDFF change was higher in males.
Discussion
Fully automated multi-organ segmentation of the abdominal and pelvic region was performed in DIXON water-fat images of an obese study cohort, which allowed to estimate both organ volume and organ PDFF. This enabled to evaluate how the LCD impacted different organs in different sub-cohorts. The nnU-Net outperformed the 3D U-Net based segmentation in terms of Dice score, as well as visual inspection of organ delineation. In comparison to existing abdominal segmentation works on MR-based body-composition[4,5,7], the proposed methodology includes the whole liver segmentation, and the study of two distinct muscle groups. The performed analysis revealed sex- and age-dependent abdominal fat distribution in an obese cohort and under a weight loss paradigm.Conclusion
Automated multi-organ segmentation using nnU-Net in the abdomen enabled robust and efficient whole organ delineation. In addition to organ volume estimation, the quantitative PDFF maps allowed for monitoring body composition changes as a response to the LCD in an obese cohort and revealed body composition differences among sexes.Acknowledgements
This study is funded by the German Federal Ministry of Education and Research (BMBF, grant number: 01EA1709) within the framework of the Junior Research Group for Personalized Nutrition \& eHealth (PeNut) of the enable Nutrition Cluster. Further, the present work was supported by the German Research Foundation (project number 450799851 and project number 455422993/FOR 5298-iMAGO-P1). The authors from the department of radiology also acknowledge research support from Philips Healthcare.References
[1] Z. J. Ward, S. N. Bleich, A. L. Cradock, J. L. Barrett, C. M. Giles, C. Flax, M. W. Long, andS. L. Gortmaker, "Projected u.s. state-level prevalence of adult obesity and severe obesity,"New England Journal of Medicine, vol. 381, no. 25, pp. 2440{2450, 2019. PMID: 31851800.
[2] L. J. Vogt, A. Steveling, P. J. Me ert, M.-L. Kromrey, R. Kessler, N. Hosten, J. Kruger,S. Gartner, A. A. Aghdassi, J. Mayerle, M. M. Lerch, and J.-P. Kuhn, "Magnetic resonanceimaging of changes in abdominal compartments in obese diabetics during a low-calorie weightlossprogram," PLOS ONE, vol. 11, p. e0153595, apr 2016.
[3] A. Reik and C. Holzapfel, "Randomized controlled lifestyle intervention (LION) study forweight loss and maintenance in adults with obesity|design and methods," Frontiers in Nutri-tion, vol. 7, nov 2020.
[4] Küstner T, Hepp T, Fischer M, Schwartz M, Fritsche A, Häring HU, Nikolaou K, Bamberg F, Yang B, Schick F, Gatidis S, Machann J. Fully Automated and Standardized Segmentation of Adipose Tissue Compartments via Deep Learning in 3D Whole-Body MRI of Epidemiologic Cohort Studies. Radiol Artif Intell. 2020 Oct 28;2(6):e200010. doi: 10.1148/ryai.2020200010. PMID: 33937847; PMCID: PMC8082356.
[5] Kway YM, Thirumurugan K, Tint MT, Michael N, Shek LP, Yap FKP, Tan KH, Godfrey KM, Chong YS, Fortier MV, Marx UC, Eriksson JG, Lee YS, Velan SS, Feng M, Sadananthan SA. Automated Segmentation of Visceral, Deep Subcutaneous, and Superficial Subcutaneous Adipose Tissue Volumes in MRI of Neonates and Young Children. Radiol Artif Intell. 2021 Jul 28;3(5):e200304. doi: 10.1148/ryai.2021200304. PMID: 34617030; PMCID: PMC8489452.
[6] F. Isensee, P. F. Jaeger, S. A. A. Kohl, J. Petersen, and K. H. Maier-Hein, "nnU-net: a selfcon guring method for deep learning-based biomedical image segmentation," Nature Methods,vol. 18, pp. 203{211, dec 2020.
[7] T. Kart, M. Fischer, T. Kustner, T. Hepp, F. Bamberg, S. Winzeck, B. Glocker, D. Rueckert,and S. Gatidis, "Deep learning-based automated abdominal organ segmentation in theUK biobank and german national cohort magnetic resonance imaging studies," InvestigativeRadiology, vol. 56, pp. 401{408, jan 2021.
[8] Çiçek, Ö., Abdulkadir, A., Lienkamp, S.S., Brox, T., Ronneberger, O. (2016). 3D U-Net: Learning Dense Volumetric Segmentation from Sparse Annotation. In: Ourselin, S., Joskowicz, L., Sabuncu, M., Unal, G., Wells, W. (eds) Medical Image Computing and Computer-Assisted Intervention – MICCAI 2016. MICCAI 2016. Lecture Notes in Computer Science(), vol 9901. Springer, Cham. https://doi.org/10.1007/978-3-319-46723-8_49
Figures
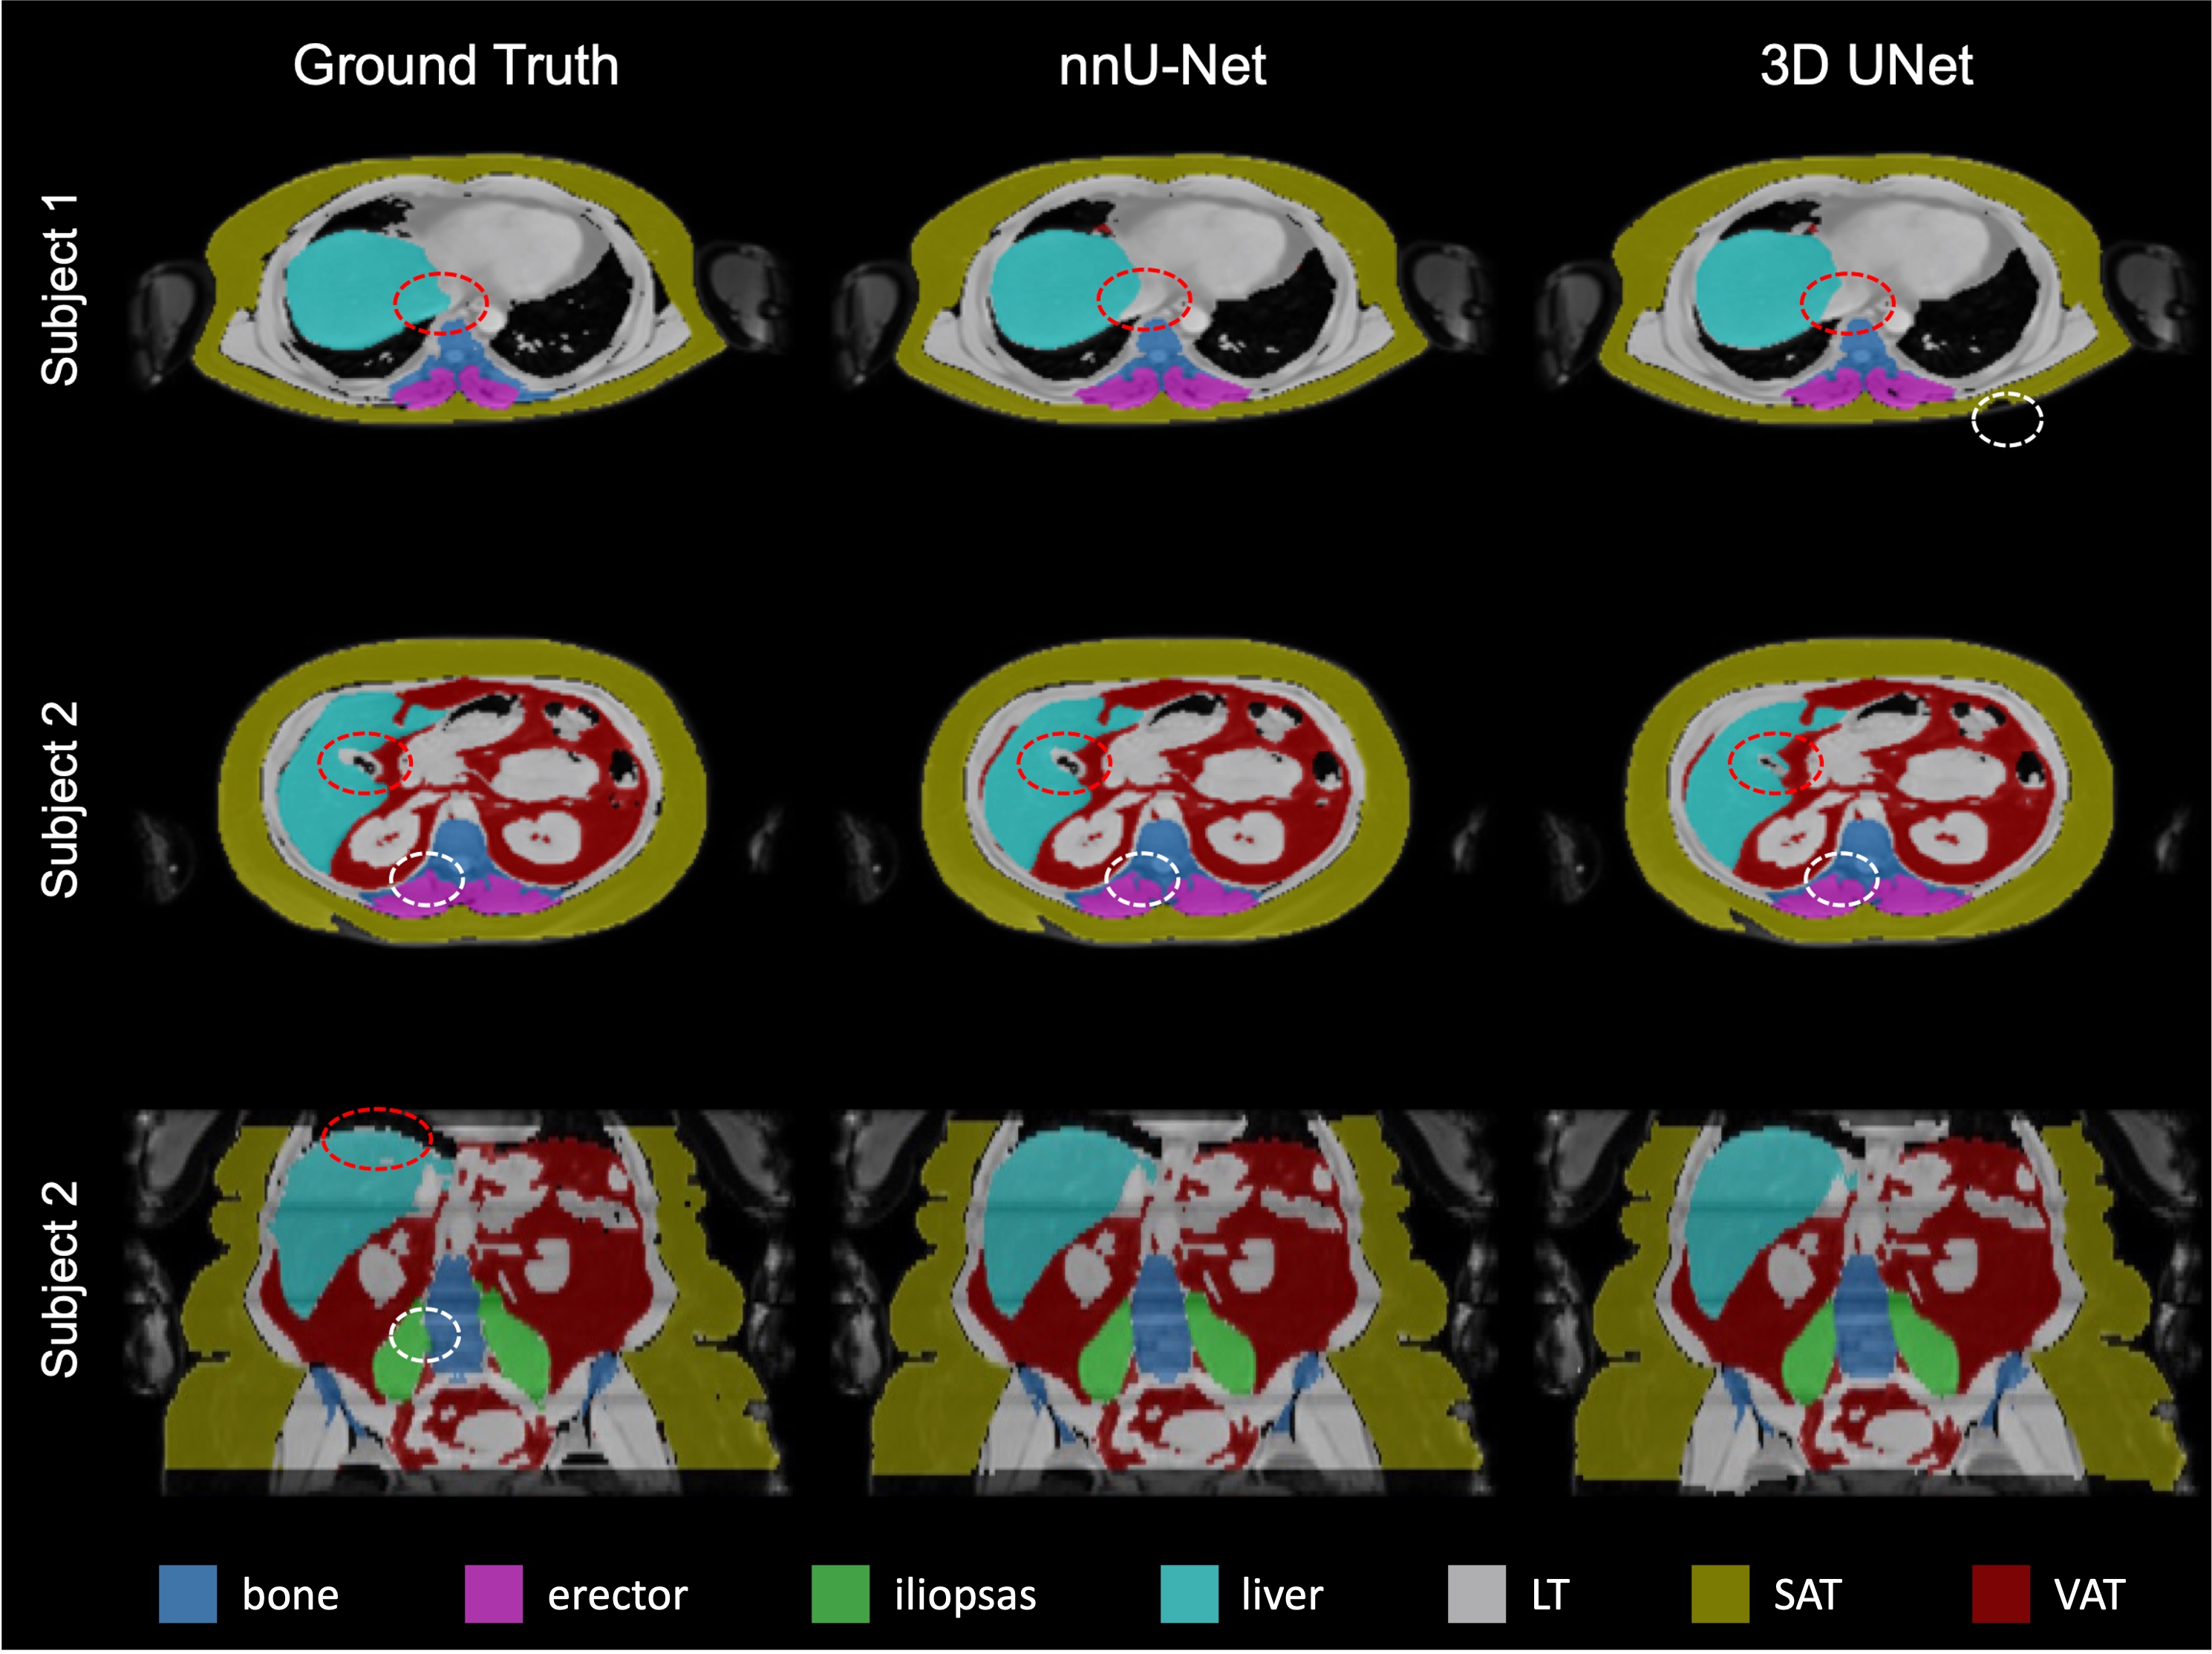
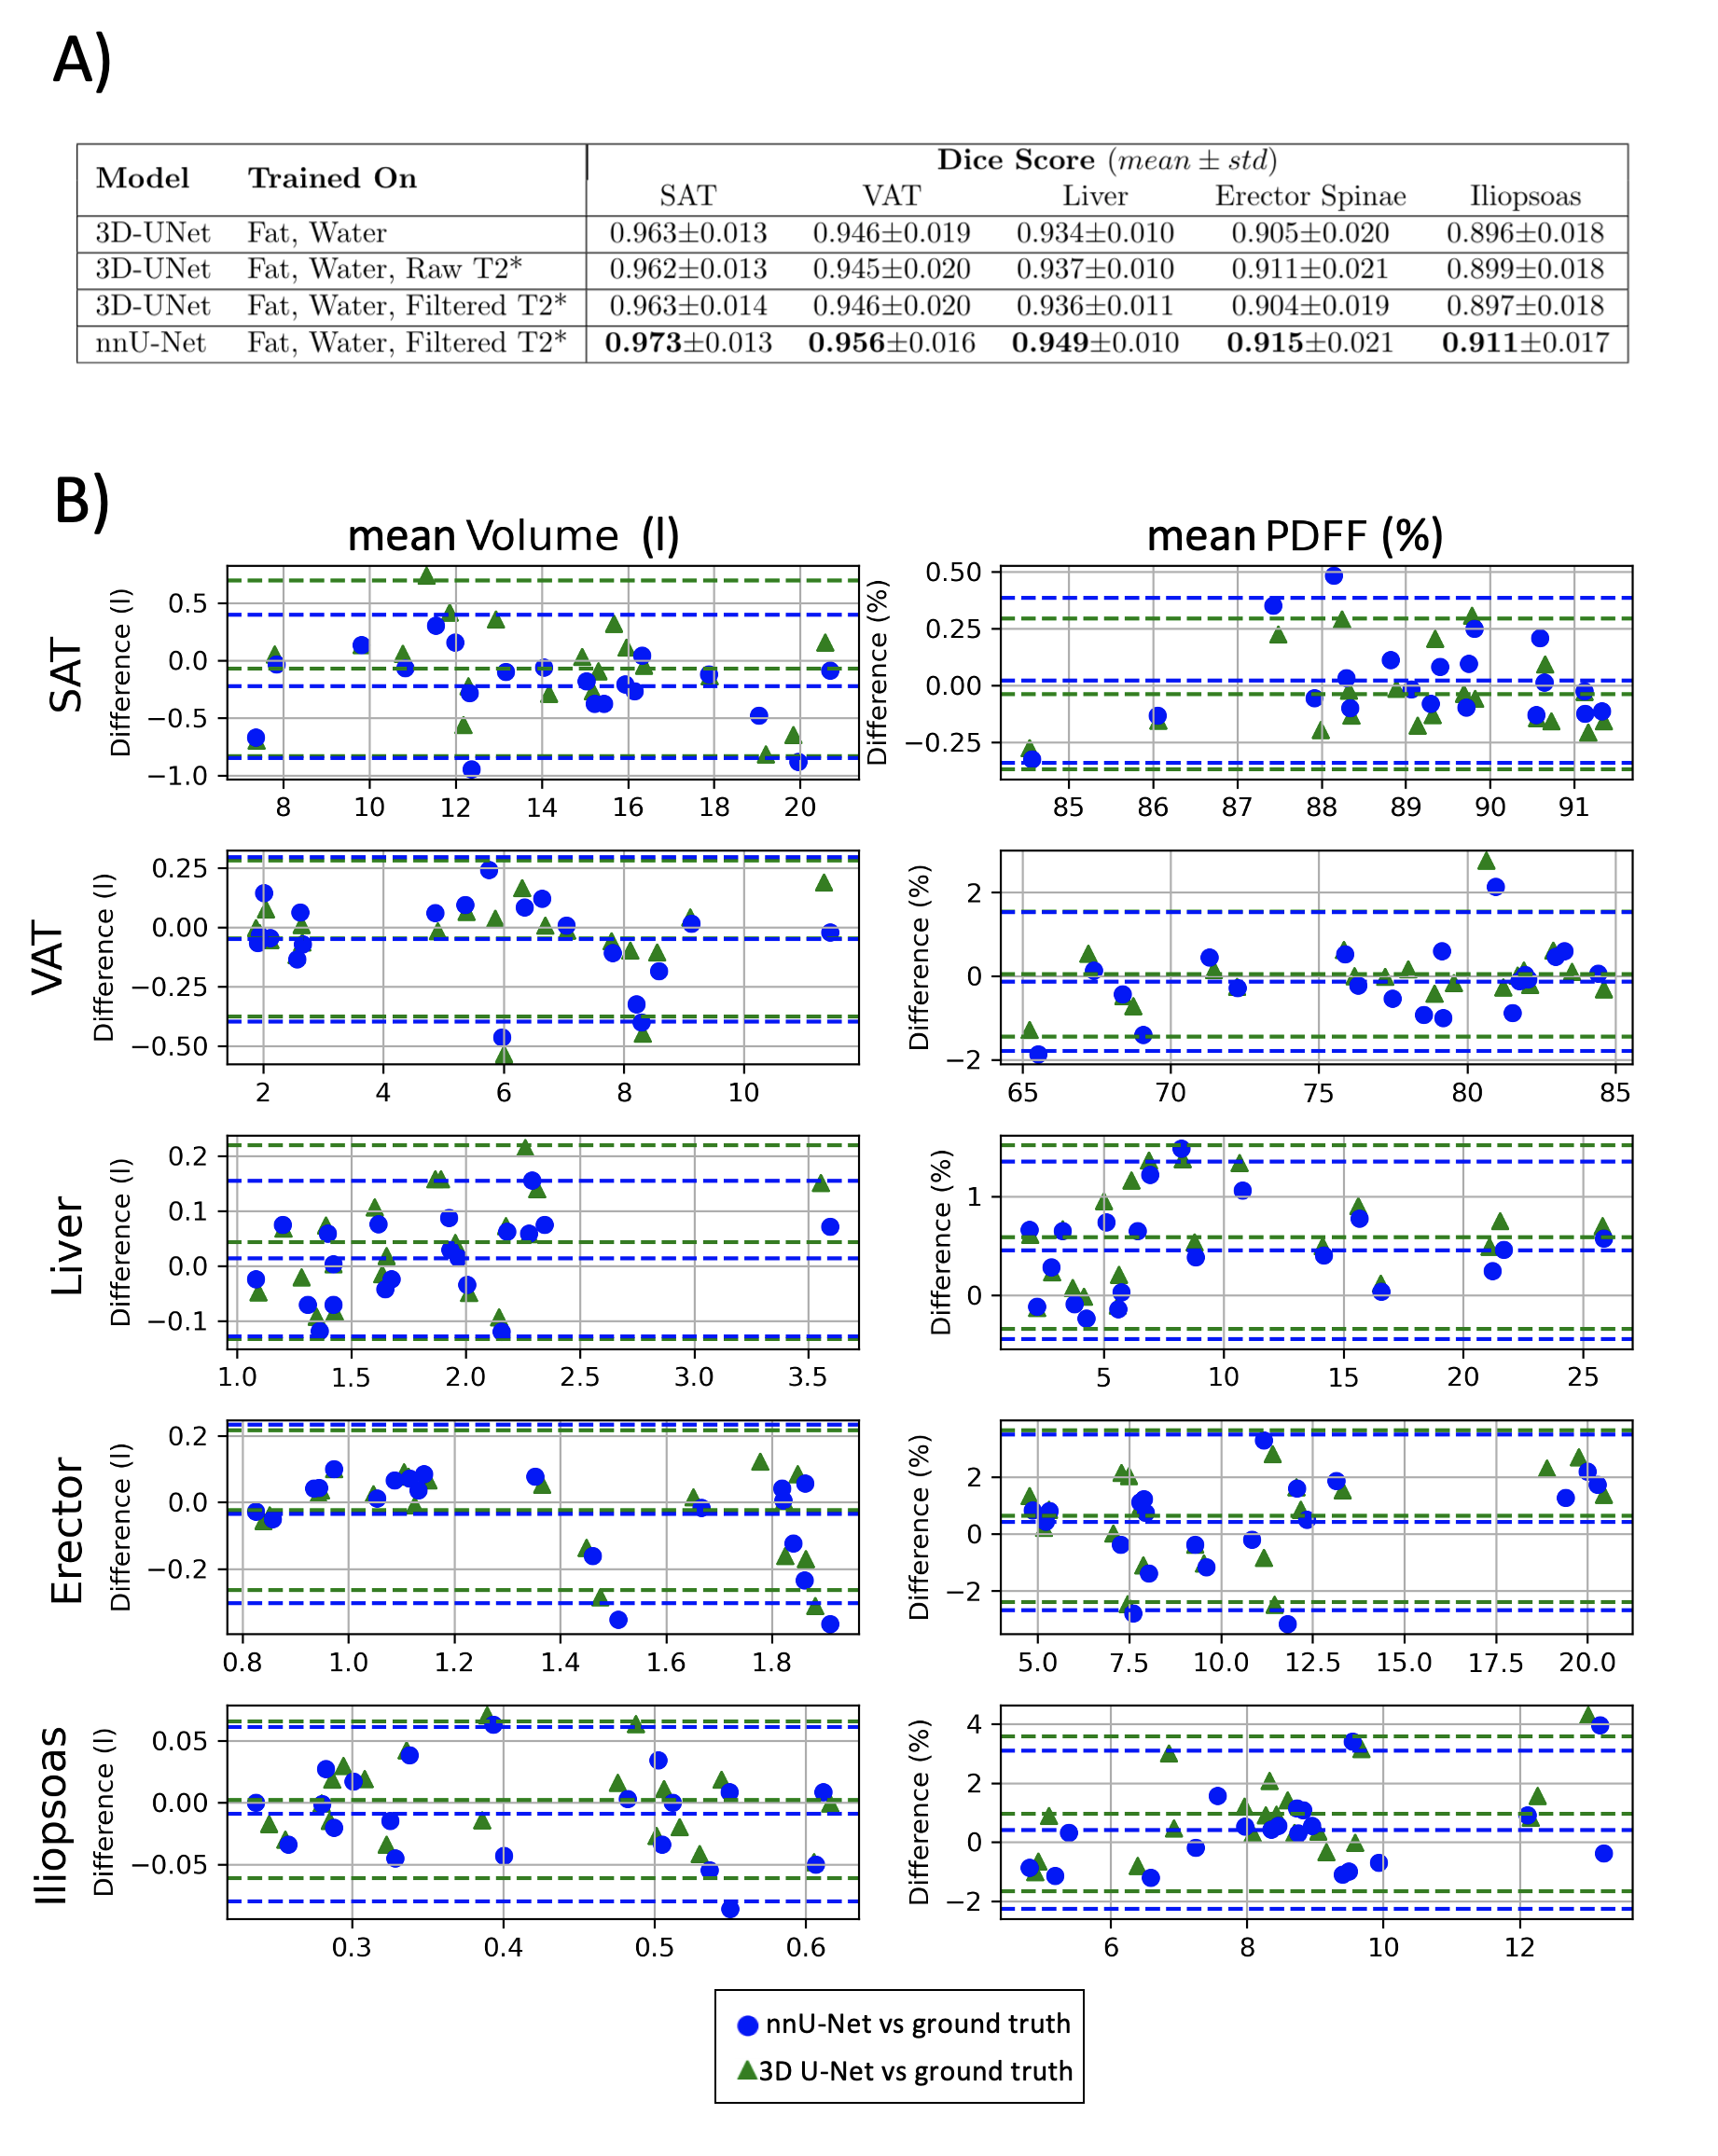
Fig.2 A Dice score comparison of 3D-UNet with different input channels and nnU-Net using ground truth labels. nnU-Net improved by 1 percentage point for every segmented organ.
B Bland-Altman-plots were computed from the extracted volume and mean PDFF per organ in either network predicted segmentation vs. the values extracted from the ground truth label. The difference was calculated by subtracting values of the network label from those of the ground truth label. A negligible bias and acceptable differences were observed between volume and mean PDFF resulting from different methods.
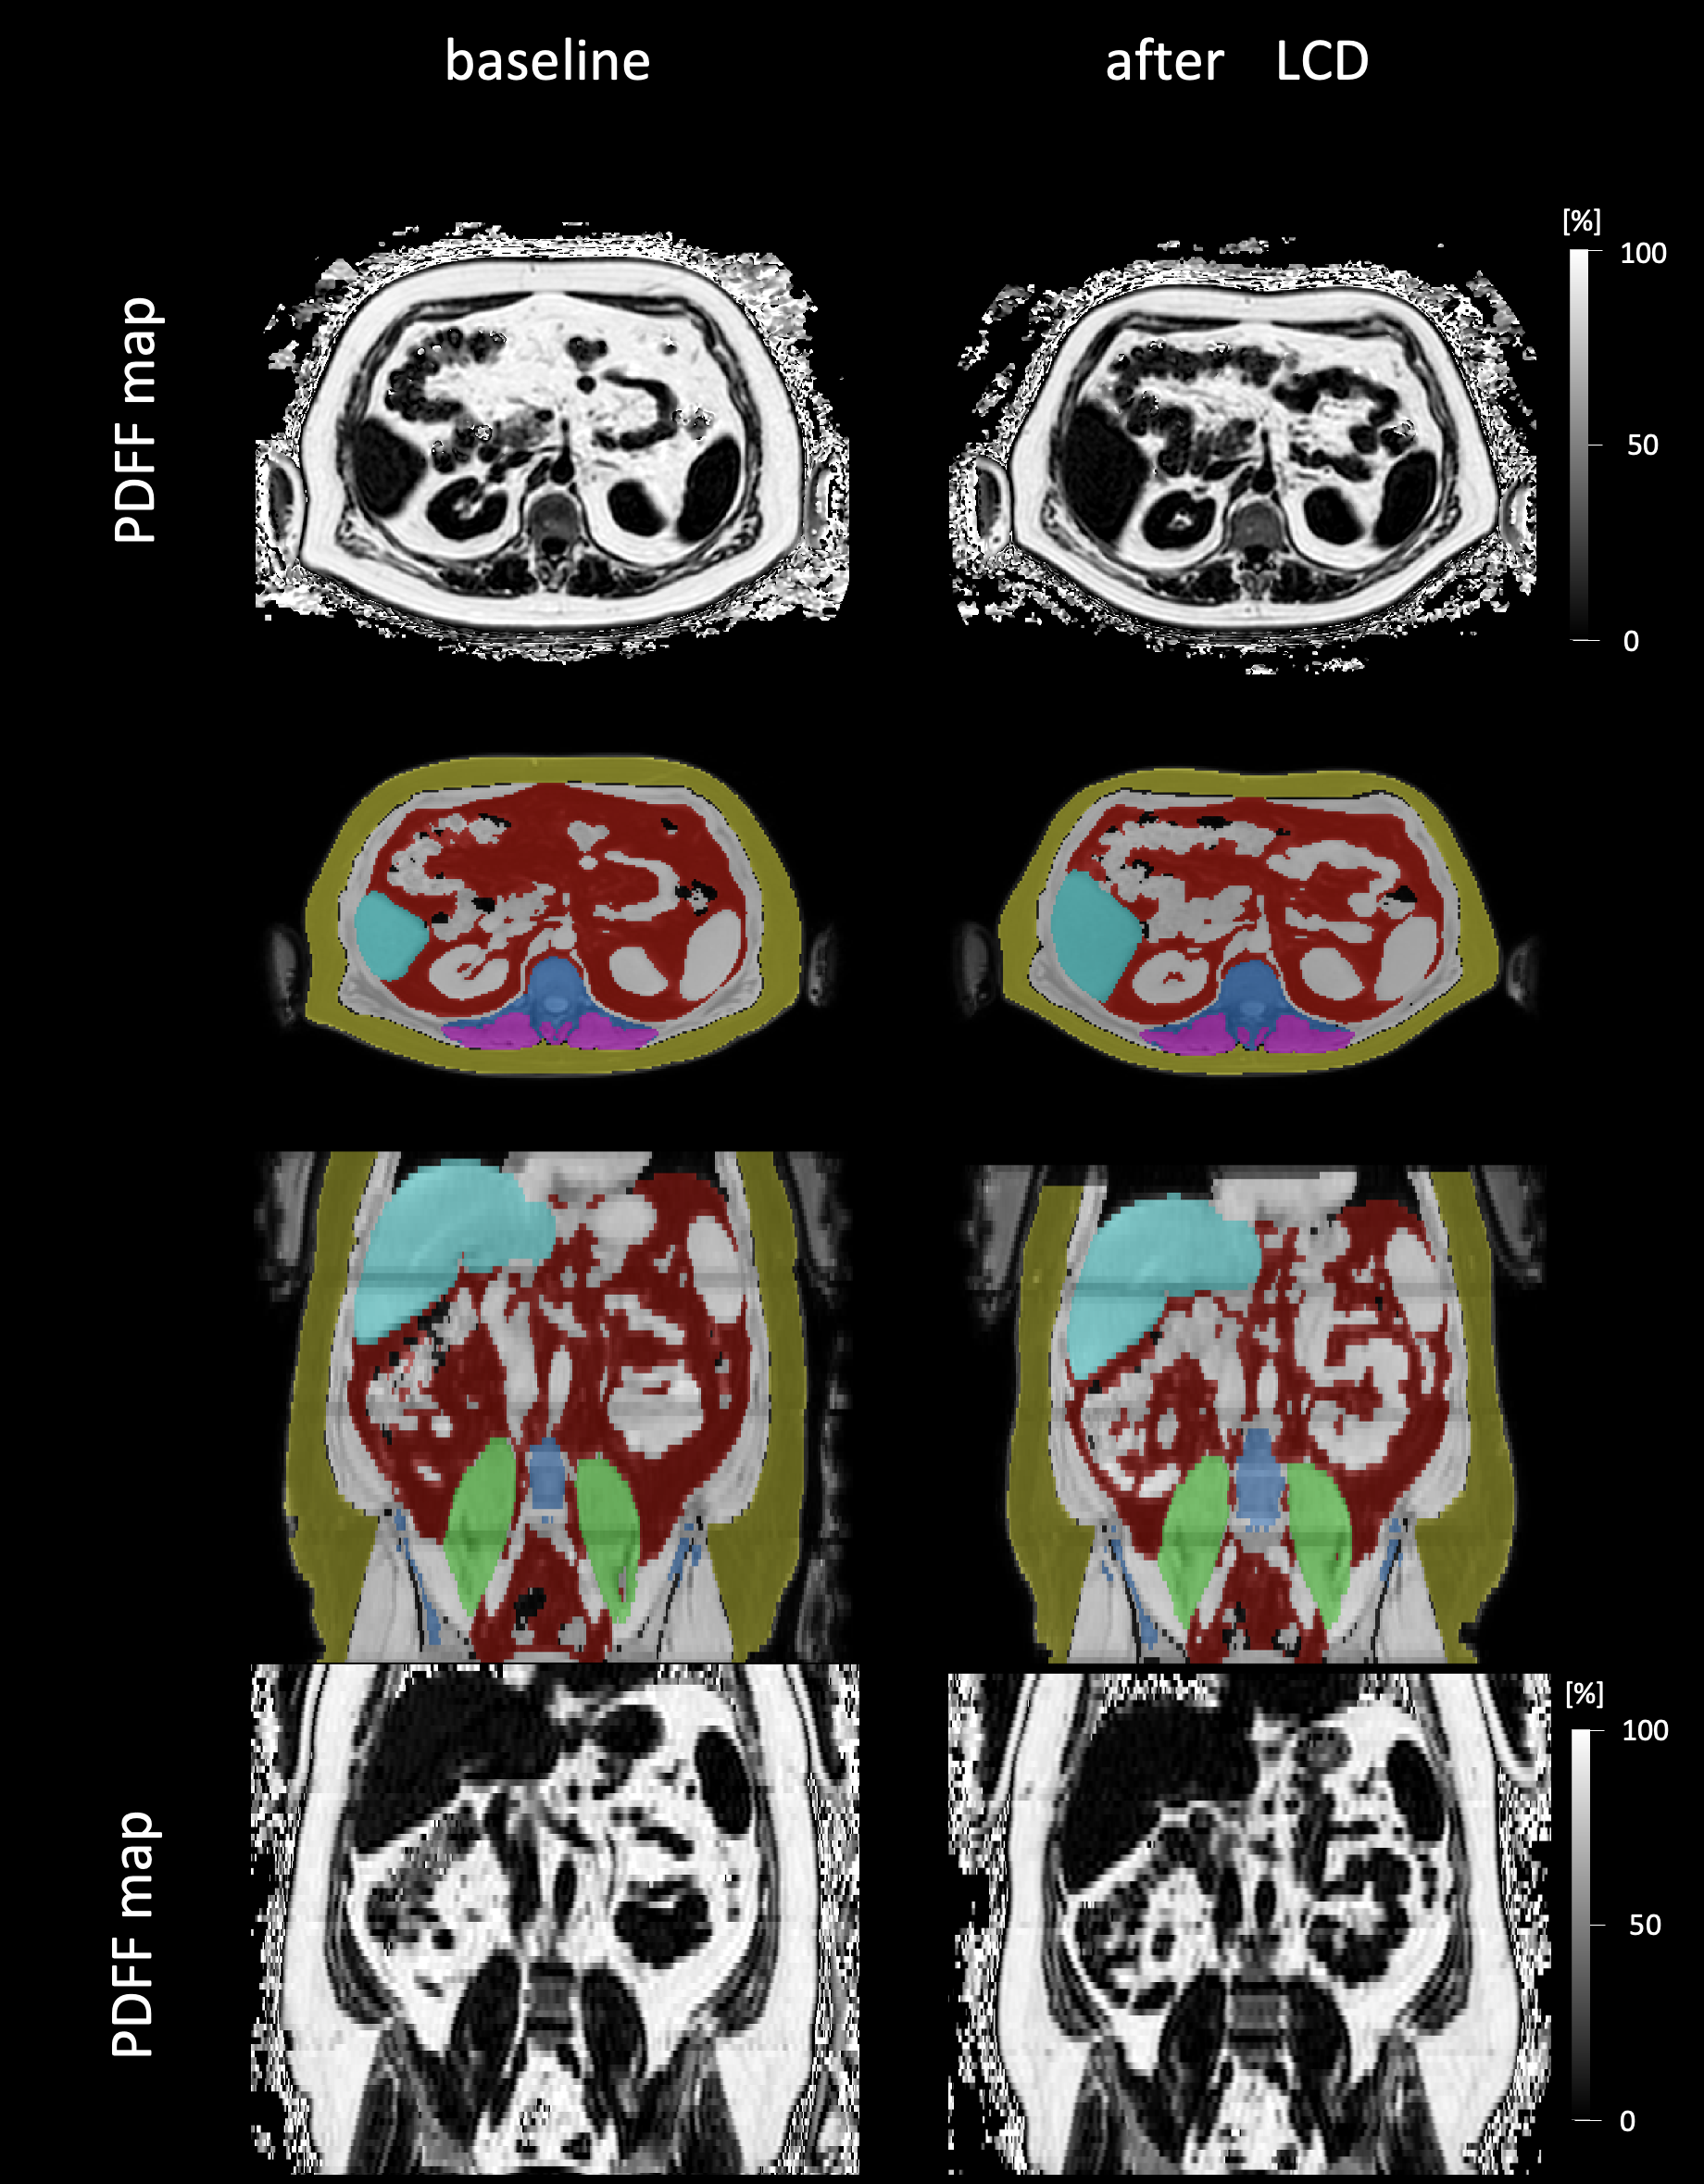
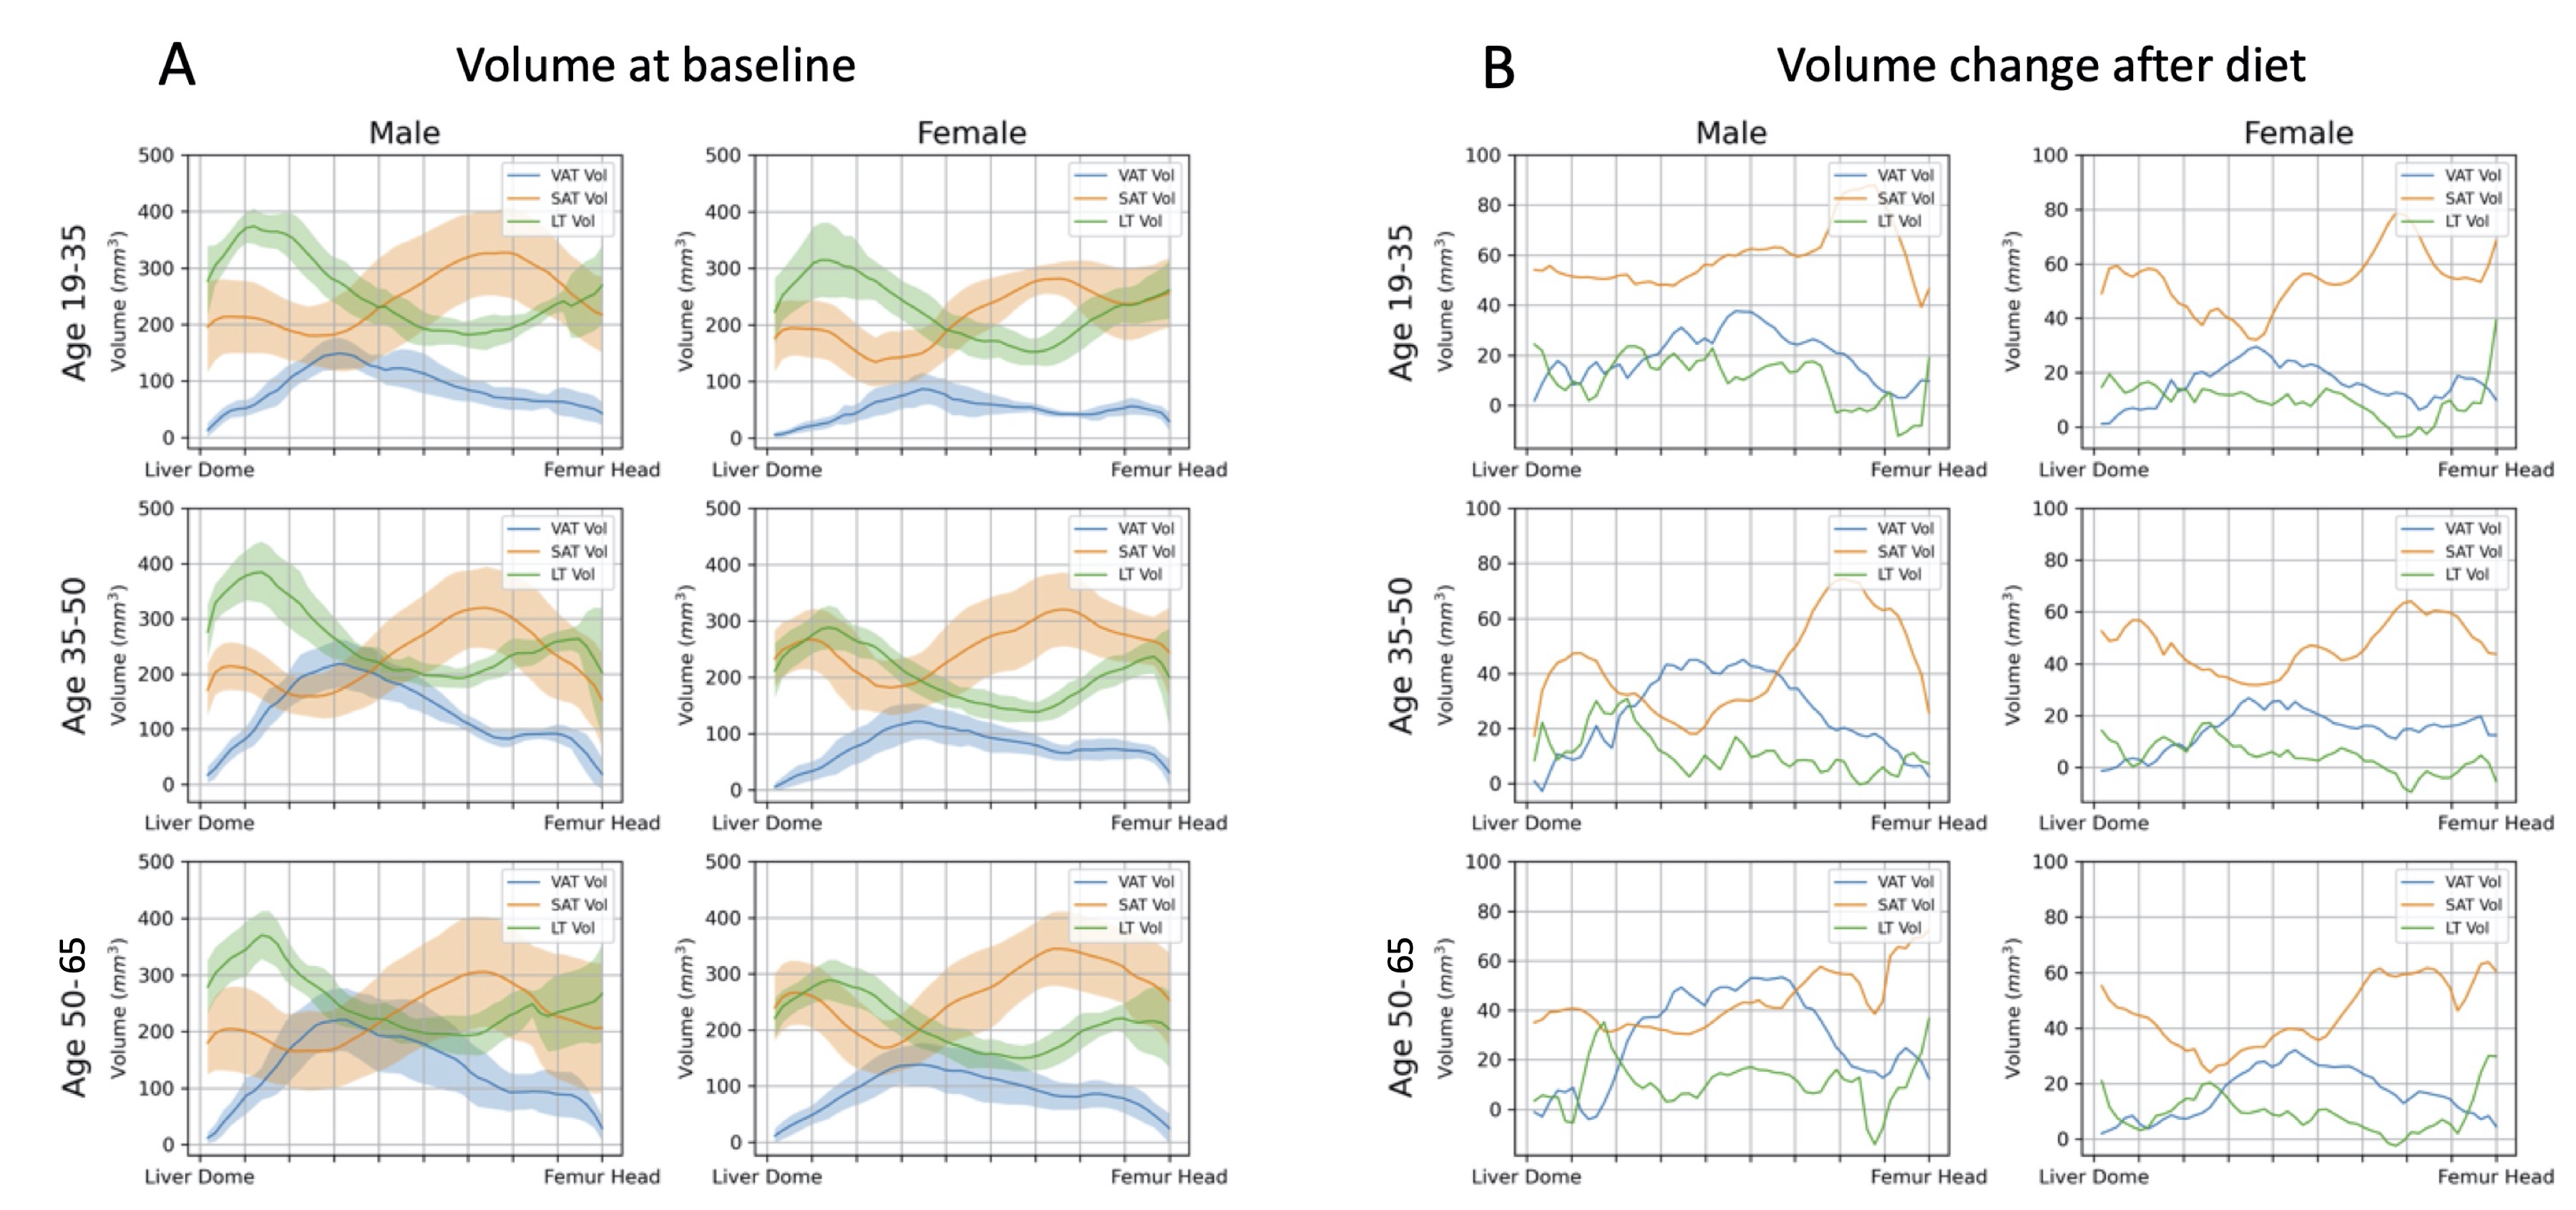
Fig.4 A) Distribution of VAT, SAT and LT in different age groups before diet. Males exhibited a higher volume of VAT in the abdominal region. The SAT volume distribution does not vary much for male subjects of different age. A strong VAT volume increase with age was observed in males.
B) Distribution of changes in volume of VAT, SAT and LT in different age groups after the LCD. In the cohorts below 35 years, SAT change was consistently higher than VAT change for all slices. In contrast, VAT volume reduction exceeded SAT volume reduction in the middle third for the group of males above 35 years.
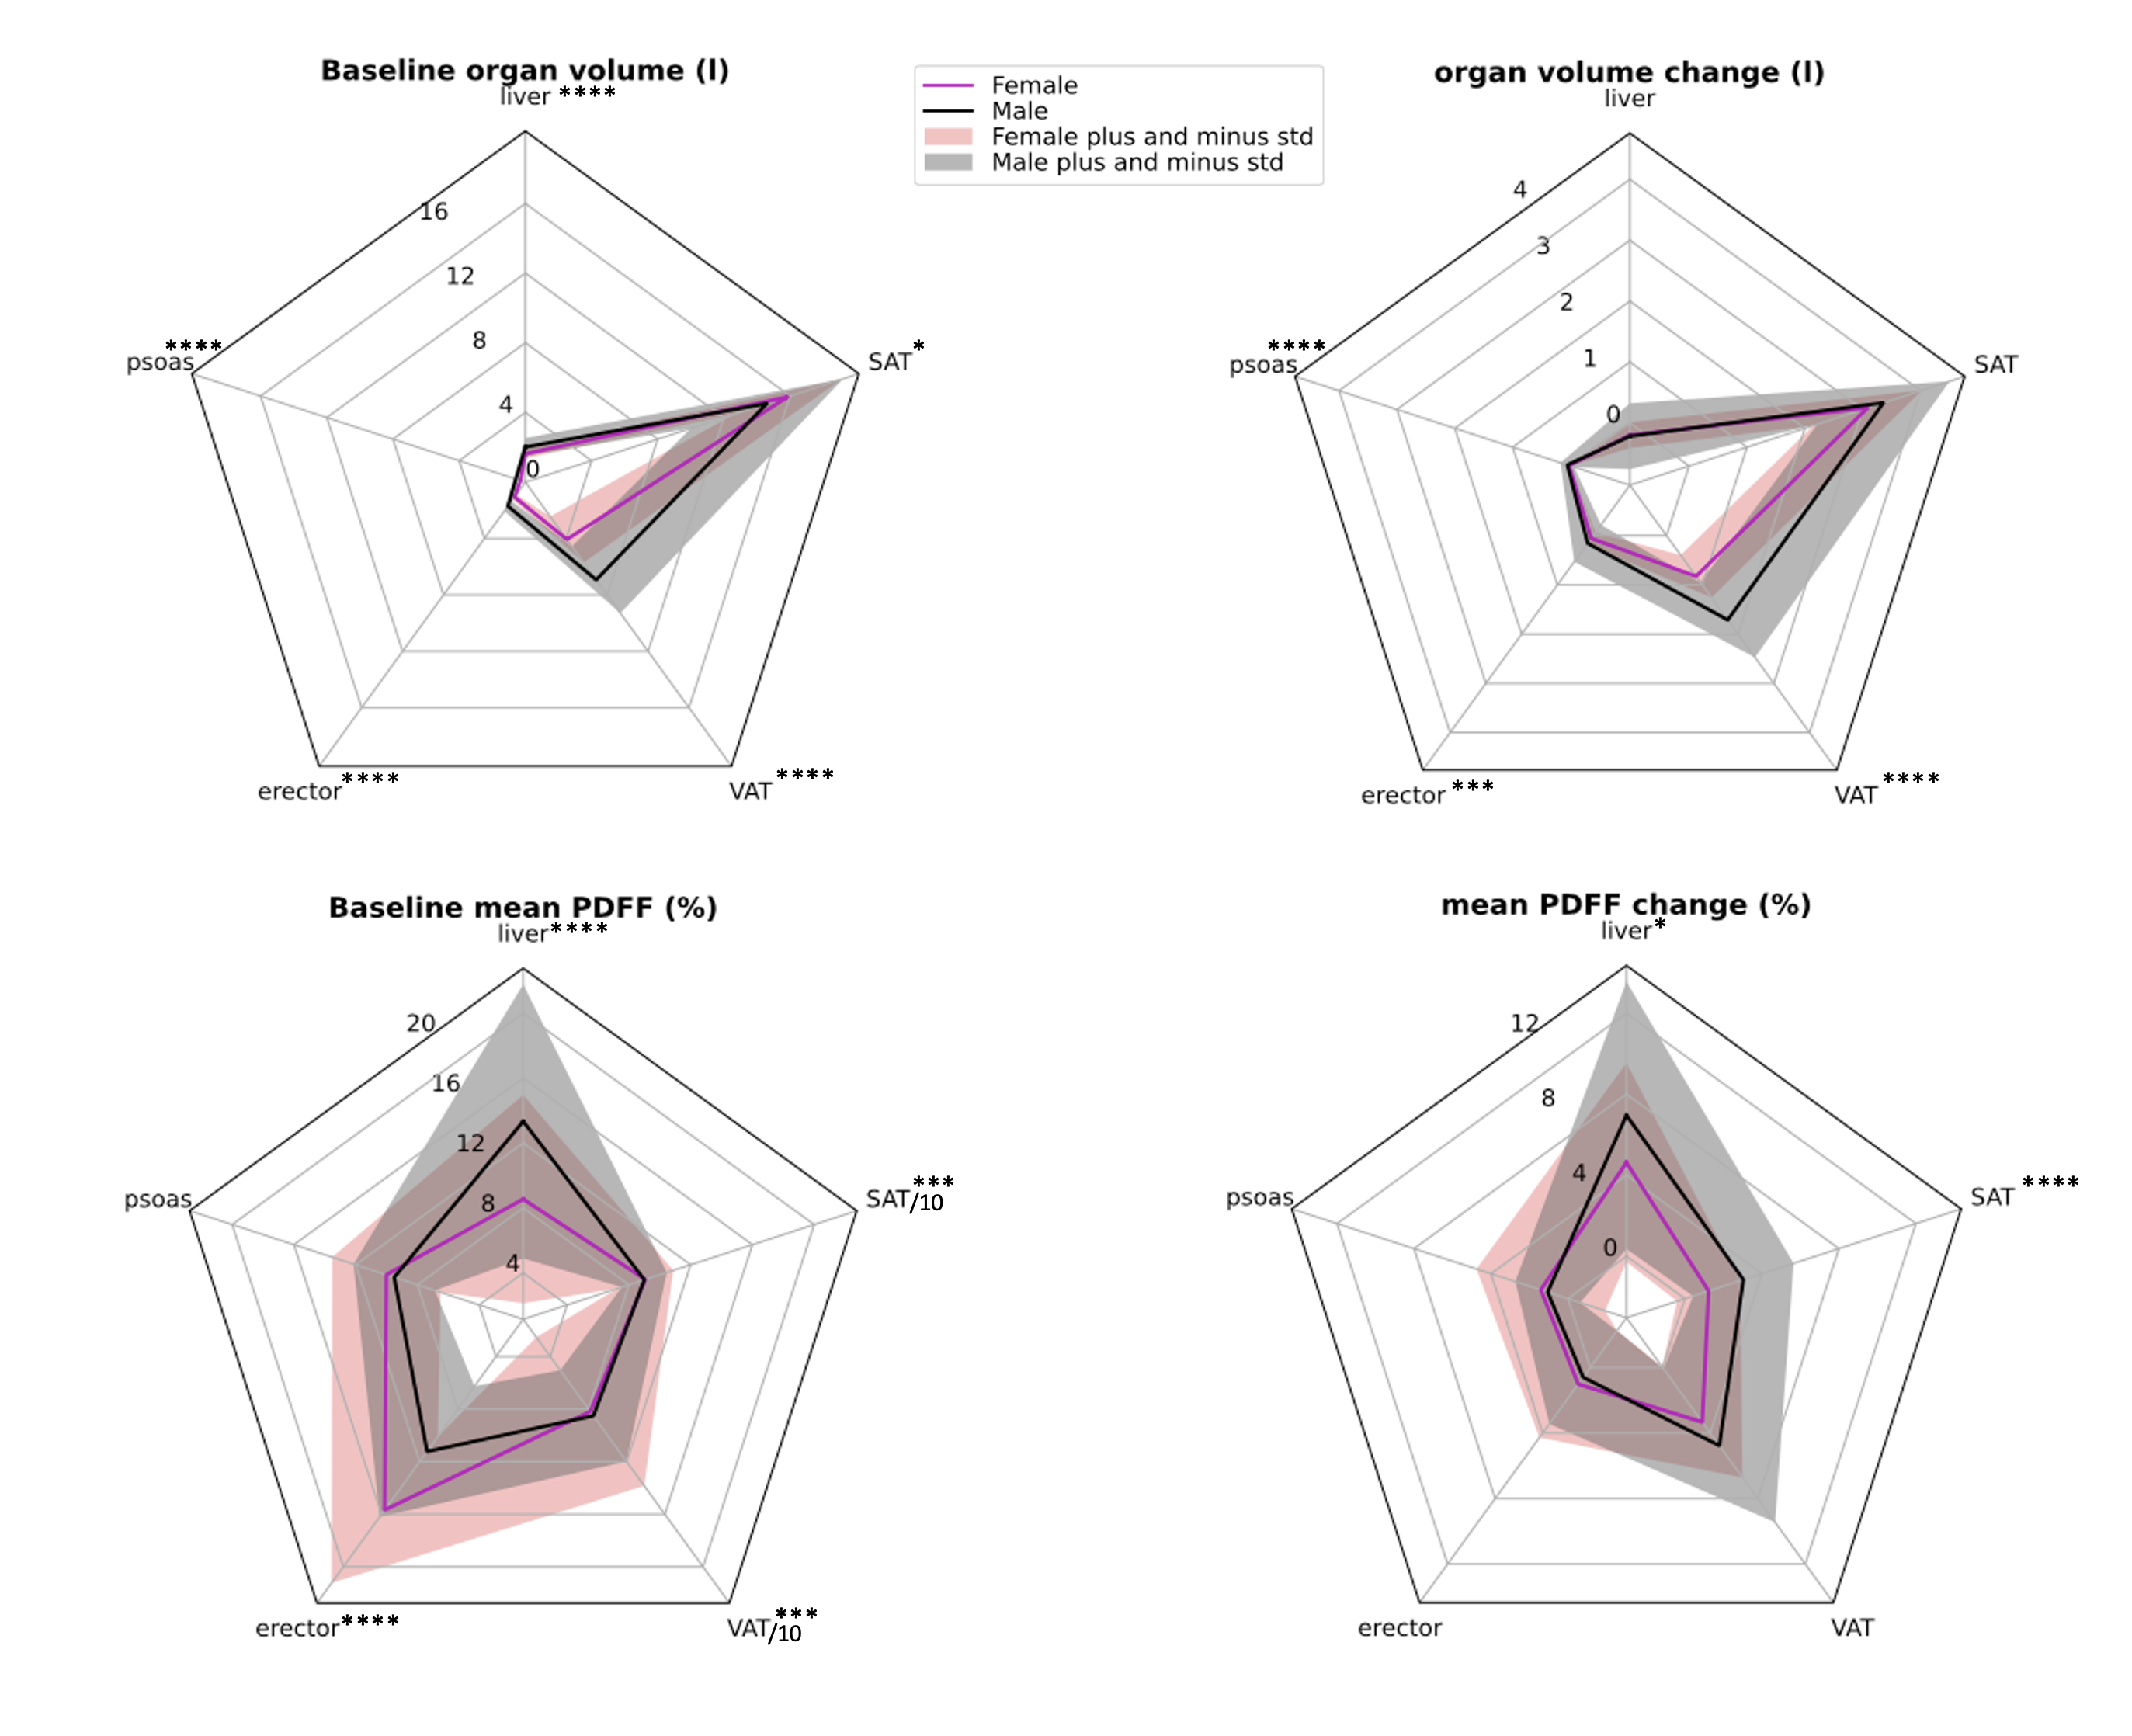
Fig.5 1st row: Radar plots of total volume per organ at baseline, and organ volume change after diet. SAT volume loss was the largest contributor to weight loss. VAT volume was larger in the male cohort at baseline. VAT was also more mobilized in men during LCD.
2nd row: Mean PDFF per organ at baseline, and PDFF change after LCD. Mean SAT and VAT value was divided by 10 for better visualization. Baseline liver PDFF was higher in males, and the erector muscle had much higher PDFF values in females. PDFF change was higher in males for liver, and SAT. *:p < 0.05, **:p < 0.01, ***:p < 0.001, ****:p<0.0001