0952
FOD-Net 2.0: End-to-end FOD enhancement for low angular diffusion acquisitions using deep learning1School of Computer Science, University of Sydney, Sydney, Australia, 2Brain and Mind Centre, University of Sydney, Sydney, Australia, 3Sydney Neuroimaging Analysis Centre, University of Sydney, Sydney, Australia
Synopsis
Keywords: Brain Connectivity, Tractography & Fibre Modelling, Fiber Orientation Distribution
Modern structural brain connectome pipelines and tractography techniques heavily rely on the quality of the diffusion weighted image acquisition (angular resolution) and the subsequent estimation of the fiber orientation distributions (FODs) for each voxel. Generating reliable connectomes from low angular single-shell acquisitions in clinical scenarios remains a challenging task. This work presents an end-to-end deep learning framework to enhance FOD estimates according to multi-shell acquisitions from low angular single-shell acquisitions to guarantee high quality tractography and connectomes within acceptable time and resources.Introduction
Diffusion MRI (dMRI) techniques can map structural brain connectivity non-invasively with the construction of structural connectome matrices1,2, whose reliability is heavily dependent on the quality of the acquisition and the subsequent estimation of the fiber orientation distributions (FODs). Through constrained spherical deconvolution (CSD)3-5, high quality FOD estimates for complex fiber bundle configurations can be reliably computed within each voxel from multi-shell acquisitions of high angular resolution diffusion imaging (HARDI), yielding state-of-the-art tractography6. However, the availability of multi-shell HARDI data is constrained by protocol limitations and the acquisition time required in clinical studies. Therefore, single-shell low angular resolution diffusion imaging (LARDI) is commonly acquired. Such sequences cannot capture necessary information on complex fiber structures yielding to potentially misleading connections for structural connectomes7. A previous work on FOD enhancement for LARDI acquisitions focused on feeding patches cropped at each voxel to predict a single FOD estimate. Despite its promising results, FOD-Net requires training for several weeks to converge to satisfactory results. Furthermore, due to the voxel-wise nature of the predictions, inference can take hours for a single subject. Our work presents an end-to-end solution to mitigate time-consuming voxel-wise predictions by predicting the whole patch directly, thus making the solution more practical applicable. We evaluated our method on a Human Connectome Project (HCP) dataset9 and an in-house clinical dataset with FOD, fixel-based and connectomic metrics to thoroughly analyze the impact of our enhancement approach.Methods
100 samples (50 training, 50 testing) from the HCP dataset were selected as ground truth from the HCP dataset, which were then subsampled to emulate LARDI data8. The in-house dataset contained 97 samples of 3 different clinical groups: 39 amyotrophic lateral sclerosis (ALS) subjects, 20 healthy controls, and 39 subjects with other motor neurone disorders. Figure 1a summarizes the preprocessing and connectome generation pipeline (using MRtrix311). The FODs were computed using the single-shell three-tissue (SS3T)12 CSD and multi-shell multi-tissue (MSMT)3 CSD routines, respectively, to obtain 45 spherical harmonic coefficients regardless of the gradient directions. We cropped and z-score normalized input patches of 64 x 64 x 64 x 45 with a sliding window of stride 32.Our network (Figure 1b) consists of a shared feature encoder and five order-wise decoders. The encoder adopts gated convolutions as the building blocks10 (Figure 1c) to learn and highlight semantic features at different resolution levels. To analyze the dependencies between lower order coefficients and higher order ones13, each decoder was implemented with channel attention14. The model was trained with MSE loss and Adam optimizer for 50 epochs on the HCP data only. We also tested the HCP trained model on the clinical dataset.
Results
The angular correlation coefficient (ACC)15 was used to estimate the accuracy of the FOD predictions in pure white matter (WM) and partial volume voxels with grey matter (GM)8. Table 2a shows that our method obtains the best mean ACC 0.9293 approximated on the HCP dataset. Furthermore, our analysis on all the groups (ALS, HC, other) on the clinical dataset (Table 2b) demonstrates that our method is robust on both healthy subjects and patients from an unseen protocol during training.To study fixel based metrics, we defined 3 regions of interest (ROIs) with different numbers of crossing fibers (1, 2 and 3) to analyze the mean angular error (MAE) of the fibers (important for tractography)8. Table 3 shows our method attains the minimum MAE in all ROIs on HCP, and ROI 1 and 2 on the private clinical dataset.
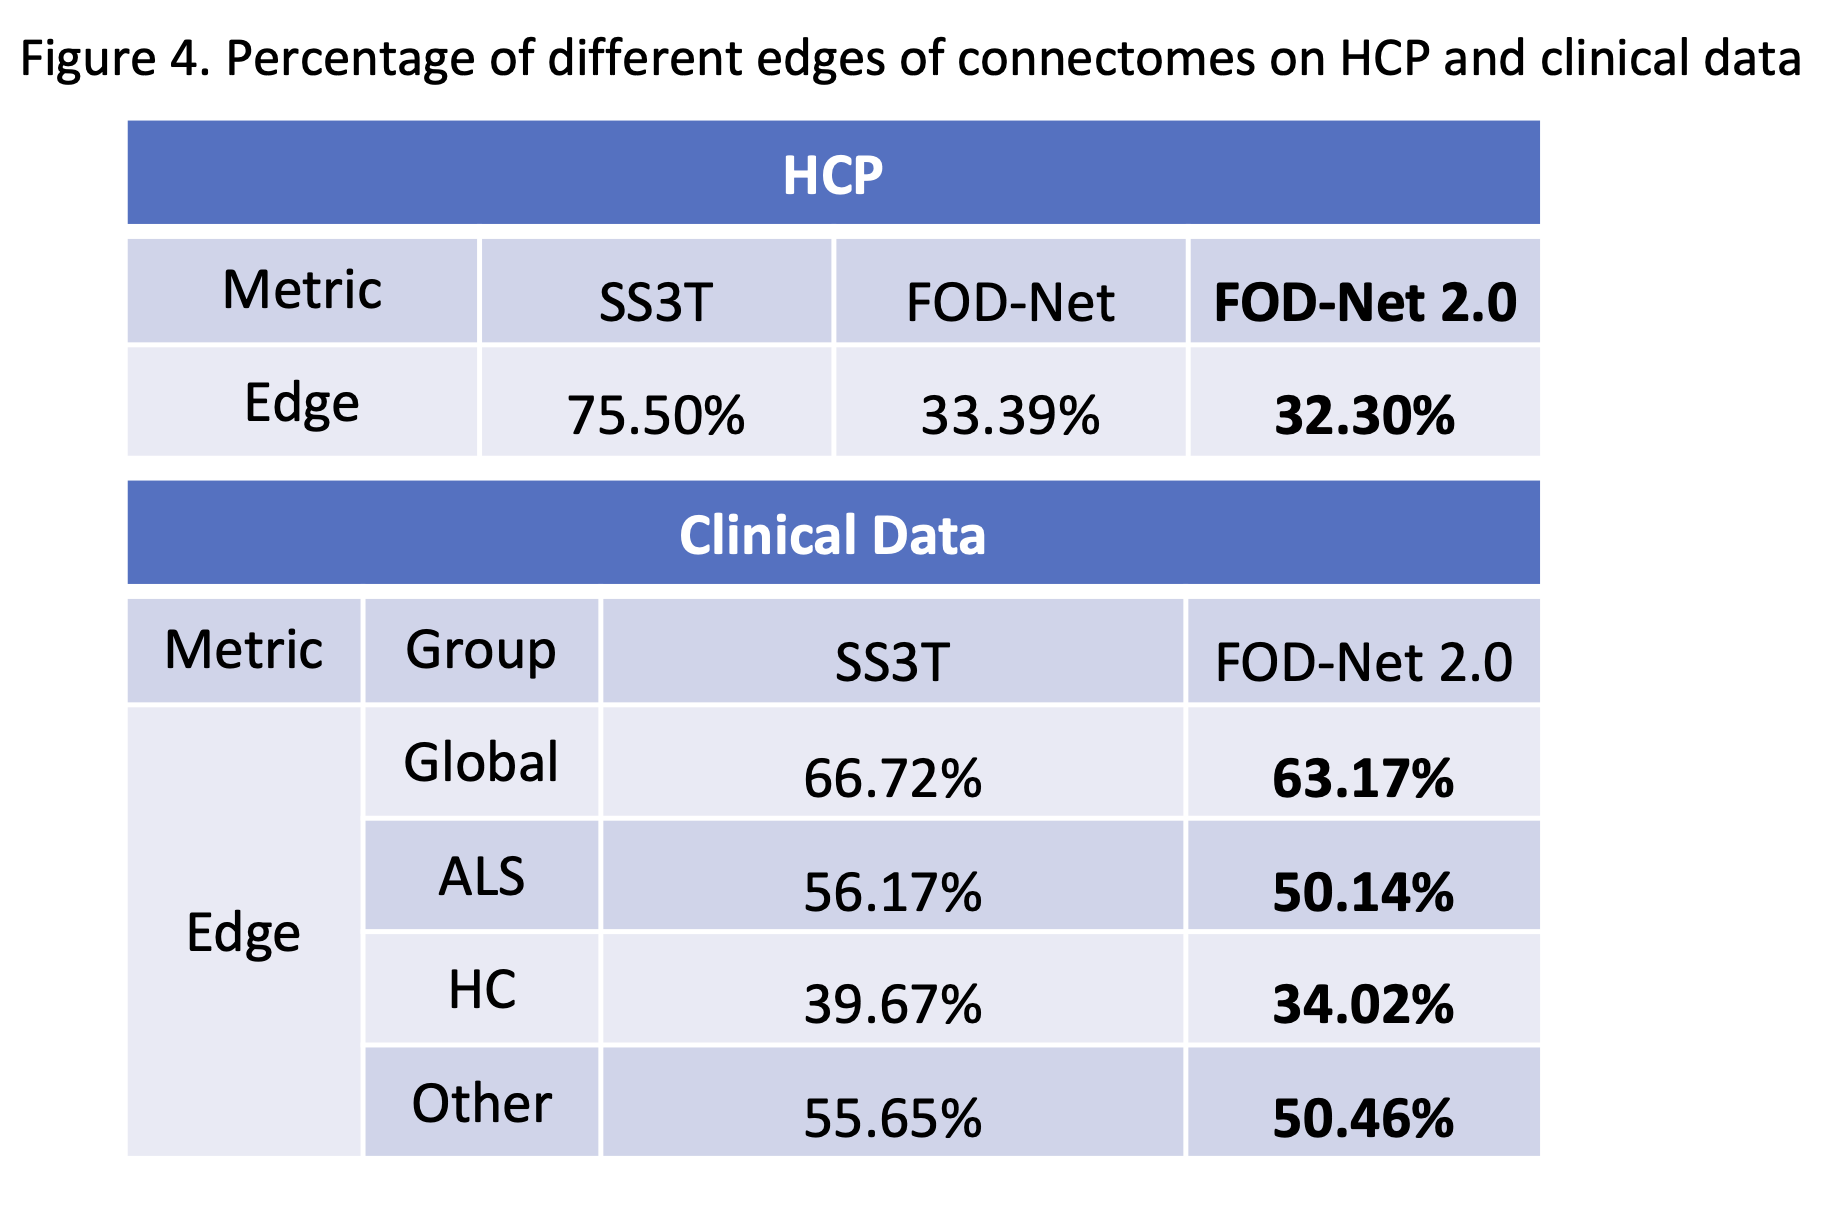
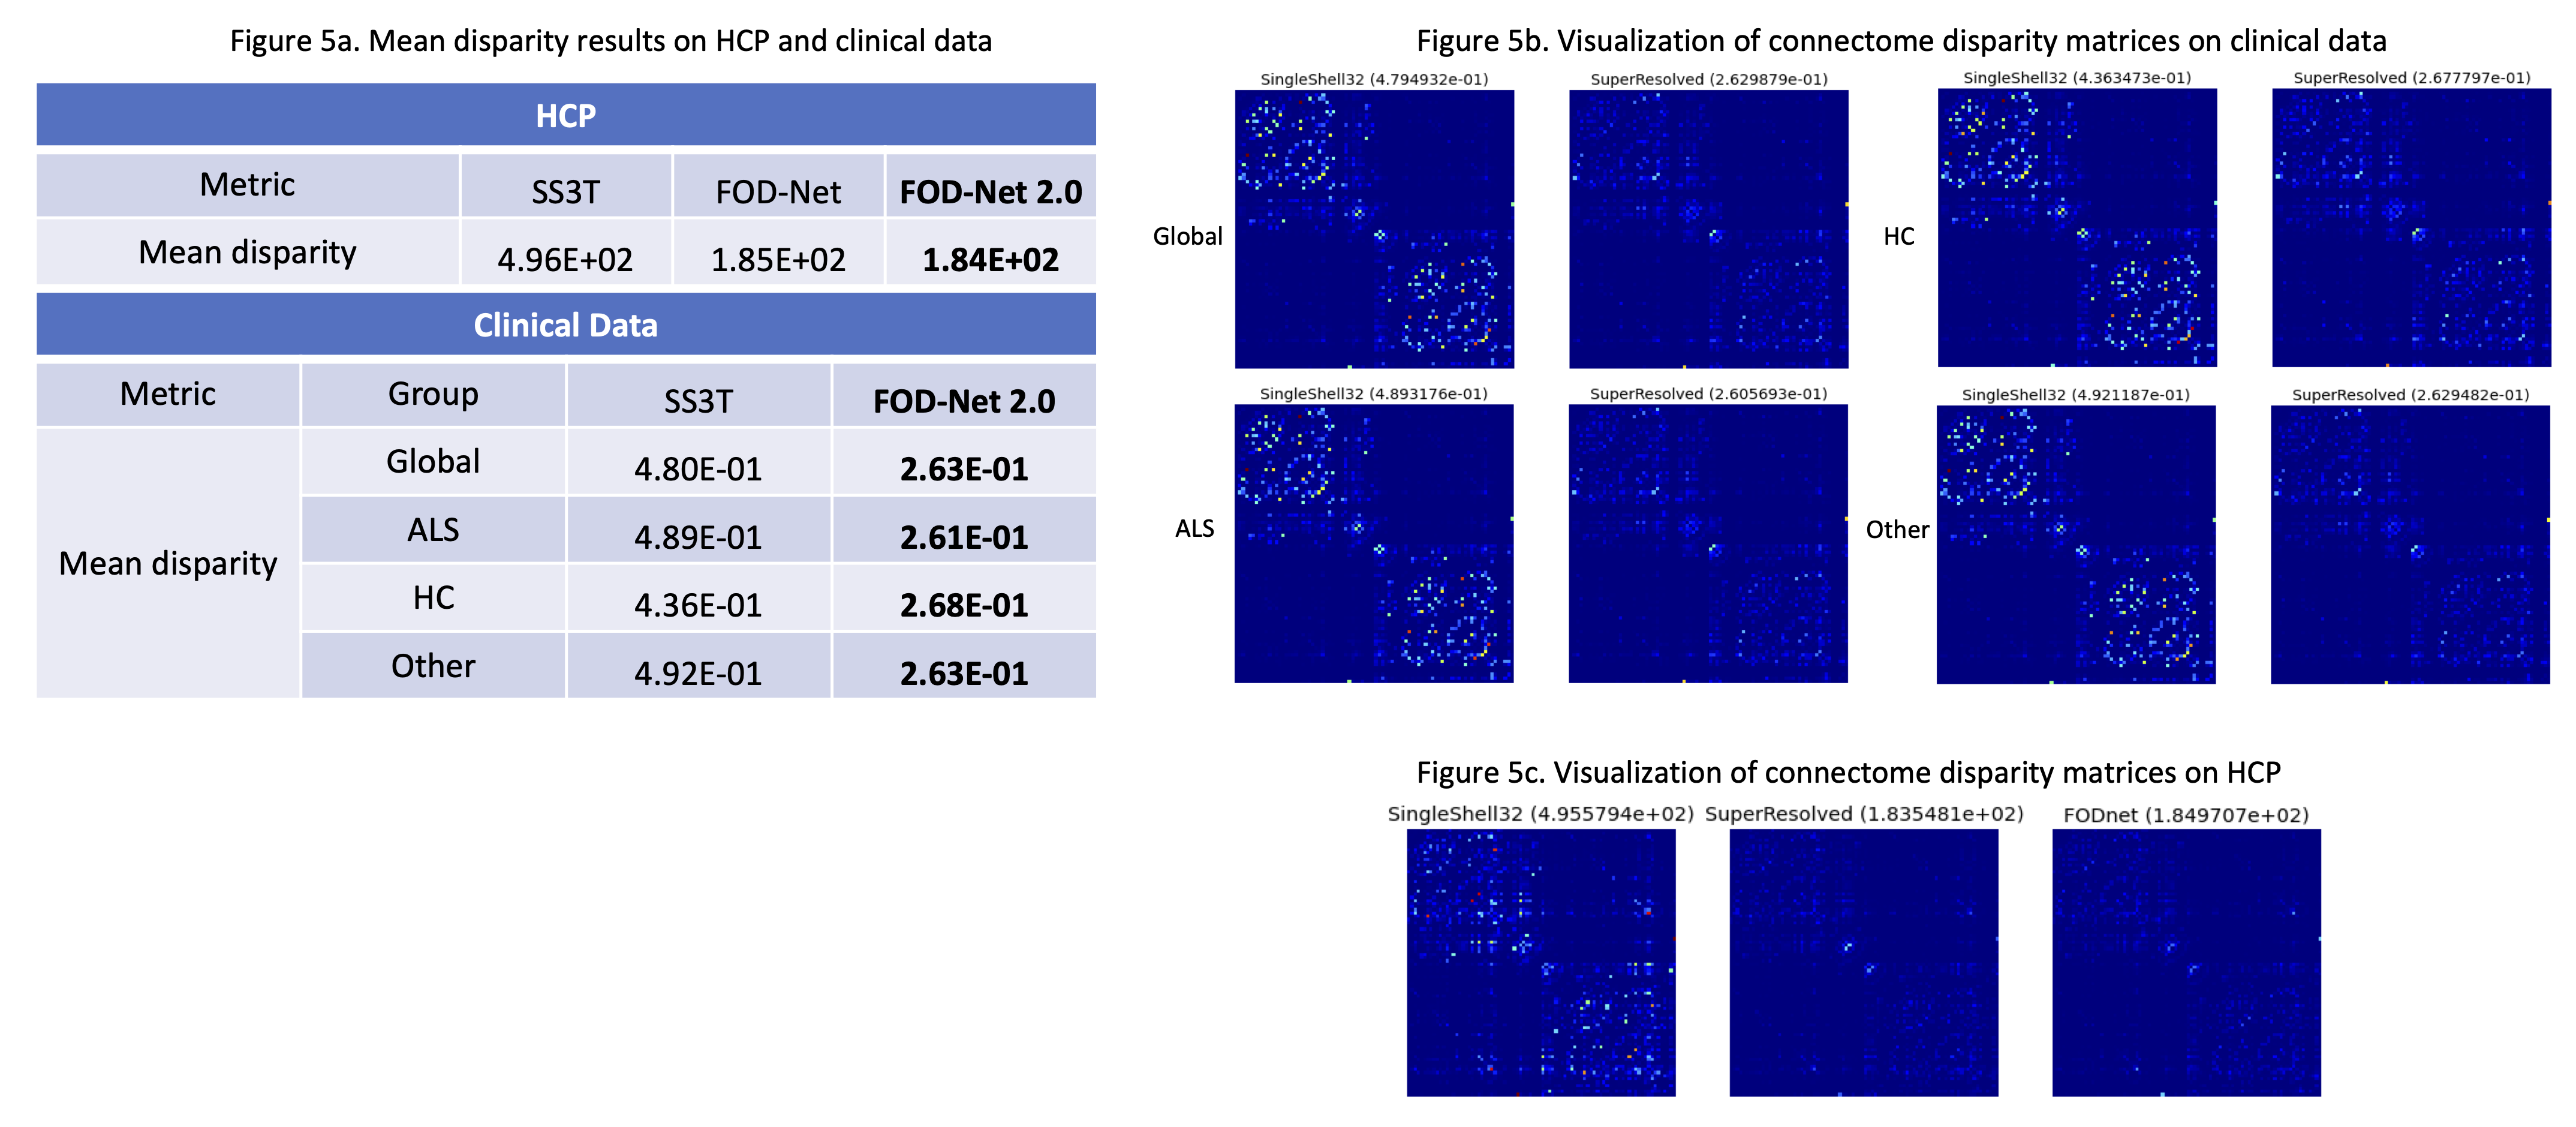
Finally, to measure the accuracy of the reconstructed connectomes when compared to the reference multi-shell data, we computed the percentage of different edges (%) according to the t-test between methods using a false discovery rate (FDR) correction for multiple comparisons8. Our model decreases the number of significantly different edges by 40% on the HCP dataset (Figure 4). However, that improvement drastically decreases, although still significant, to less than 10% for all groups on the clinical dataset due to the differences in acquisition protocol. To further study the connectome differences, connectome disparity matrices (Figure 5) were computed between the predicted connectomes and the multi-shell ones8. It can be observed qualitatively and quantitatively that our model generated the connectome with the lowest disparity, outperforming the single-shell estimates on both the HCP and private dataset (almost by half in terms of mean disparity).
Discussion
Our method can accurately enhance FOD from clinical single-shell acquisitions with a limited number of directions (directions = 32). The method can generalize to unseen protocols. Moreover, we significantly reduced training and testing time (2 days and a few minutes, respectively) when compared to FOD-Net (2 weeks and 2-3 hours, respectively). Interestingly, some metrics of HC were slightly better than that of patient data especially for SS3T methods, which suggests that the variability on patient brains may not be properly captured by LARDI data and should be further studied.Conclusion
We present an end-to-end deep learning framework to enhance FOD from LARDI acquisitions that accurately sifts spurious fibers and recovers missing fiber tracks. The method is robust in reconstructing high-quality tractography and connectome and it generalizes to unseen protocols with data from different clinical groups.Acknowledgements
The authors acknowledge the funding support by the Australia Medical Research Future Fund under Grant (MRFFAI000085).References
[1] Alexander, D.C., Zikic, D., Ghosh, A., Tanno, R., Wottschel, V., Zhang, J., Kaden, E., Dyrby, T.B., Sotiropoulos, S.N., Zhang, H., et al., 2017. Image quality transfer and applications in diffusion MRI. Neuroimage 152, 283–298.
[2] Tanno, R., Worrall, D.E., Kaden, E., Ghosh, A., Grussu, F., Bizzi, A., Sotiropoulos, S.N., Criminisi, A., Alexander, D.C., 2021. Uncertainty modeling in deep learning for safer neuroimage enhancement: demonstration in diffusion MRI. Neuroimage 225, 117366.
[3] Jeurissen, B., Tournier, J.D., Dhollander, T., Connelly, A., Sijbers, J., 2014. Multi-tissue constrained spherical deconvolution for improved analysis of multi-shell diffusion MRI data. Neuroimage 103, 411–426.
[4] Tournier, J.D., Calamante, F., Connelly, A., 2007. Robust determination of the fiber orientation distribution in diffusion MRI: non-negativity constrained super-resolved spherical deconvolution. Neuroimage 35, 1459–1472.
[5] Tournier, J.D., Calamante, F., Gadian, D.G., Connelly, A., 2004. Direct estimation of the fiber orientation density function from diffusion-weighted MRI data using spherical deconvolution. Neuroimage 23, 1176–1185.
[6] Dell’Acqua, F., Tournier, J.D., 2019. Modeling white matter with spherical deconvolution: how and why? NMR Biomed. 32, e3945.
[7] Farquharson, S., Tournier, J.D., Calamante, F., Fabinyi, G., Schneider-Kolsky, M., Jackson, G.D., Connelly, A., 2013. White matter fiber tractography: why we need to move beyond DTI. Journal of neurosurgery 118, 1367–1377.
[8] Zeng, R., Lv, J., Wang, H., Zhou, L., Barnett, M., Calamante, F., Wang, C., 2022. FOD-Net: A deep learning method for fiber orientation distribution angular super resolution. Medical Image Analysis 79,102431.
[9] Van Essen, D.C., Smith, S.M., Barch, D.M., Behrens, T.E., Yacoub, E., Ugurbil, K., Consortium, W.M.H., et al., 2013. The WU-minn human connectome project: an overview. Neuroimage 80, 62–79.
[10] Yu, J., Lin, Z., Yang, J., Shen, X., Lu, X., Huang, T.S., 2019. Free-form image inpainting with gated convolution. In: Proceedings of the IEEE International Conference on Computer Vision (ICCV). pp. 4471–4480.
[11] Tournier, J.D., Smith, R., Raffelt, D., Tabbara, R., Dhollander, T., Pietsch, M., Christiaens, D., Jeurissen, B., Yeh, C.H., Connelly, A., 2019. MRtrix3: a fast, flexible and open software framework for medical image processing and visualization. Neuroimage 202, 116137.
[12] Khan, W., Egorova, N., Khlif, M.S., Mito, R., Dhollander, T., Brodtmann, A., 2020. Three-tissue compositional analysis reveals in-vivo microstructural heterogeneity of white matter hyperintensities following stroke. Neuroimage 218, 116869.
[13] Breuer, K., Stommel, M., Korte, W., 2019. Analysis and evaluation of fiber orientation reconstruction methods. Journal of Composites Science 3(3), 67.
[14] Hu, J., Shen, L., Sun, G., 2018. Squeeze-and-excitation networks. In: Proceedings of the IEEE Conference on Computer Vision and Pattern Recognition (CVPR). pp. 7132–7141.
[15] Anderson, A.W., 2005. Measurement of fiber orientation distributions using high angular resolution diffusion imaging. Magnetic Resonance in Medicine: An Official Journal of the International Society for Magnetic Resonance in Medicine 54, 1194–1206.
[16] Tournier, J.D., Calamante, F., Connelly A., 2010. Improved probabilistic streamlines tractography by 2nd order integration over fiber orientation distributions. Paper presented at: Proceedings of the international society for magnetic resonance in medicine.
[17] Smith, R.E., Tournier, J.D., Calamante, F., Connelly A., 2015. SIFT2: Enabling dense quantitative assessment of brain white matter connectivity using streamlines tractography. Neuroimage 119, 338-351.
[18] Desikan, R.S., Ségonne, F., Fischl, B., et al. 2006. An automated labeling system for subdividing thehuman cerebral cortex on MRI scans into gyral based regions of interest. NeuroImage 31, 968-980.
Figures
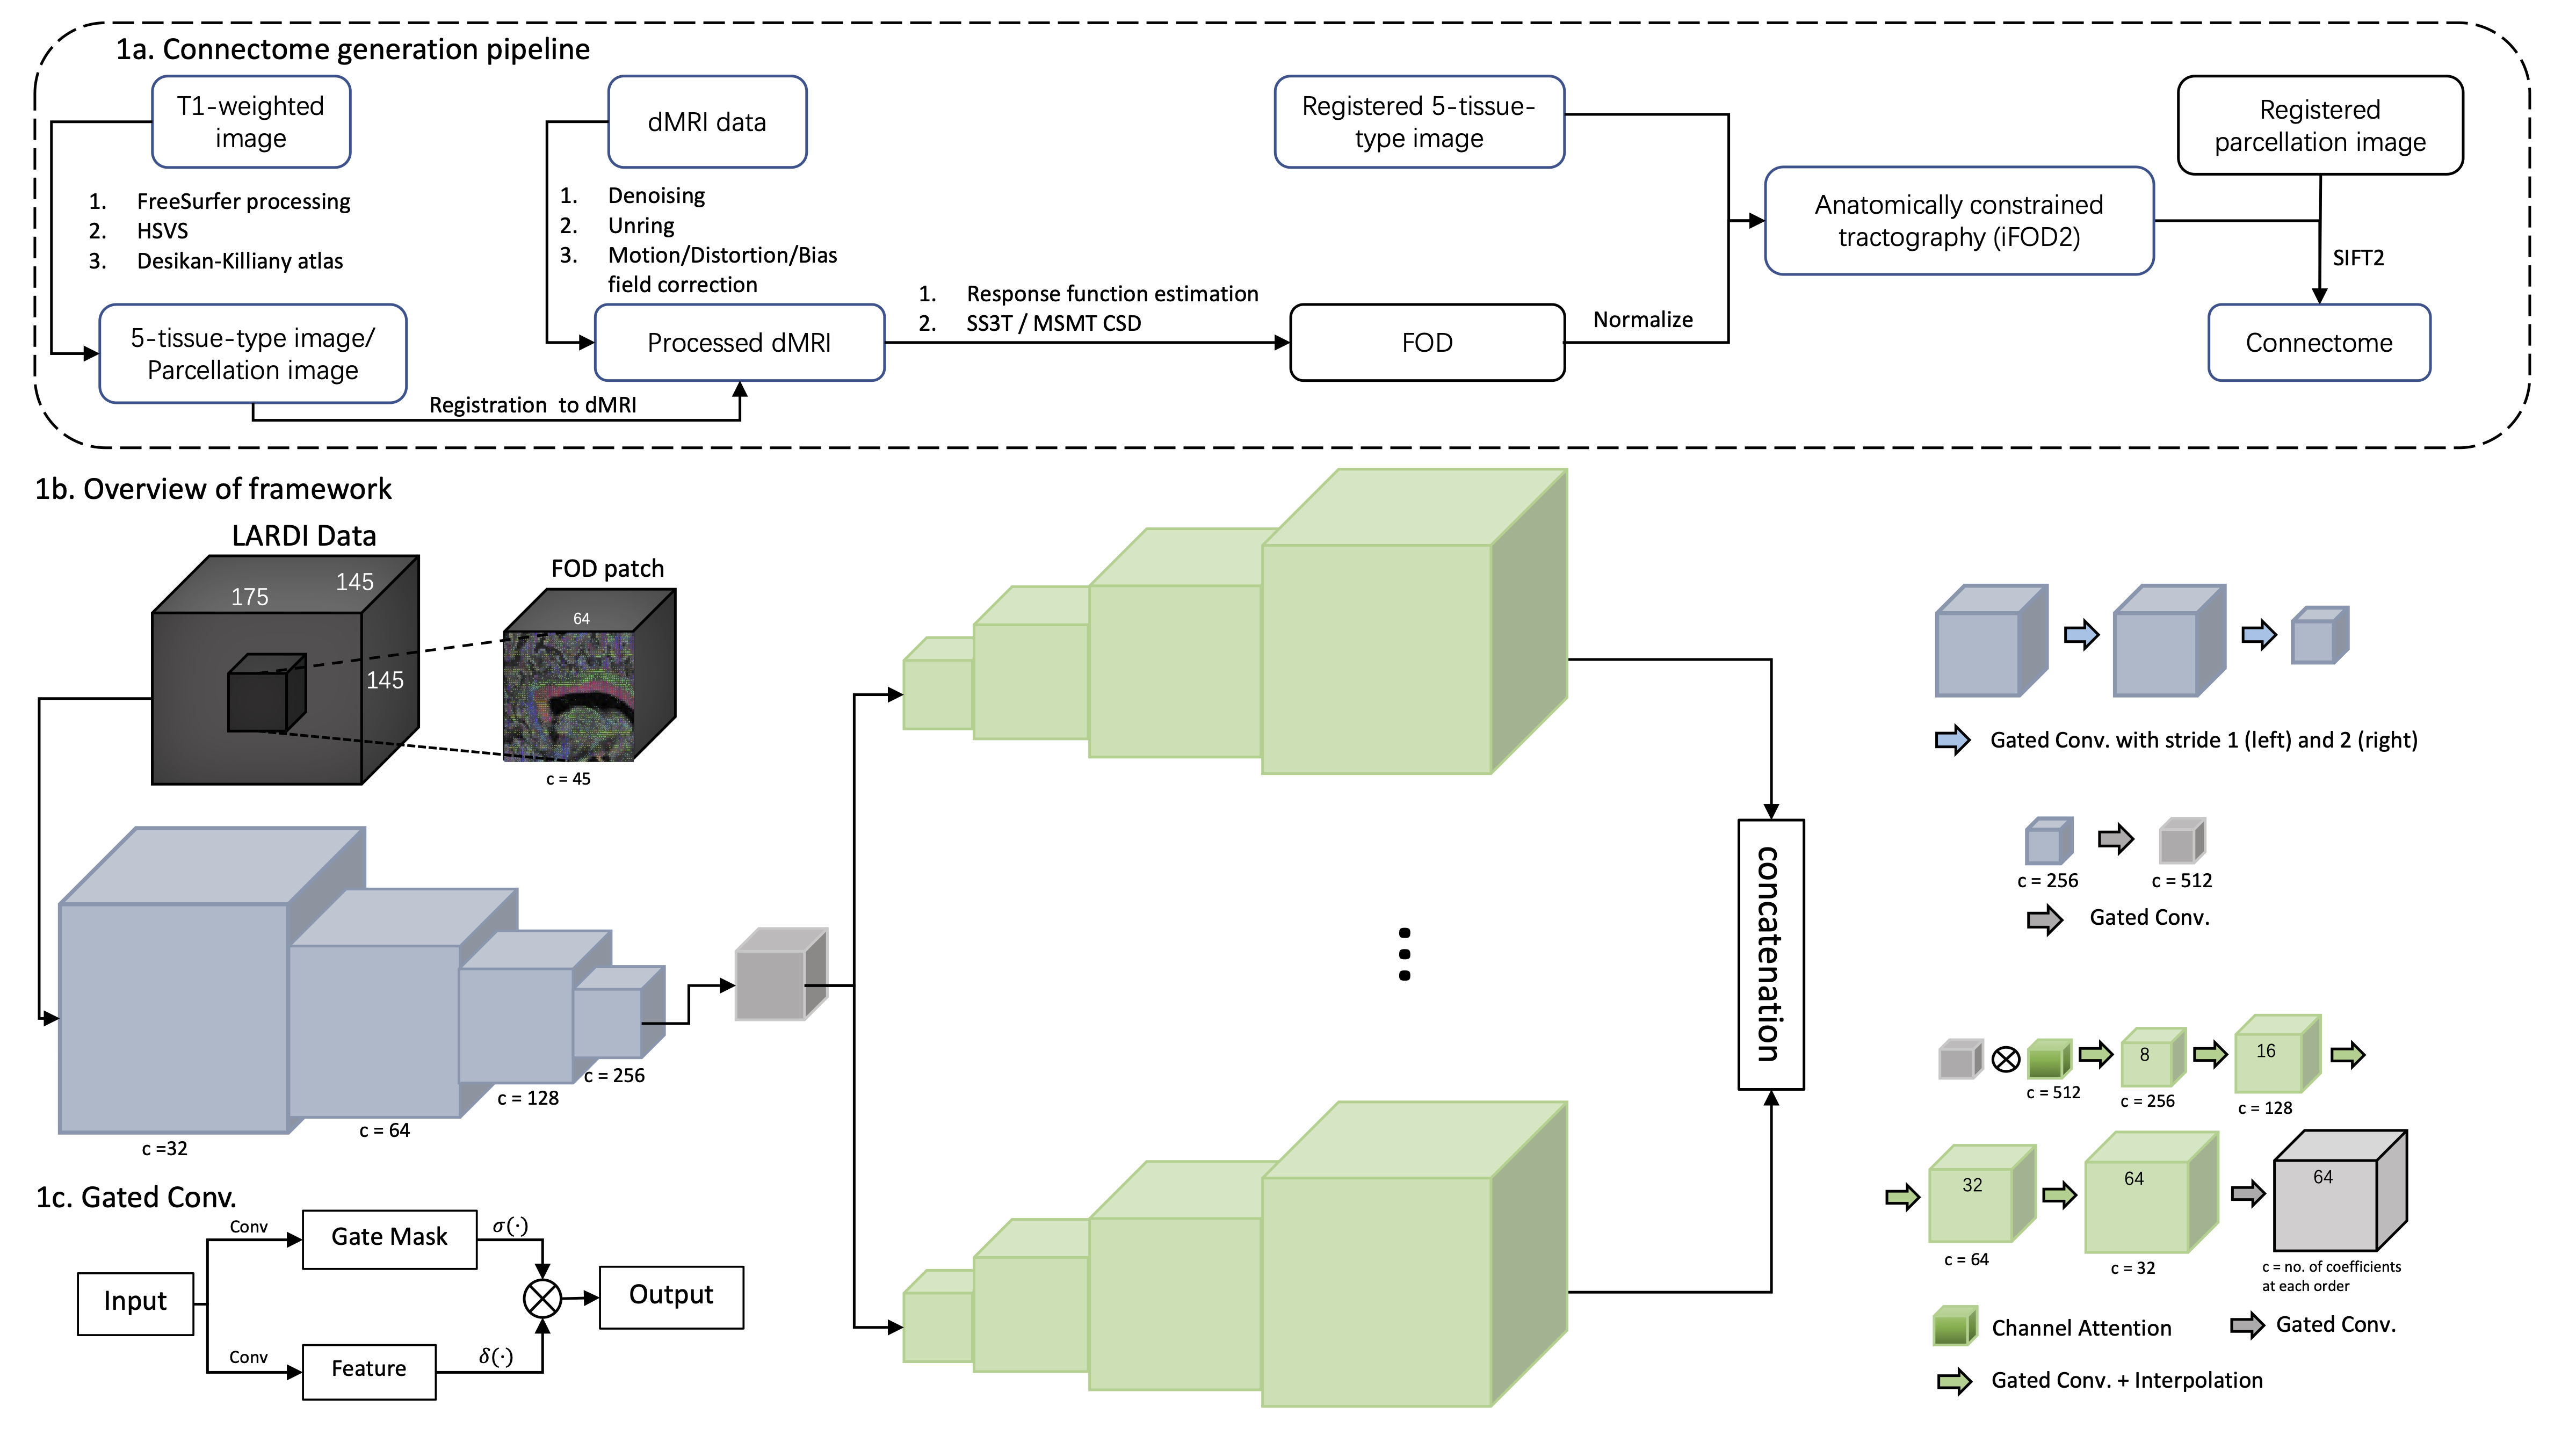
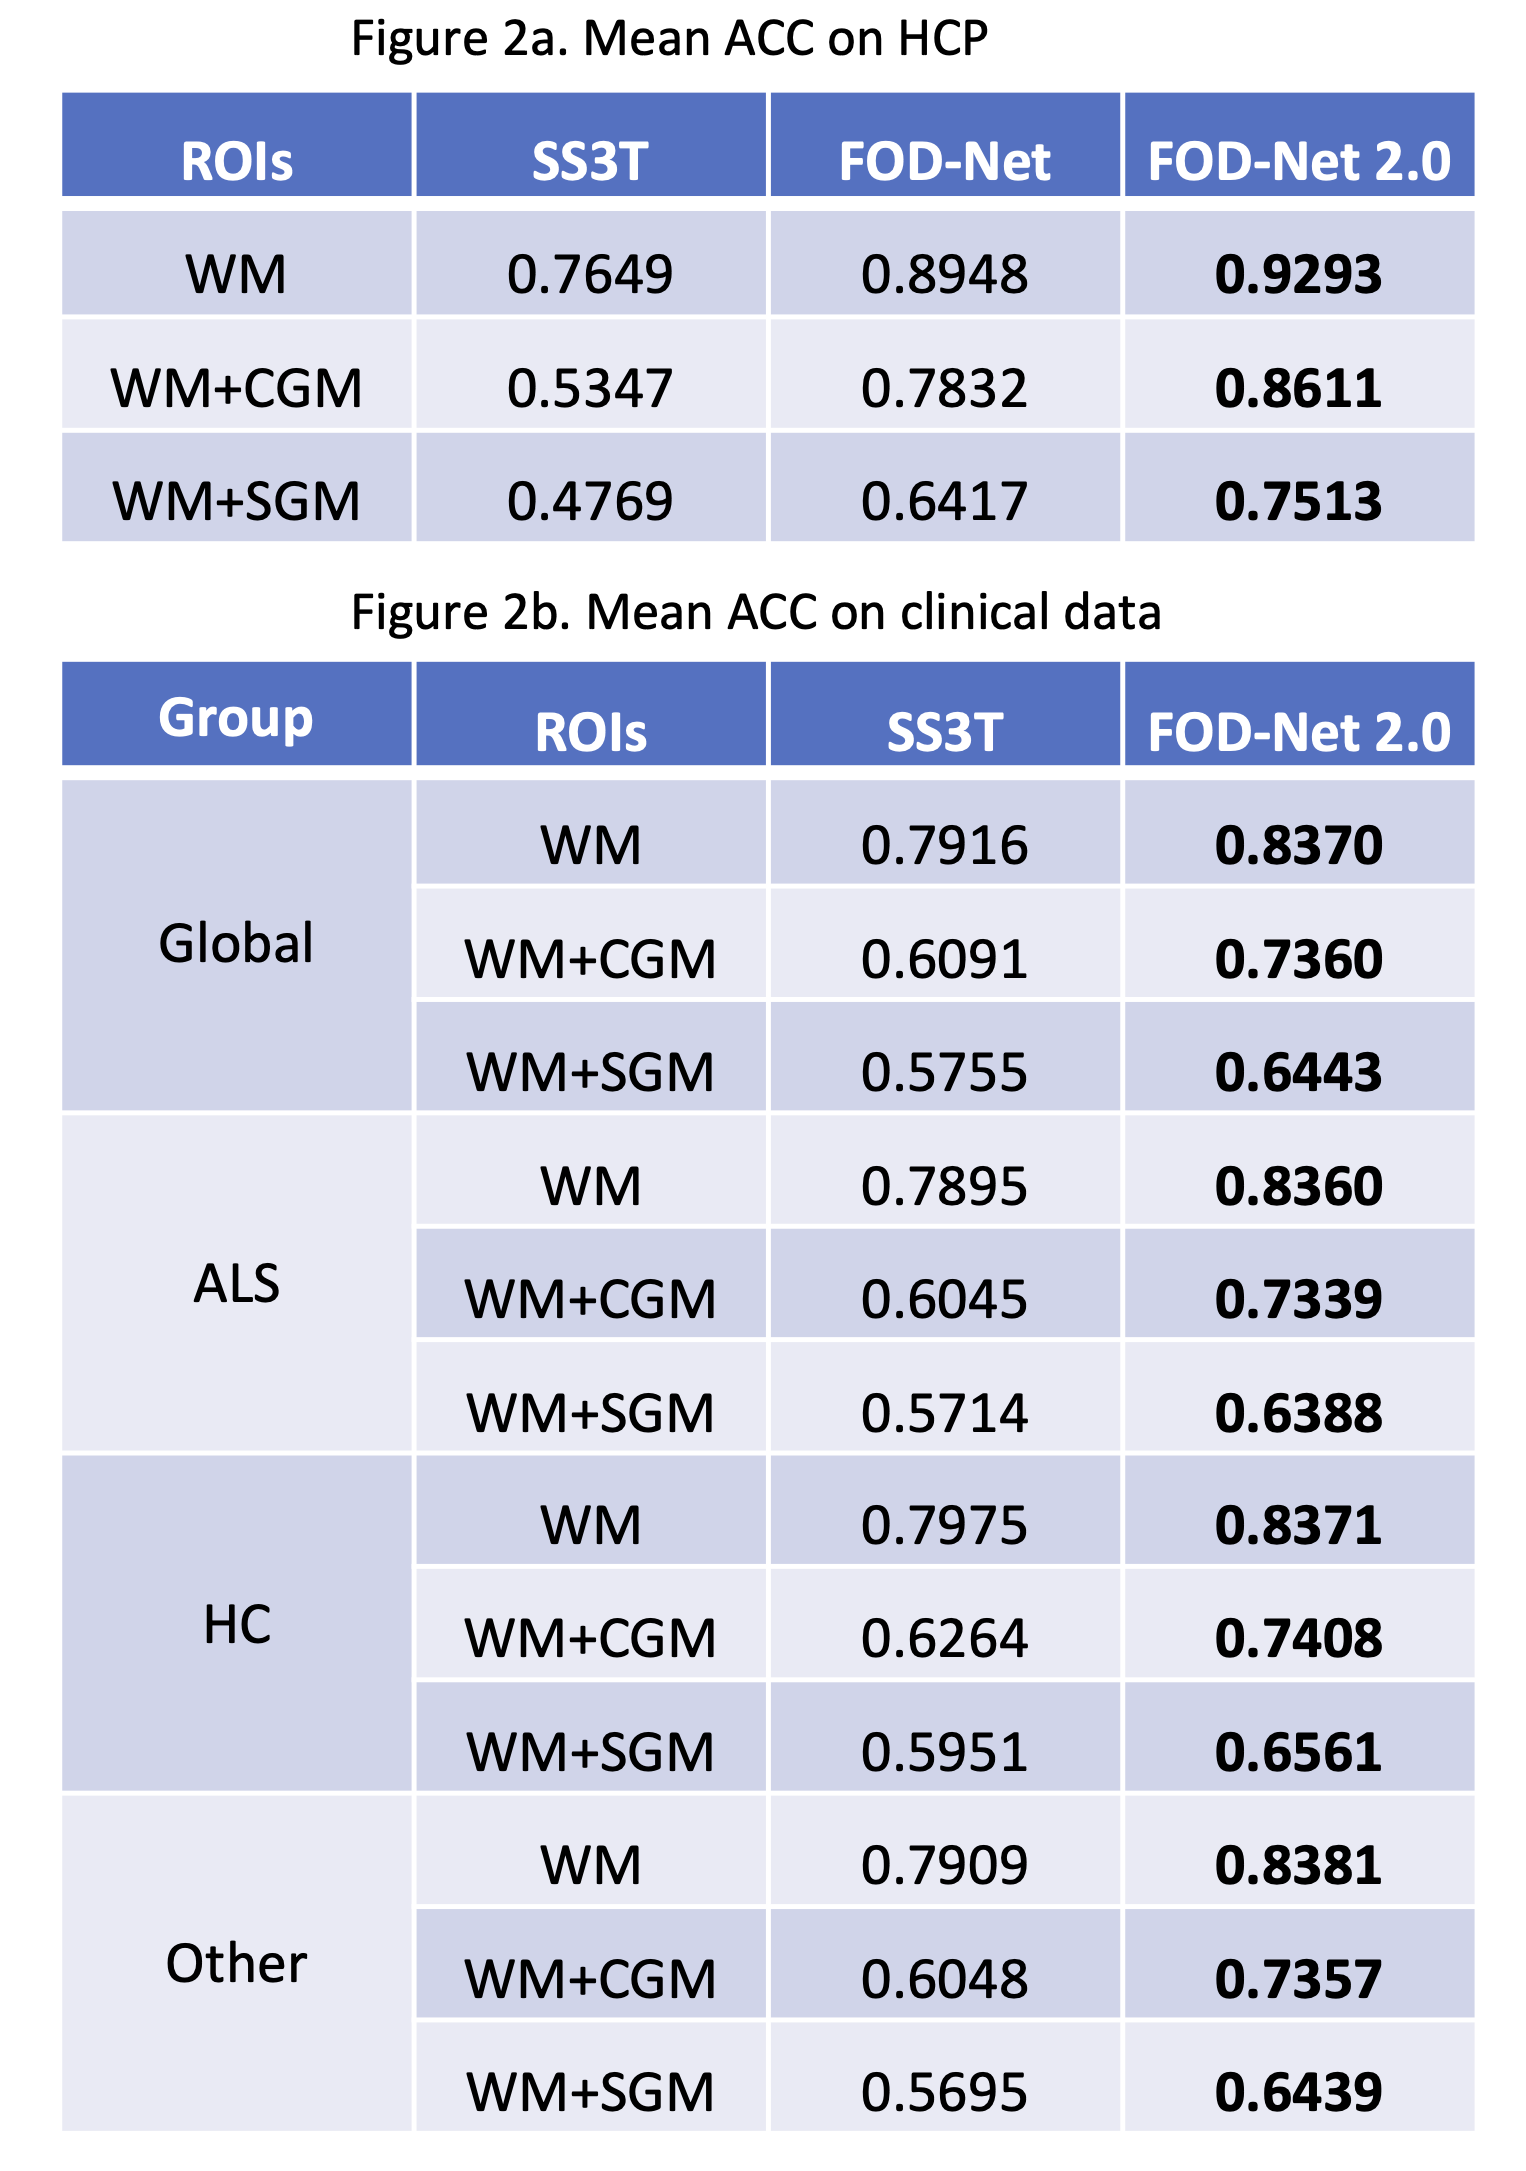
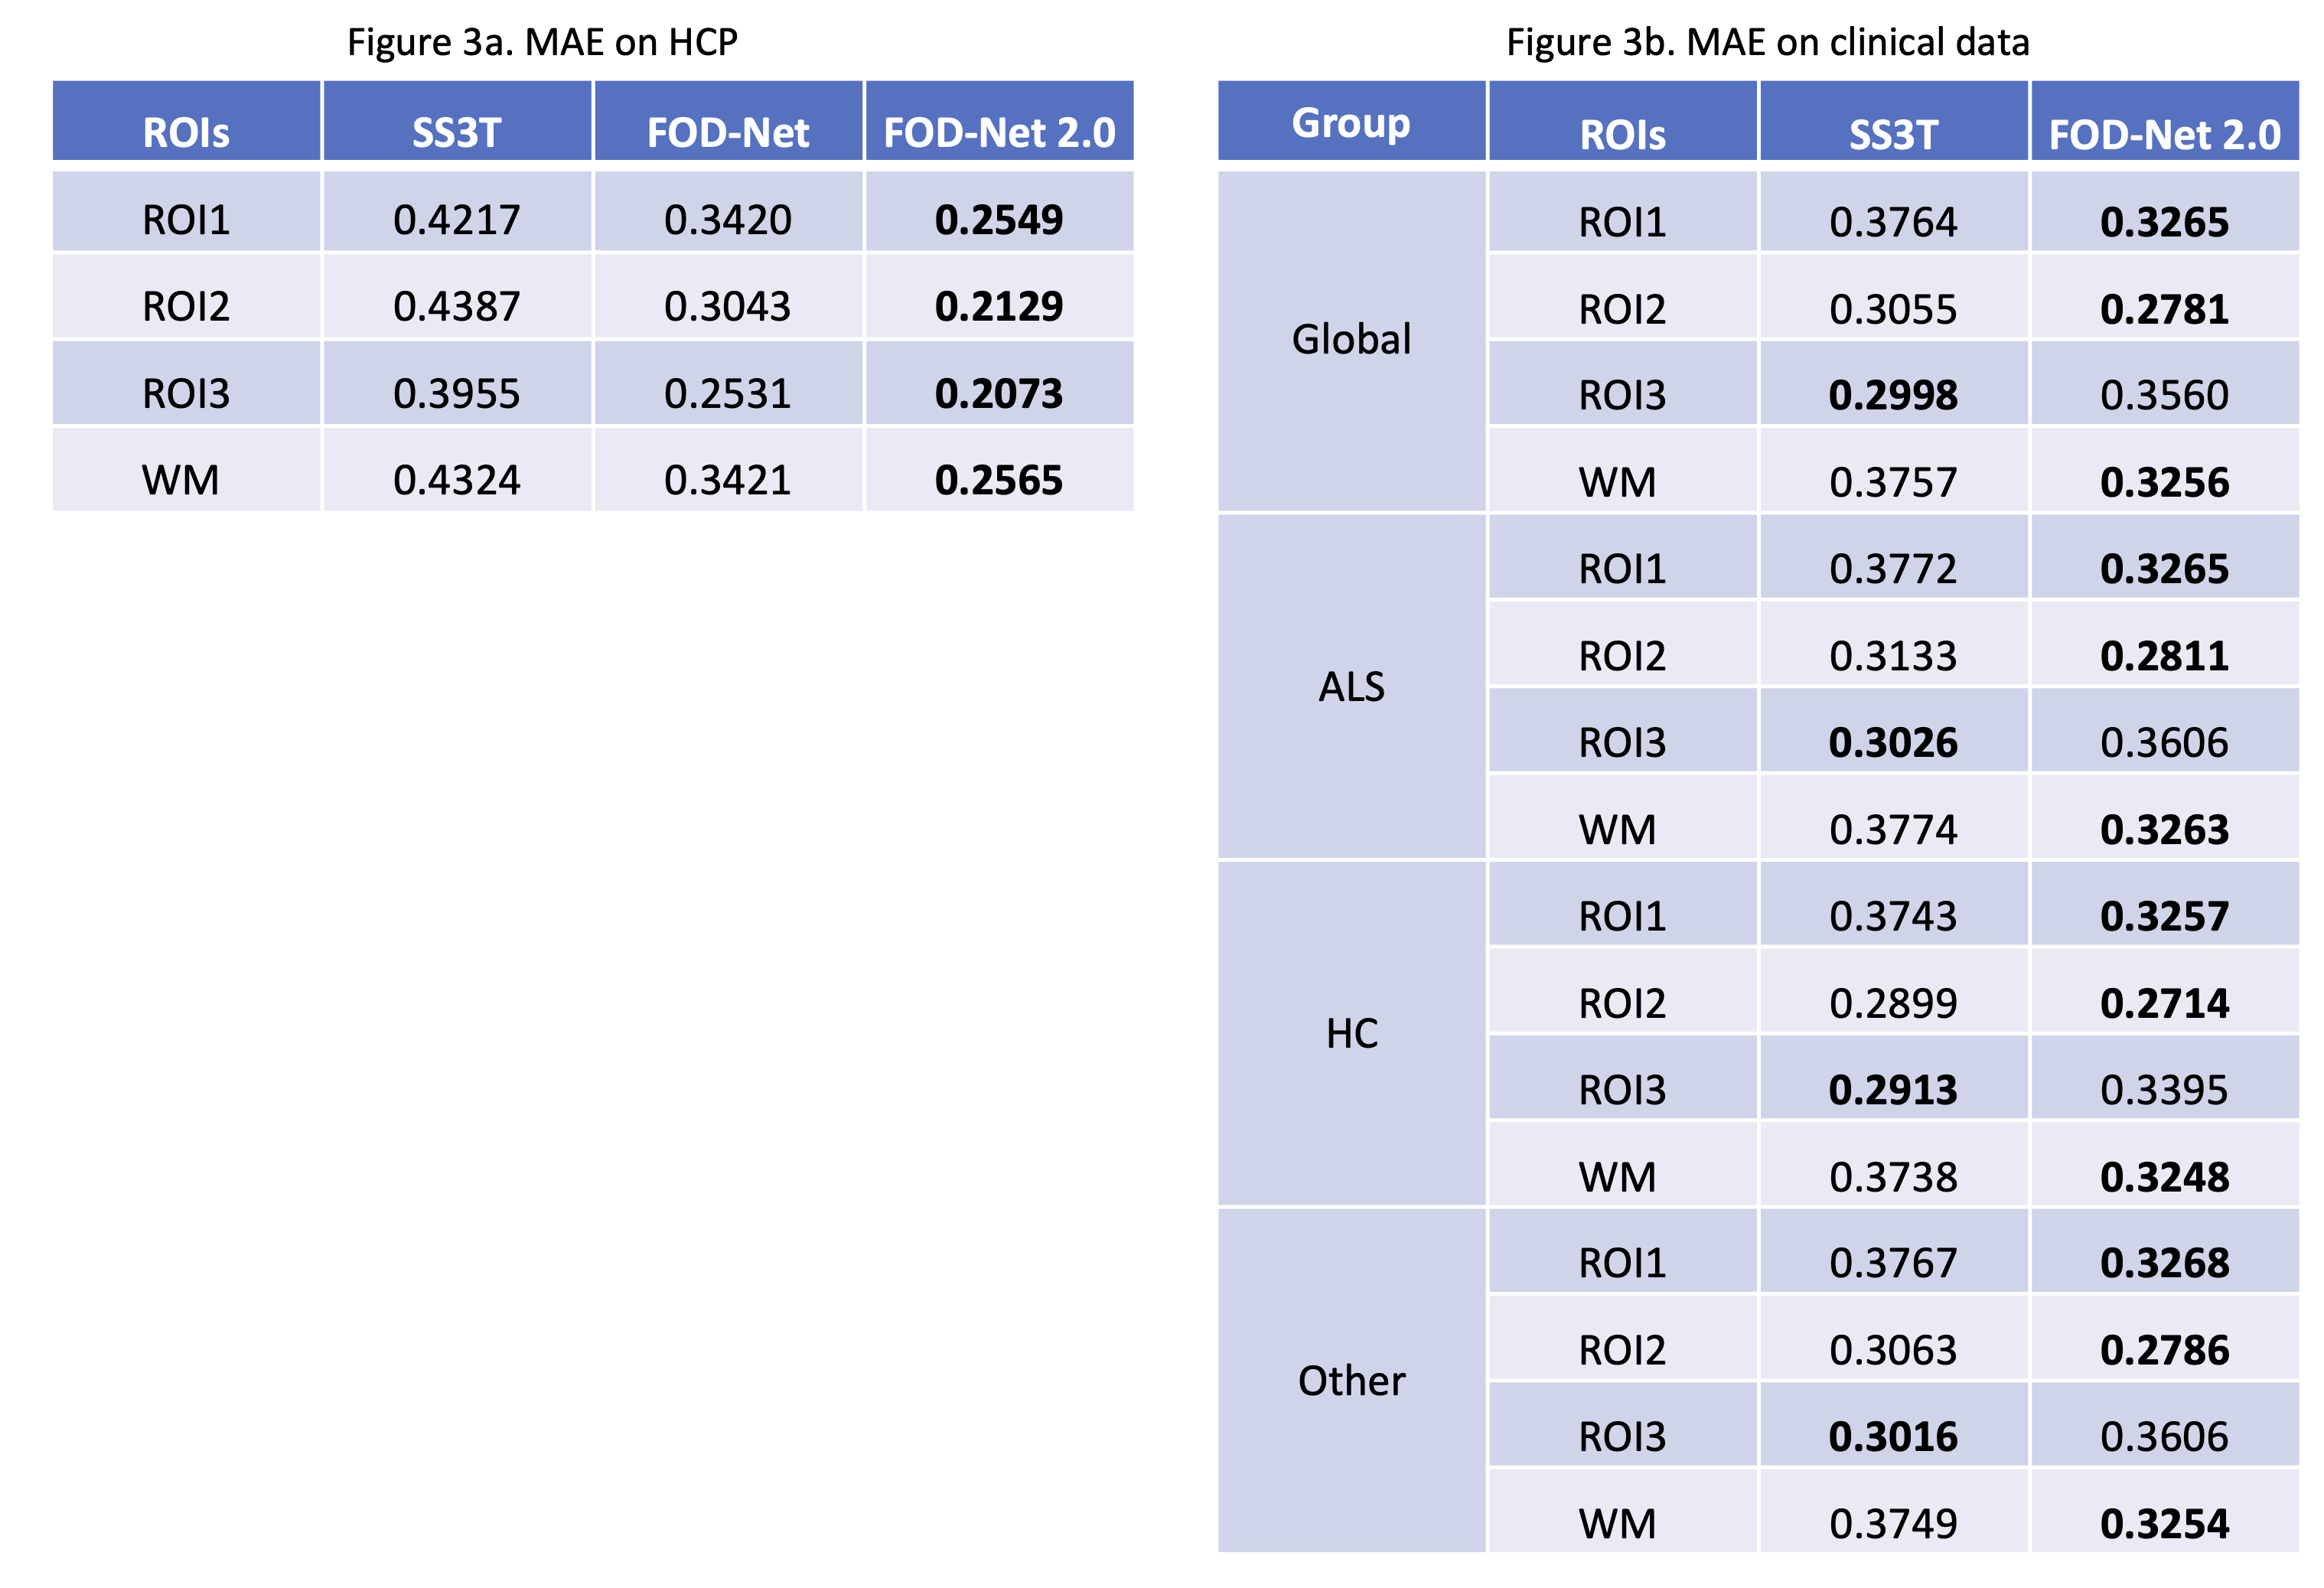
Figure 3a. Mean Angular Error (MAE) of ROIs of different crossing fiber structures and white matter tissue on HCP dataset. FOD-Net 2.0 outperforms other methods in all ROIs on HCP. 3b. MAE of ROIs on in-house clinical data between different clinical groups. FOD-Net 2.0 outperforms other methods in ROI1,2 and pure white matter tissue on clinical data.