0949
Impact of image resolution on brain stiffness estimation using neural network inversion1Mayo Clinic, Rochester, MN, United States
Synopsis
Keywords: Data Acquisition, Data Acquisition, MRE,Elastrography
To improve the clinical value of brain stiffness measurements, increased resolution is desired to accurately map the mechanical signatures of disease processes. However, MR elastography-based stiffness maps must be estimated by inverting the measured displacement fields. It is not well-established that increased acquisition resolution will directly translate to improved accuracy in the final mechanical property maps. In this simulation study, using two neural network inversions, we show 2-mm data outperforms 3-mm data for stiffness accuracy and precision across a range of signal-to-noise ratios.Introduction
Brain stiffness, as measured noninvasively by magnetic resonance elastography (MRE), has demonstrated value as a tissue characterization biomarker in an array of neurological disease processes with stiffness alterations following known patterns of disease topography.1 Given these preliminary findings, there is interest in increased resolution to improve the technique’s diagnostic accuracy.2-5 However, since stiffness maps must be computed as the estimated inverse solution to the wave equation given the measured displacements, and lower signal-to-noise ratio (SNR) tends to require increased smoothing or regularization,1, 6-8 it is currently unknown how acquisition resolution translates to quality in the final stiffness maps. Therefore, in this simulation study we tested the hypothesis that increased image resolution would improve the accuracy and precision of stiffness estimates, considering global, white matter, and gray matter regions of interest.Methods
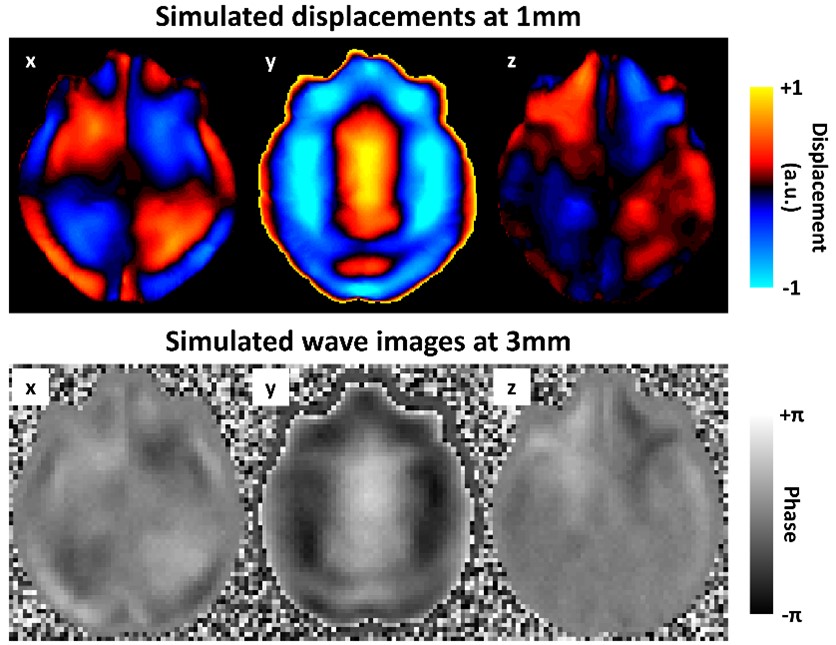
Two neural network inversions (NNIs) were trained using data generated by a finite difference model (FDM) of the harmonic wave equation in linear, viscoelastic materials. The FDM was previously described.5 Five thousand synthetic displacement fields were computed with 1-mm resolution (to allow downsampling to the resolutions of interest) in an 8.4-cm field of view (Fig. 1). Random material properties were parameterized between 1 and 5 kPa and damping ratio between 0 and 0.5. Motion was induced through randomly assigned, smoothly varying Dirichlet boundary conditions. These displacement fields were downsampled to 2- and 3-mm resolutions, along with the corresponding stiffness maps (by averaging all values contained within the lower resolution voxel). Training examples were augmented through the selection of a random noise field, in vivo mask patch, and temporal phase. An Inception-like network was trained to estimate the stiffness at the center of each patch using the curl of the displacements as inputs and an Adam optimizer at two learning rates, as described.5 Patch size was chosen to provide similar spatial footprints for the two NNIs (21x21x21 at 2mm and 15x15x15 at 3mm).The inversions were evaluated in a set of simulated brain datasets based on the anatomy of 44 healthy control participants (age 56 to 89 years).9 These displacement fields were similarly computed at 1-mm resolution with rigid body motion prescribed in the y-direction at the outer boundary of the cranial volume (akin to actuation during an in vivo MRE exam). In each case, a single white matter region and 39 gray matter regions were assigned a random stiffness value (same range as training data). The cerebrospinal fluid compartment was assigned the lowest stiffness and highest damping ratio in the training range. To examine the effects of SNR, the 3-mm data were prescribed 4 different noise levels (magnitude SNR in the range 10-40, increment of 10, 4 phase offsets, maximum phase accrual of 5 radians). The 2-mm datasets were inverted at the same SNR levels, but also at reduced SNR to mimic a matched acquisition time assuming a 2/3 decrease in voxel size in each dimension and a 2D pulse sequence (SNR decreased by factor of 4/9 in each case). An example noise-free simulated displacement field and corresponding wave image at 3-mm resolution is shown in Fig. 2.
After computing each stiffness map, the mean estimated value was measured in several regions of interest including global, white matter, and the 39 gray matter regions. The relationship between estimated and true stiffness values was modeled with and without z-score normalization to assess correlation strength and absolute sensitivity, respectively. Volume was controlled in gray matter models.
Results
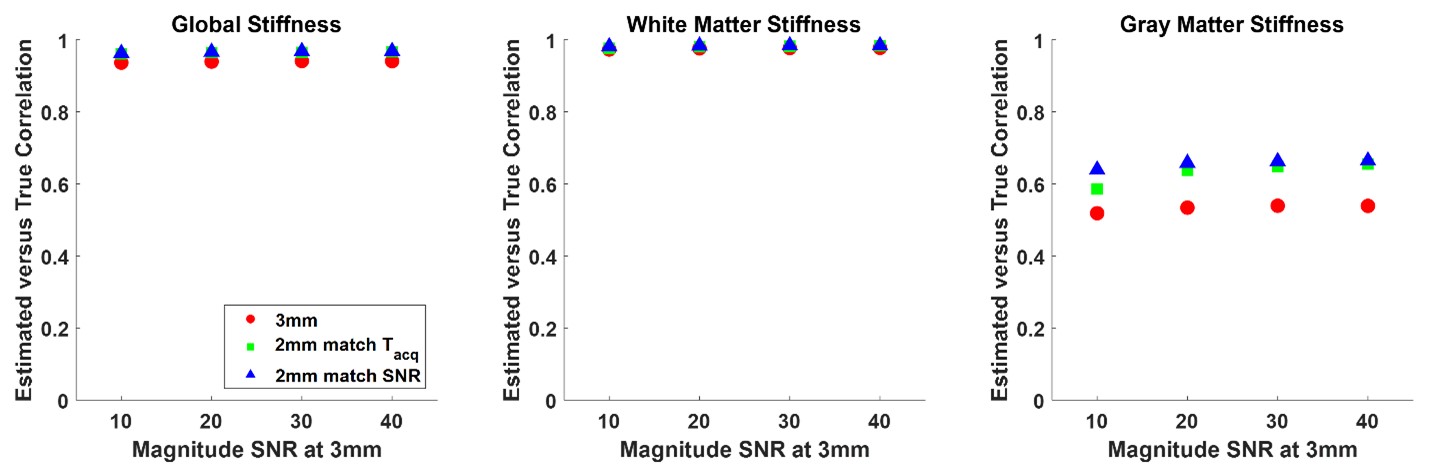
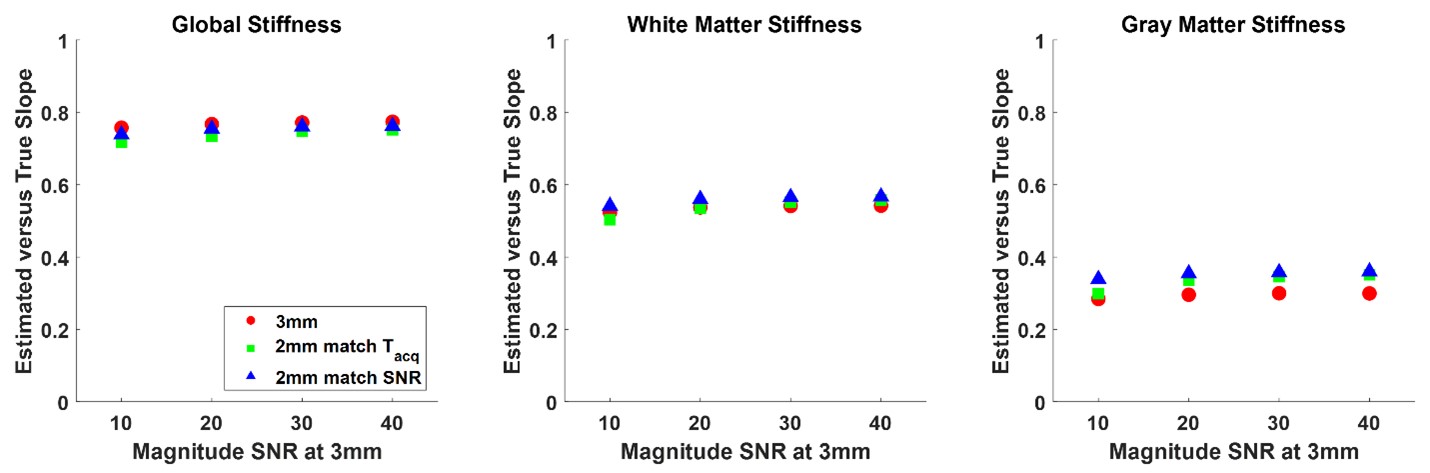
Example stiffness maps are shown in Fig. 3. For all regions of interest considered, the 2-mm data (matched for acquisition time) provided a significantly larger correlation coefficient between the estimated and true stiffness values (P<0.01, paired T-test), though the magnitude of this benefit was small in the large regions (global and white matter). As expected, the benefit of higher resolution data is more pronounced in the smaller gray matter regions, and the benefit increases with SNR (Fig. 4). Without z-score normalization, the 3-mm reconstruction had a significantly larger slope in the global region of interest, but again the difference is small in an absolute sense. No significant difference in these slopes was detected in the white matter region, while the slopes were significantly larger in gray matter regions using the 2-mm data (Fig. 5).Conclusion
When conducting MRE exams there are tradeoffs between image resolution, acquisition time and SNR, but it is not well established that higher resolution acquisitions translate to higher accuracy and precision in the results. The results of this study are consistent with another recent simulation experiment that showed a benefit using 1.25-mm resolution displacement fields compared to 2-mm data,4 though that study did not consider the expected loss in SNR when resolution is increased. This preliminary study has limitations that will be the subject of future investigation. We will extend this study to higher resolutions to determine if the benefit of resolution can be further extended in the context of NNI. Also, we expect that the optimal resolution may depend on the true distribution of mechanical properties and their spatial gradients. Whereas this experiment considered sharp transitions between regions, future work should also consider more slowly varying true properties.Acknowledgements
Funding: (R37EB001981, R01EB027064)References
1. Hiscox LV, Johnson CL, Barnhill E, et al. Magnetic resonance elastography (MRE) of the human brain: technique, findings and clinical applications. Phys Med Biol 2016;61:R401-R437.
2. Gerischer LM, Fehlner A, Kobe T, et al. Combining viscoelasticity, diffusivity and volume of the hippocampus for the diagnosis of Alzheimer's disease based on magnetic resonance imaging. Neuroimage Clin 2018;18:485-493.
3. Hiscox LV, Johnson CL, McGarry MDJ, et al. Mechanical property alterations across the cerebral cortex due to Alzheimer's disease. Brain Commun 2020;2:fcz049.
4. Hiscox LV, McGarry MDJ, Johnson CL. Evaluation of cerebral cortex viscoelastic property estimation with nonlinear inversion magnetic resonance elastography. Phys Med Biol 2022;67.
5. Scott JM, Pavuluri K, Trzasko JD, et al. Impact of material homogeneity assumption on cortical stiffness estimates by MR elastography. Magn Reson Med 2022;88:916-929.
6. Barnhill E, Hollis L, Sack I, et al. Nonlinear multiscale regularisation in MR elastography: Towards fine feature mapping. Med Image Anal 2017;35:133-145.
7. Papazoglou S, Hamhaber U, Braun J, Sack I. Algebraic Helmholtz inversion in planar magnetic resonance elastography. Physics in Medicine and Biology 2008;53:3147-3158.
8. Manduca A, Bayly PJ, Ehman RL, et al. MR elastography: Principles, guidelines, and terminology. Magn Reson Med 2021;85:2377-2390.
9. Arani A, Murphy MC, Glaser KJ, et al. Measuring the effects of aging and sex on regional brain stiffness with MR elastography in healthy older adults. Neuroimage 2015;111:59-64.
Figures
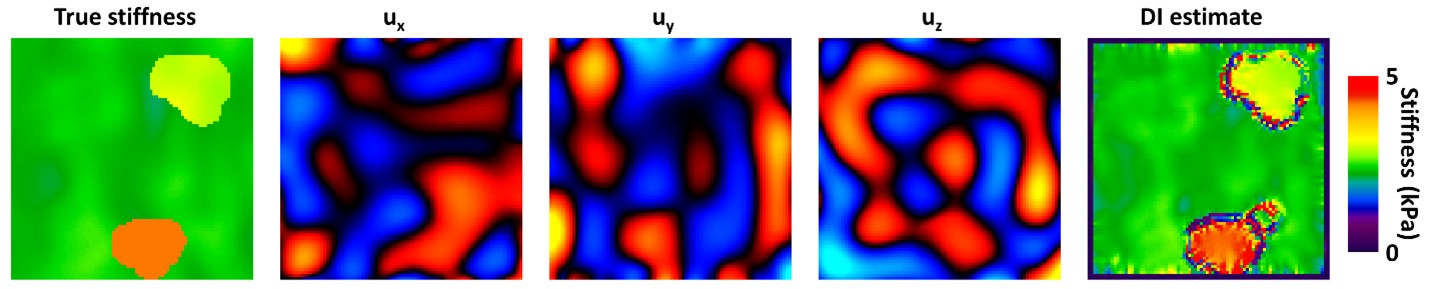
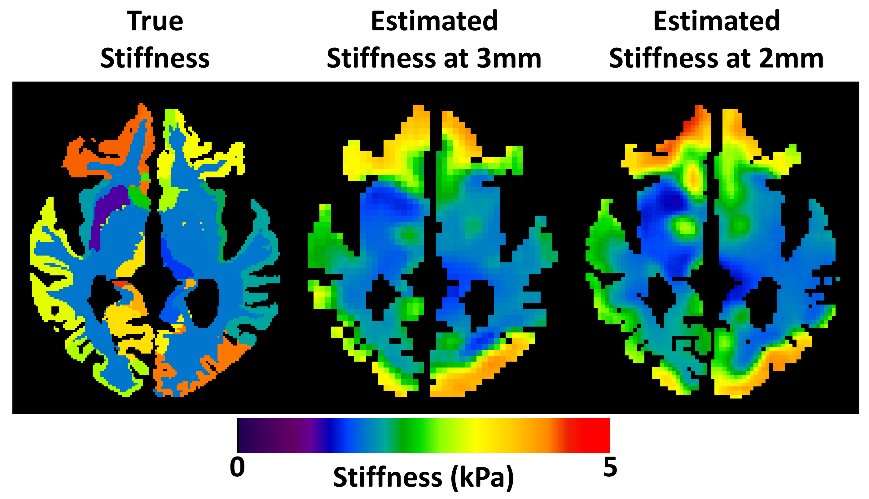
The left image shows the parameterized stiffness values used when creating the 1-mm test data. The middle and right show the estimated stiffness of the same slice from the 3-mm neural network and the 2-mm neural network, respectively (computed with magnitude SNR of 10).