0944
Neurite orientation dispersion and density imaging-based texture features in differentiating glioblastoma from solitary brain metastasis1The Department of Magnetic Resonance Imaging, The First Affiliated Hospital of Zhengzhou University, Zhengzhou, China, 2School of Cyber Science and Engineering, Zhengzhou University, Zhengzhou, China, 3Collaborative Innovation Center for Internet Healthcare, Zhengzhou, China, 4MR Scientific Marketing, Siemens Healthcare, Shanghai, China, 5Shanghai Key Laboratory of Magnetic Resonance, East China Normal University, Shanghai, China
Synopsis
Keywords: Machine Learning/Artificial Intelligence, Tumor
Preoperative differentiation between glioblastomas (GBM) and solitary brain metastases (SBM) would aid in appropriate treatment planning and follow-up. Neurite orientation dispersion and density imaging (NODDI) can identify diverse tissue components within tumors. Texture analysis can be used to extract and quantify these tissue inhomogeneities. In this study, we extracted texture features using NODDI and validated the NODDI metric map models and a combination model to discriminate between GBM and SBM. Finally, the combined NODDI model achieved the best discriminative power. Texture analysis based on NODDI has great potential for distinguishing between GBM and SBM.Introduction
Glioblastoma multiforme (GBM) and solitary brain metastases (SBM) are the most common malignant brain tumors, and their identification is key to further diagnosis and treatment [1]. Magnetic resonance imaging (MRI) is the main tool for differentiating between the two types of tumors; however, both GBM and SBM may show marked peritumoral edema and similar contrast enhancement patterns on routine MRI, leading to great challenges in identification [2]. Previous reports have indicated that differential diagnosis of tumors could benefit from diffusion-weighted MRI techniques, as it can quantitatively assess the entire tumor microstructure with a relatively high spatial resolution and does not require contrast agents. For example, neurite orientation dispersion and density imaging (NODDI) is a multi-spherical shell diffusion model based on the differences in the diffusion of water molecules inside and outside the cell, which demonstrates the difference in water diffusion between tumor infiltration and vasogenic edema [3]. Texture analysis is a sensitive technique that allows for the subtle assessment of the gray-scale signal intensity distribution of pixels and/or voxels, which can be used in MRI to quantify lesion irregularity and heterogeneity in tissue composition [4]. This study aimed to explore the usefulness of NODDI texture features in distinguishing GBM from SBM.Materials and Methods
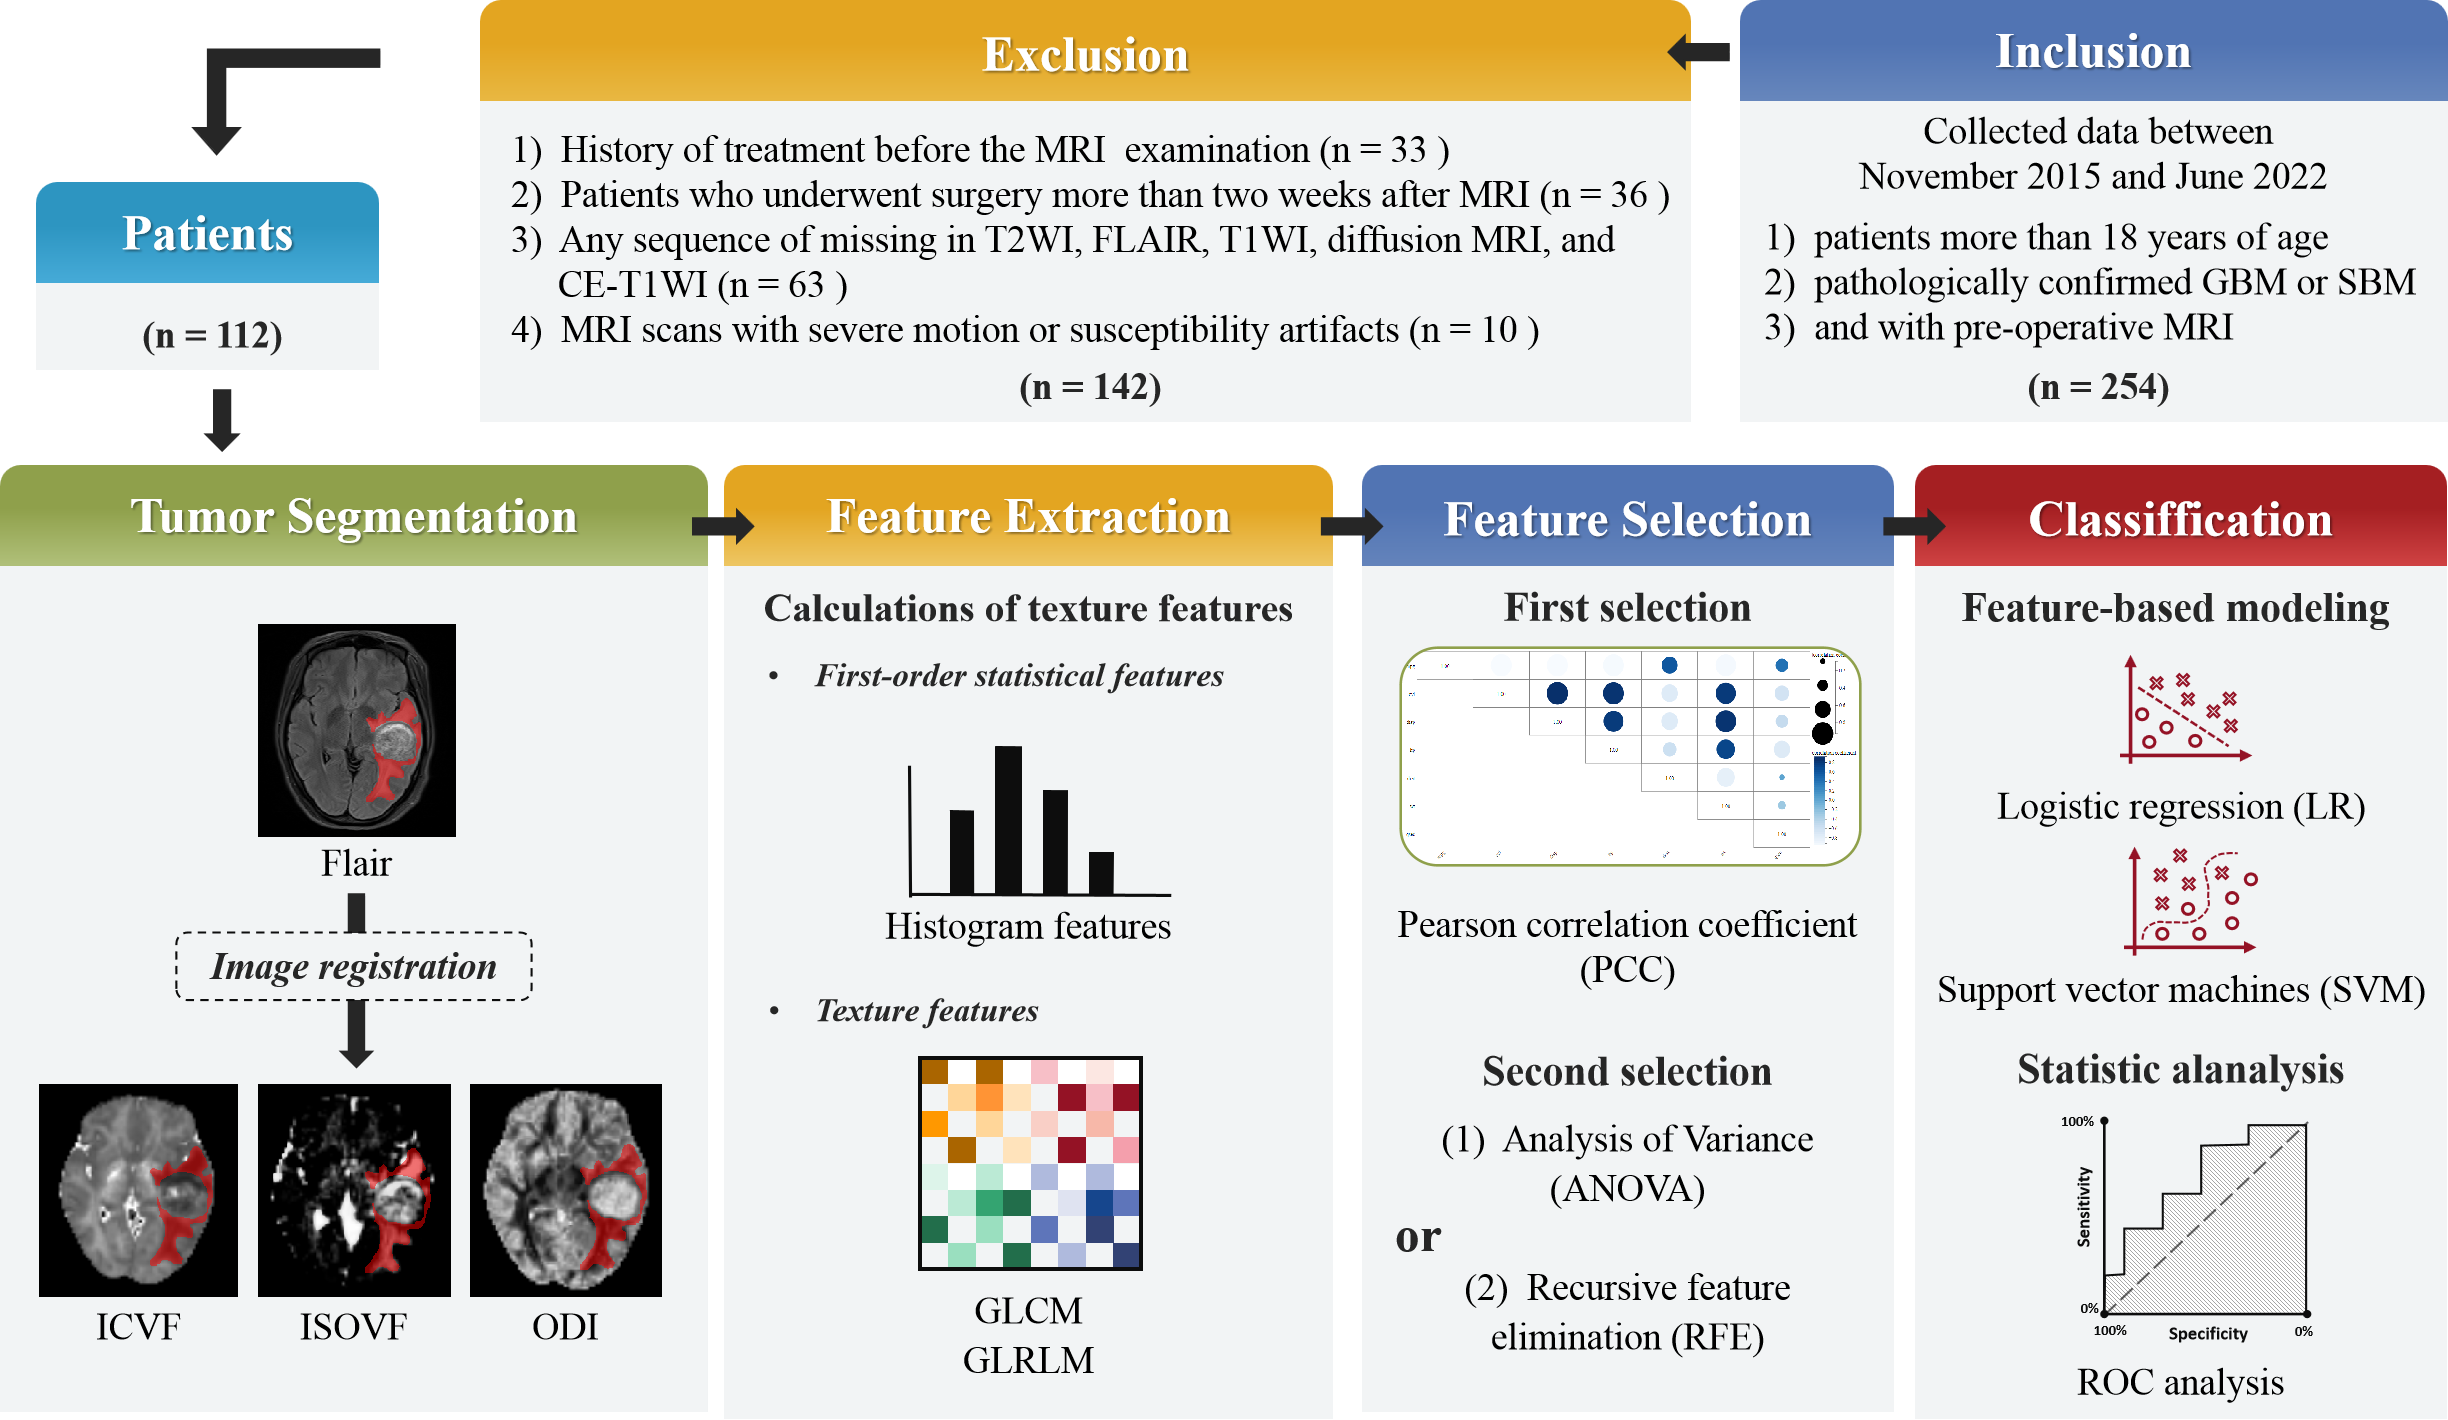
This retrospective study was approved by our Institutional Ethics Committee, which waived the need for informed consent. This study was conducted in accordance with the principles of the Declaration of Helsinki. We reviewed 112 patients newly diagnosed with cerebral GBM and SBM between November 2015 and June 2022. The inclusion and exclusion criteria are shown in Figure 1. All patients underwent diffusion-weighted imaging (DWI) and routine MRI examinations using a 3T MR scanner (MAGNETOM Prisma; Siemens Healthcare, Erlangen, Germany) with a 64-channel head–neck coil. The training cohort consisted of 79 randomly chosen participants, whereas the testing cohort consisted of remaining 20 patients.DWI data were collected using 6b values (0, 500, 1000, 1500, 2000, and 2500 s/mm2), and each non-zero b value was encoded in 30 directions. NODDI metric maps were estimated directly from DWI data using NeuDilab, an in-house developed software program using Python based on the free DIPY toolbox, software (https://www.dipy.org/). Finally, NODDI metric maps, including the intracellular volume fraction (ICVF), orientation dispersion index (ODI), and isotropic volume fraction (ISOVF) were constructed.
The flow diagram of this study is shown in Figure 1. The NODDI metric maps were spatially registered to FLAIR images. Subsequently, the peri-enhancing edema region, as a region of interest (ROI), was manually segmented on axial FLAIR images using ITK-SNAP (http://www.itksnap.org) software. The main steps, such as feature extraction, feature selection, and model building, were handled by FAE software [5]. Using the gray-level co-occurrence matrix (GLCM) and gray-level run-length matrix (GLRLM) functions from the Pyradiomics package, 24 and 16 quantitative features were extracted. In addition, 18 first-order statistical features were extracted for texture analysis. Finally, a total of 58 features were extracted for subsequent analysis.
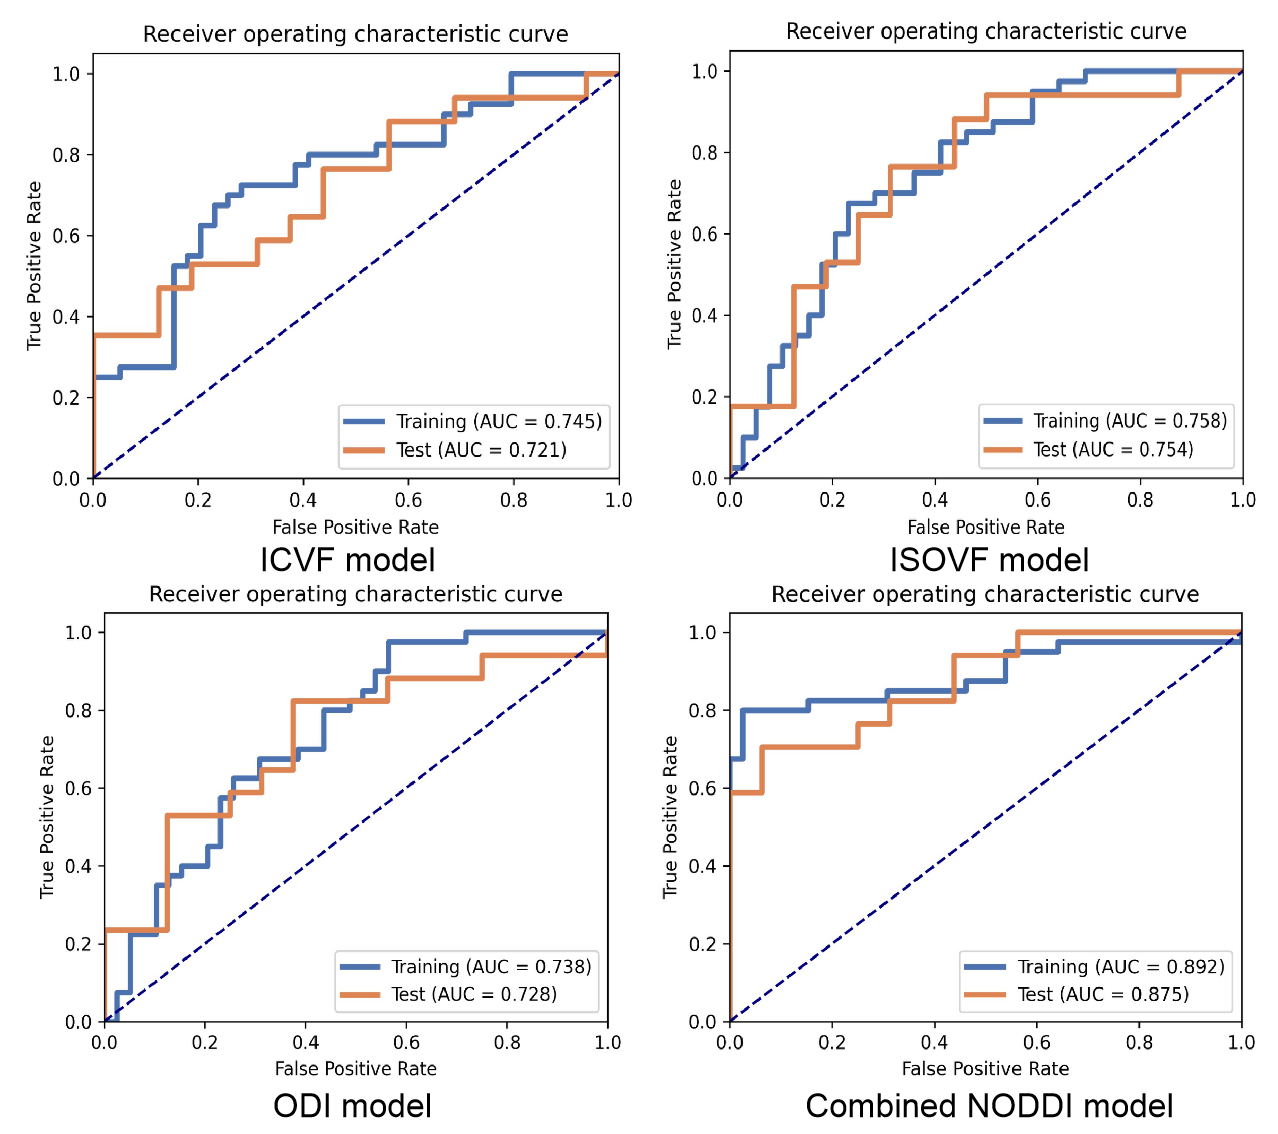
Three feature selection methods and two classifiers were used to construct texture feature prediction models on individual maps from the NODDI metric maps. Simultaneously, a combined NODDI model was built using candidate features from each metric map. Five-fold cross-validation was used to demonstrate model performance, and the performance of the testing cohort was evaluated using the receiver operating characteristic (ROC) curve, accuracy, area under the ROC curve (AUC), sensitivity, and specificity.
Results
Detailed clinical characteristics of the patients are presented in Table 1. No significant differences were found between the two groups in terms of sex (P = 0.884) or age (P = 0.853).Figure 2 and Table 2 show the performance of the three NODDI metric map models and the combined model. Three NODDI metric map models derived from the peri-enhancing edema region had moderate values for differentiating GBM from SBM. The combined NODDI model achieved the best discriminative power (accuracy, 71.72%; AUC, 0.87; sensitivity, 70.59%; specificity, 93.75%). Table 3 lists the candidate features used to build the various texture analysis models. In the combined model, the two GLRLM features of ICVF and skewness features of ICVF, ISOVF, and ODI played crucial roles in discriminating GBM from SBM. ICVF_GLRLM_LongRunEmphasis and ICVF_GLRLM_RunVariance represent the roughness of the image texture in the ROI, and Skewness is a numerical feature of the asymmetric degree of statistical data distribution, which characterizes the distribution of image signal intensity.
Discussion
Previous studies have concluded that textural features are associated with the heterogeneity of peri-enhancing edema regions in GBM and SBM [6]. This conclusion is further confirmed by our results. In our study, the combined MAP-MRI performed better than the single-metric map model. Compared to the findings of similar previously published studies , textural features of NODDI appear to have better discriminative power for texture features of routine MRI [6]. Recent studies report that NODDI can identify more diverse tissue components within tumors, and that cell density may play an important role [3]. Texture analysis can easily extract diffusion information and can be used to quantify tumor heterogeneity. This low-cost solution will promote differential diagnosis of GBM and SBM in clinical practice.Conclusion
Texture analysis based on NODDI has immense potential for discriminating GBM from SBM.Acknowledgements
No acknowledgement found.References
[1] Kamimura K, Nakajo M, Yoneyama T, et al. Histogram analysis of amide proton transfer-weighted imaging: comparison of glioblastoma and solitary brain metastasis in enhancing tumors and peritumoral regions. Eur Radiol. 2019;29(8):4133-4140.
[2] Fordham, A, Hacherl C, Patel N, et al. Differentiating glioblastomas from solitary brain metastases: an update on the current literature of advanced imaging modalities. Cancers. 2021; 13(12): 2960.
[3] Jinbo Qi, Peipei Wang, Guohua ZhaoQi, et al. Histogram Analysis Based on Neurite Orientation Dispersion and Density MR Imaging for Differentiation Between Glioblastoma Multiforme and Solitary Brain Metastasis and Comparison of the Diagnostic Performance of Two ROI Placements. J Magn Reson Imaging. 2022, DOI: 10.1002/jmri.28419.
[4] Jia Li, Shuai Fu, Ze GongLi J, et al. MRI-based Texture Analysis of Infrapatellar Fat Pad to Predict Knee Osteoarthritis Incidence. Radiology. 2022;304(3):611-621.
[5] Song Y, Zhang J, Zhang YD, et al. FeAture Explorer (FAE): A tool for developing and comparing radiomics models. PLoS One. 2020;15(8):e0237587.
[6] Dong F, Li Q, Jiang B, Zhu X, Zeng Q, Huang P, Chen S, Zhang M. Differentiation of supratentorial single brain metastasis and glioblastoma by using peri-enhancing oedema region-derived radiomic features and multiple classifiers. Eur Radiol. 2020;30(5):3015-3022.
Figures