0938
Effects of Free-Breathing on Cerebral Veins: study by Real-Time Phase-Contrast MRI1CHIMERE UR 7516, Jules Verne University of Picardy, Amiens, France, 2Medical Image Processing Department, Amiens Picardy University Hospital, Amiens, France, 3Radiology Department, Amiens Picardy University Hospital, Amiens, France, 4Neurosurgery Department, Amiens Picardy University Hospital, Amiens, France
Synopsis
Keywords: Head & Neck/ENT, Velocity & Flow, real time phase contrast, phase contrast, respiratory effects, cerebral veins
Real-time phase-contrast sequences are increasingly used to study the effect of breathing on cerebral circulation, however, there is a lack of studies on the effect of free breathing (E-Fb) on cerebral veins. In this study, we quantified the intensity and phase shift of the E-Fb on cerebral veins in 19 healthy volunteers using a time-domain multiparameter analysis method. We analyzed the characteristics of the E-Fb on four parameters of four cerebral veins. We found that during expiration, the mean flow rate, amplitude, stroke volume, and cardiac period of internal jugulars veins and sinuses increased.
Introduction
A better understanding of neuro-fluids (blood and CSF) dynamics may be of vital importance for clinical investigation. Compared to cardiac gated phase-contrast sequences1,2, which can only provide a reconstructed average cardiac cycle flow curve (CCFC), real-time phase-contrast sequences (RT-PC) allow real-time quantification of neuro-fluids. Although RT-PC is not yet used clinically, there is growing evidence of its potential for quantifying the effects of breathing on cerebral circulation and clinical diagnosis3-6.Currently, many studies have indicated the effect of different breathing patterns on cerebral circulation7-9, however, there is little evidence on their effect during free breathing. Previous studies have successfully quantified the effects of free breathing on cerebral arteries using a new time-domain multiparametric analysis method10,11. The purpose of this study is to quantify the effects of free breathing (E-Fb) on the cerebral venous system using the same method.
Methods
− Image acquisition19 healthy volunteers (age: 19~35; 9 women) were examined using a clinical 3T scanner, maximum gradients 80 mT/m. Rate of gradient increases 120 mT m-1 ms-1 and a 32 channels head coil. Volunteers maintained free breathing during the acquisition, the breathing signal was recorded simultaneously using a breathing belt.
The RT-PC used in this study was a multi-shot, gradient-recalled echo-planar imaging sequence with a Cartesian trajectory. Parameters were as follows: TE/TR/flip=4.9ms/9.4/10°, SENSE=2.5, EPI-factor=7, VENC=60cm/s, FOV=140*140mm2, pixel size acquisition=70*70mm2, time resolution=75ms/image, number image=400 or 600 (8 volunteers).
RT-PC was performed on two planes to quantify the venous blood flow of left jugular (LJ) and right jugular (RJ) in extracranial plane, and straight sinus (SS) and superior sagittal sinus (SSS) in intracranial plane (Fig.1).
− Image Processing
All image and signal processing were performed using the software – Flow 2.012.
First, the continuous venous blood flow signal is extracted after segmentation and background field correction. Then, from this signal, the software automatically locates the maximum or minimum value of each CCFC to obtain multiple independent CCFCs (Fig.1-D red points). The CCFCs are reconstructed into an average CCFC to calculate the E-Fb on four parameters: mean flow, amplitude flow, stroke volume and cardiac period of each vein.
− Quantification of the E-Fb on cerebral veins
Fig.2 summarizes the quantification process:
A) Definition of the inspiratory (red) and expiratory (blue) phases using the respiratory signal (pressure increase corresponds to inspiratory phase). Classification of each CCFC in the corresponding respiratory phase (red and blue dots).
B) Reconstruction of an average inspiratory (CCFC-In) and expiratory (CCFC-Ex) cycle from CCFCs.
C) Calculation of the percentage difference DiffEx-In between CCFC-Ex and CCFC-In for each parameter evaluated.
D) We assume a non-zero phase shift (Shift) on the E-Fb of venous parameters to obtain the maximum DiffEx-In value. In order to find the Shift value, the breathing signal is shifted, in a range of -3s~3s, with a step of 0.1s. Then, steps A~C are repeated. Finally, for each parameter p, a DiffEx-In(p,Shift) curve is obtained.
E) Extraction of the maximum value (DiffEx-In) of the curve. Calculation of Shift (%) for comparisons between volunteers with different breathing periods.
The intensity (DiffEx-In) of E-Fb on each parameter and the corresponding phase shift (Shift) are then obtained.
Results
Fig.3 shows that RJ presents a higher mean flow and amplitude compared with LJ. The mean flow and stroke volume of the extracranial plane (RJ +LJ) are higher than those of the intracranial plane (SS+SSS).For the E-Fb on Mean flow (shown in Fig.3 and Fig.4): RJ and LJ were more affected by free breathing than SS and SSS (DiffEx-In: 9% and 6.3% vs. 2.7% and 2.8%). mean flow of all the veins increased during expiratory. The E-Fb (DiffEx-In and Shift) of SS is significantly correlated with that of SSS (p<.01). In contrast, there is no correlation between the E-Fb of RJ and LJ.
Fig.5-A demonstrates a negative correlation between Shift and DiffEx-In on the mean flow of SSS (p<.01). The respiratory period may be a reason for this correlation, with increasing respiratory period, Shift decreases (Fig.5-B).
Discussion
The cerebral venous flow quantified in this study using RT-PC was in accordance with the results of previous studies8,13.It is not possible to use only one jugular to represent the E-Fb on the veins of the extracranial plane since the E-Fb on RJ and on LJ are not correlated. In contrast, the E-Fb on SS and SSS are correlated (Fig.3 & Fig.4), considering the larger area of SSS, it is feasible to use SSS to represent the E-Fb on the veins of the intracranial plane.
Conclusion
Using this multi-parameter time-domain analysis method, for each venous flow parameter, not only the intensity of free breathing effects was quantified, but also the phase shift parameters were identified. During expiratory, the mean flow rate, amplitude, stroke volume, and cardiac period of SSS increased by 2.8%, 14%, 8% and 6.6%, respectively.These new findings will provide a valuable reference for subsequent studies on the effects of breathing on cerebral circulation.
Acknowledgements
This research was supported by EquipEX FIGURES (Facing Faces Institute Guiding Research), European Union Interreg REVERT Project, Hanuman ANR-18-CE45-0014 and Region Haut de France. Thanks to the staff members at the Facing Faces Institute (Amiens, France) for technical assistance. Thanks to David Chechin from Phillips industry for his scientific support.References
- Pelc NJ, Herfkens RJ, Shimakawa A, Enzmann DR. Phase contrast cine magnetic resonance imaging. Magnetic resonance quarterly. 1991 Oct 1;7(4):229-54.
- Finn JP, Nael K, Deshpande V, Ratib O, Laub G. Cardiac MR imaging: state of the technology. Radiology. 2006 Nov;241(2):338-54. https://doi.org/10.1148/radiol.2412041866.
- Balédent O, Liu P, Lokossou A, Fall S, Metanbou S, Makki M. Real-time phase contrast magnetic resonance imaging for assessment of cerebral hemodynamics during breathing. In ISMRM 2019-International Society for Magnetic Resonance in Medicine 2019 May 11. https://hal.archives-ouvertes.fr/hal-03736882.
- Nayak KS, Lim Y, Campbell‐Washburn AE, Steeden J. Real‐Time Magnetic Resonance Imaging. Journal of Magnetic Resonance Imaging. 2022 Jan;55(1):81-99. https://doi.org/10.1002/jmri.27411.
- Dreha-Kulaczewski S, Joseph AA, Merboldt KD, Ludwig HC, Gärtner J, Frahm J. Inspiration is the major regulator of human CSF flow. Journal of neuroscience. 2015 Feb 11;35(6):2485-91. https://doi.org/10.1523/JNEUROSCI.3246-14.2015.
- Yildiz S, Thyagaraj S, Jin N, Zhong X, Heidari Pahlavian S, Martin BA, Loth F, Oshinski J, Sabra KG. Quantifying the influence of respiration and cardiac pulsations on cerebrospinal fluid dynamics using real‐time phase‐contrast MRI. Journal of Magnetic Resonance Imaging. 2017 Aug;46(2):431-9. https://doi.org/10.1002/jmri.25591.
- Aktas G, Kollmeier JM, Joseph AA, Merboldt KD, Ludwig HC, Gärtner J, Frahm J, Dreha-Kulaczewski S. Spinal CSF flow in response to forced thoracic and abdominal respiration. Fluids and Barriers of the CNS. 2019 Dec;16(1):1-8. https://doi.org/10.1186/s12987-019-0130-0.
- Laganà MM, Pirastru A, Ferrari F, Di Tella S, Cazzoli M, Pelizzari L, Jin N, Zacà D, Alperin N, Baselli G, Baglio F. Cardiac and Respiratory Influences on Intracranial and Neck Venous Flow, Estimated Using Real-Time Phase-Contrast MRI. Biosensors. 2022 Aug 8;12(8):612. https://doi.org/10.3390/bios12080612.
- Chen L, Beckett A, Verma A, Feinberg DA. Dynamics of respiratory and cardiac CSF motion revealed with real-time simultaneous multi-slice EPI velocity phase contrast imaging. Neuroimage. 2015 Nov 15;122:281-7. https://doi.org/10.1016/j.neuroimage.2015.07.073.
- Liu P, Fall S, Metanbou S, Balédent O. Real-Time Phase Contrast MRI to quantify Cerebral arterial flow change during variations breathing. In ISMRM 2022-International Society for Magnetic Resonance in Medicine 2022 May 7. https://hal.archives-ouvertes.fr/hal-03736876.
- Liu P, Fall S, Balédent O. Use of real-time phase-contrast MRI to quantify the effect of spontaneous breathing on the cerebral arteries. NeuroImage. 2022 Jun 7:119361. https://doi.org/10.1016/j.neuroimage.2022.119361.
- Liu P, Fall S, Balédent O. Flow 2.0-a flexible, scalable, cross-platform post-processing software for realtime phase contrast sequences. In ISMRM 2022-International Society for Magnetic Resonance in Medicine 2022 May 7. https://doi.org/10.48550/arXiv.2207.12712
- Lokossou A, Metanbou S, Gondry-Jouet C, Balédent O. Extracranial versus intracranial hydro-hemodynamics during aging: a PC-MRI pilot cross-sectional study. Fluids and Barriers of the CNS. 2020 Dec;17(1):1-1. https://doi.org/10.1186/s12987-019-0163-4.
Figures
Figure 2: Workflow chart for quantifying the E-Fb on cerebral veins. A) Definition of inspiratory (red) and expiratory (blue) phases using the breathing signal. B) Reconstruction of the CCFCEx (blue curve) and CCFCIn (red curve) using all the CCFCs during expiratory or inspiratory. C) Calculation of DiffEx-In for each parameter with zero shift. D) Breathing signal shift from -3s to +3s by 0.1s. Previous steps are repeated to obtain the DiffEx-In (p, shift) curves for each parameter. E) Extraction of the maximum value of each curve noted as DiffEx-In and the corresponding shift (%).
Figure 3: Results of the quantification of flow and the E-Fb (DiffEx-In and Shift) on four parameters of four cerebral veins. DiffEx-In indicates the percentage difference between the corresponding parameters of CCFCEx and CCFCIn, Shift (%) indicates the percentage of shift (second) and the respiratory period. R value indicates the correlation coefficient of Pearson or Spearman test, * indicates p < 0.05, and ** indicates p < 0.01. RJ = right internal jugular vein; LJ = left internal jugular vein; SS = straight sinus; SSS = superior sagittal sinus.
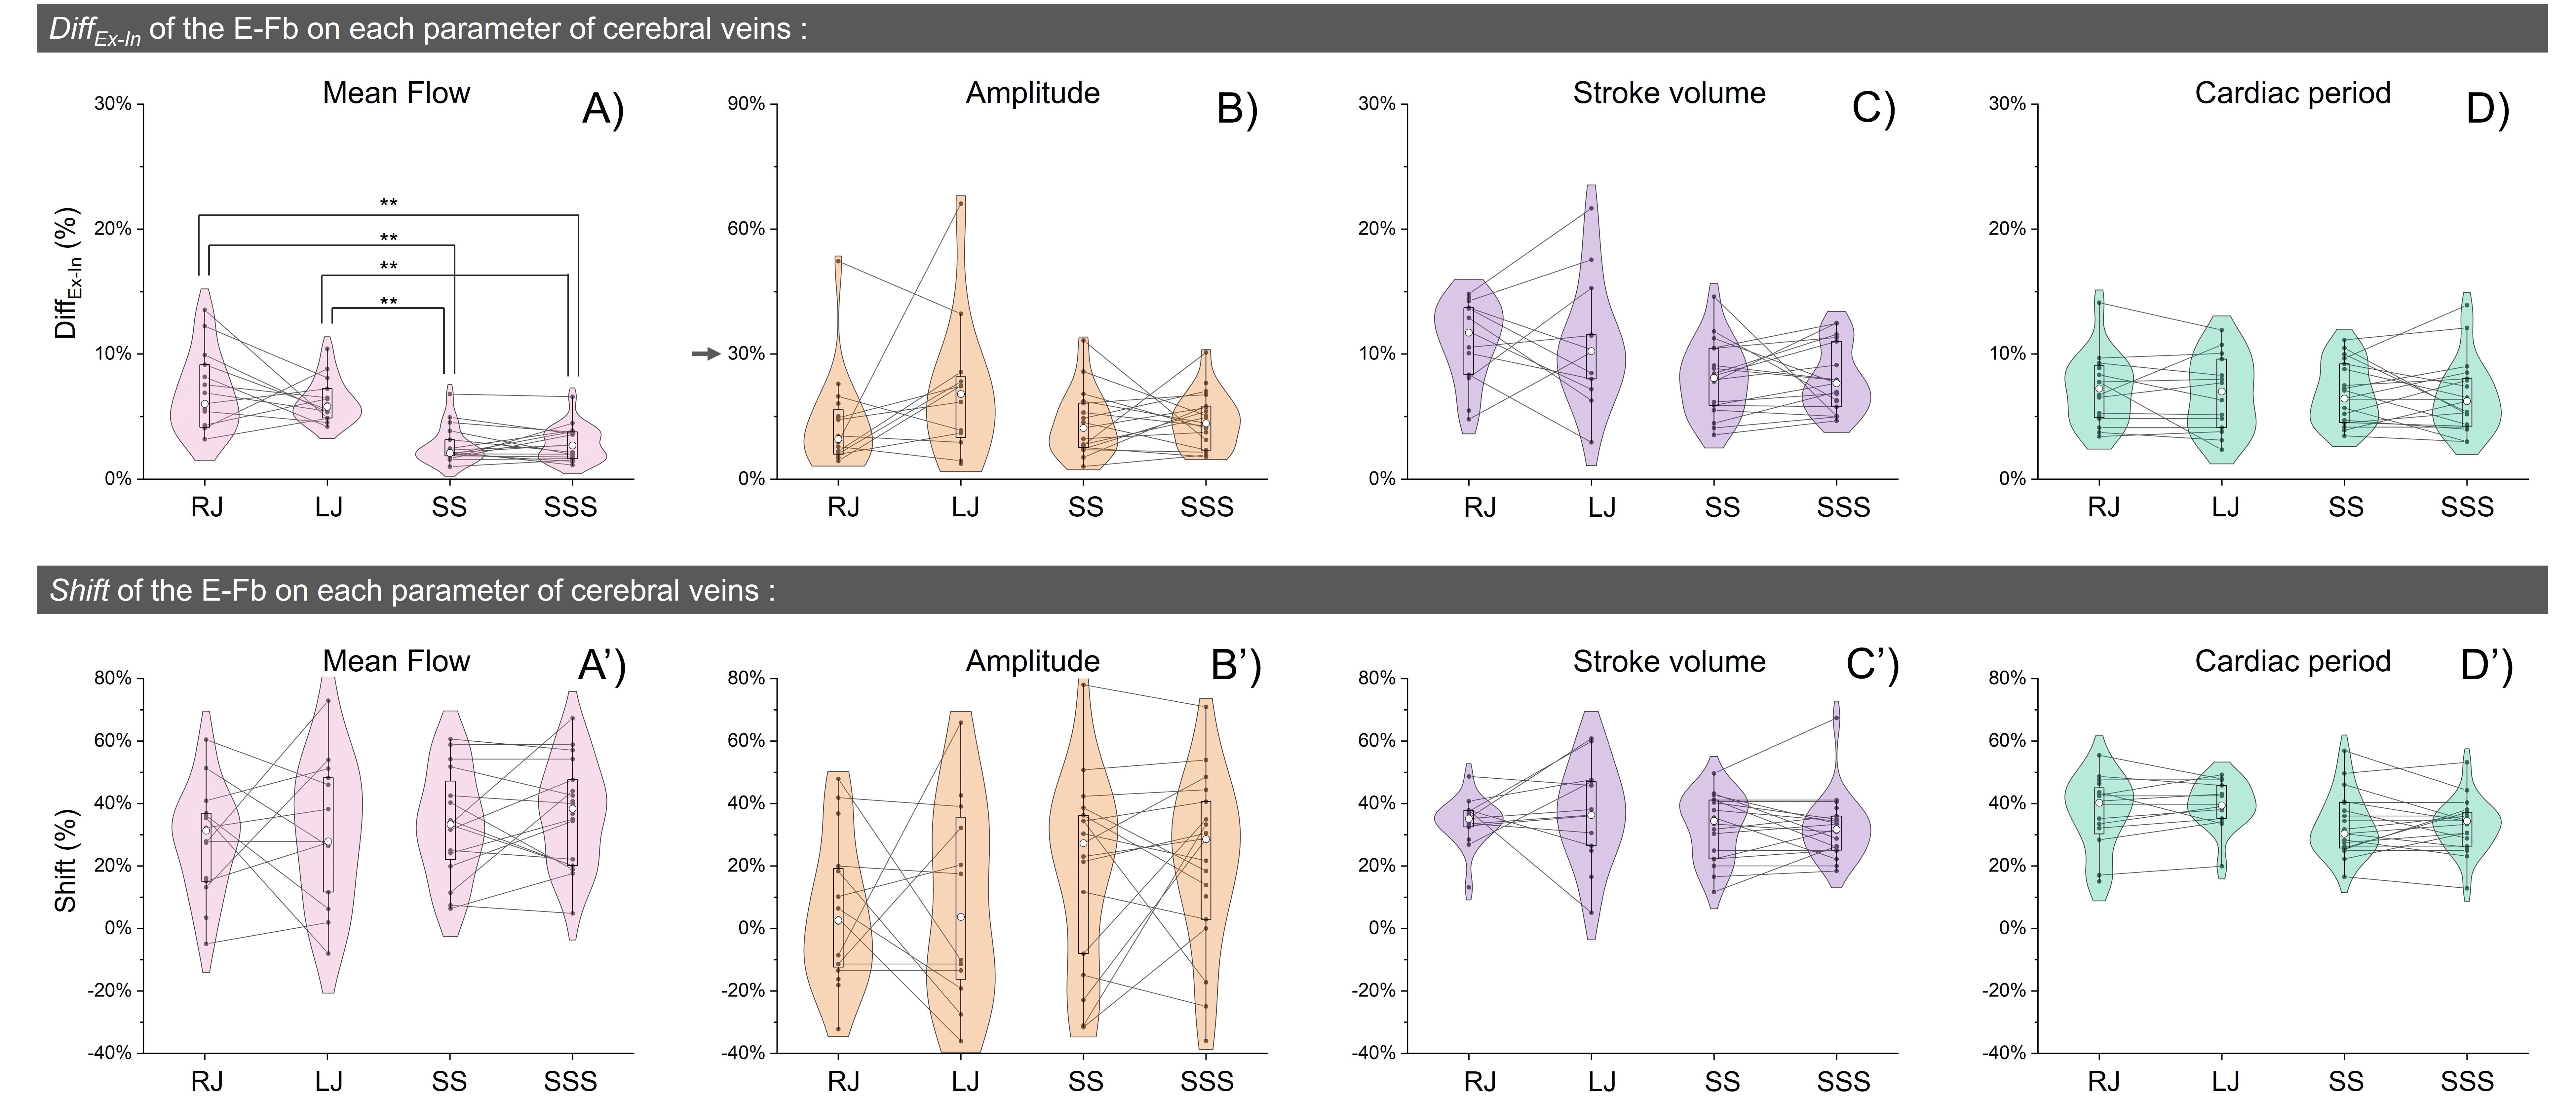
Figure 4: Distribution of DiffEx-In (top) and Shift (bottom) on each parameter for the four cerebral veins. The line plot shows the correlation between RJ and LJ as well as between SS and SSS. The paired Student’s t-test was performed in A), * indicates p < 0.05, and ** indicates p < 0.01.