0937
Intracranial Arterial Flow Velocimetry in Quantitative Time-of-Flight MR Angiography using Deep Machine Learning
Ioannis Koktzoglou1,2 and Rong Huang1
1Radiology, NorthShore University HealthSystem, Evanston, IL, United States, 2Pritzker School of Medicine, The University of Chicago, Chicago, IL, United States
1Radiology, NorthShore University HealthSystem, Evanston, IL, United States, 2Pritzker School of Medicine, The University of Chicago, Chicago, IL, United States
Synopsis
Keywords: Flow, Brain, MRA
Quantitative time-of-flight (qTOF) magnetic resonance angiography (MRA) is a recently introduced technique that provides for simultaneous luminal and hemodynamic imaging of the intracranial arteries. We hypothesized that the application of a deep machine learning (DML) image analysis strategy to qTOF MRA data would improve agreement of intracranial arterial velocity measures with respect to phase contrast MRI. Compared to a more conventional image analysis procedure, we found that the application of DML image analysis to qTOF data improved agreement of component, total, and peak intracranial arterial flow velocity measures with respect to phase contrast MRI, and reduced calculation times by 35-fold.Introduction
Blood flow is essential to the health and function of the brain1. The method of time-of-flight (TOF) magnetic resonance angiography (MRA) that is in widespread clinical use to evaluate the intracranial arteries only provides for structural evaluation of the intracranial vessels and does not provide any quantitative hemodynamic information. Addressing this deficiency, the recently described approach of quantitative TOF (qTOF) MRA provides for simultaneous structural and quantitative hemodynamic evaluation of the intracranial arteries while providing similar image appearance, spatial resolution, and scan times as standard TOF MRA2. However, the qTOF method to date has relied on the use of a hand-crafted computer vision procedure to quantify intracranial arterial flow velocity, which is likely suboptimal. We hypothesized that the use of a deep machine learning (DML) strategy could be used to rapidly quantify intracranial arterial flow velocity from qTOF image data. Results obtained with DML image analysis were compared to those obtained with a more conventional hand-crafted computer vision procedure.Methods
This study was approved by our institutional review board and all participants provided written-informed consent. 15 human subjects were imaged with qTOF on a 3 Tesla MRI system (MAGNETOM Skyrafit, Siemens Healthineers). Imaging was done using qTOF and 3D phase contrast (PC) MRI. Imaging parameters for qTOF were: TR/flip angle=21.0ms/15°, 0.58×0.58×1.0mm3 spatial resolution interpolated to 0.29×0.29×0.5mm3, scan time 4min 3s, TEs of 2.9ms (TE1), 5.1ms (TE2), and 7.2ms (TE3), from which the flow-compensated TE1 and TE3 images were analyzed to quantify intracranial arterial flow velocity. Imaging parameters for PC were: TR/TE/flip angle=39.9ms/5.9ms/10°, 0.85×0.85×1.30mm3 spatial resolution interpolated to 0.43×0.43×0.65mm3, 60cm/s velocity encoding sensitivity, scan time 4min 4s.Velocity quantitation with qTOF was done using conventional and DML computer vision procedures. Conventional velocity quantitation was done using hand-crafted computer vision procedure inspired from prior work2, while the DML strategy was trained using spatially-registered PC velocity data as the target. The DML strategy used two 2.5D U-Nets, with one quantifying in-plane (i.e., x and y) flow velocities, and another quantifying through-plane (i.e., z) flow velocities. Measurements of component, total, and peak flow velocities were made. qTOF flow velocity measures obtained using the conventional and DML image analysis procedures were compared to PC values using intraclass correlation coefficient for absolute agreement (ICC), Pearson's correlation coefficient (r), and Bland Altman 95% limits of agreement (LOA). Computation times for both image analysis methods were measured.
Results
DML-based analysis of qTOF image data yielded spatial maps of intracranial arterial flow velocity that mimicked those obtained with PC (Figure 1). Compared to hand-crafted image analysis, DML analysis substantially improved the agreement and correlation of component flow velocities (ICC=0.966 versus 0.939, r=0.972 versus 0.940, LOA=[-5.2, +4.3] cm/s versus [-6.9, +6.5] cm/s), total flow velocities (ICC=0.835 versus 0.723, r=0.875 versus 0.744, LOA=[-6.8, +3.6] cm/s versus [-9.4, +7.1] cm/s), and peak flow velocities (ICC=0.816 versus 0.597, r=0.827 versus 0.687, LOA=[-13.5, +10.2] cm/s versus [-21.3, +10.2] cm/s). Figure 2 graphically summarizes results obtained for total flow velocity. DML analysis also reduced calculation times 35-fold (3.9±1.7 seconds versus 138±20 seconds).Discussion
Compared to a previously published hand-crafted computer vision procedure, we found that the application of DML-based image analysis to qTOF image data improved the agreement of intracranial arterial flow velocity measures with respect to PC. The combination of rapid calculation times and improved velocimetric agreement with PC supports the application of DML to intracranial qTOF MRA. Future work will seek to refine the described DML strategy, as well as apply and validate it in patients with cerebrovascular disorders.Conclusion
The application of deep machine learning image analysis to qTOF MRA improves the agreement of velocity measures with phase contrast MRI, and markedly reduces calculation times.Acknowledgements
NIH award number R01EB027475References
1. Claassen JAHR, Thijssen DHJ, Panerai RB, Faraci FM. Regulation of cerebral blood flow in humans: physiology and clinical implications of autoregulation. Physiol Rev. 2021 Oct 1;101(4):1487-1559.
2. Koktzoglou I, Huang R, Edelman RR. Quantitative time-of-flight MR angiography for simultaneous luminal and hemodynamic evaluation of the intracranial arteries. Magn Reson Med. 2022 Jan;87(1):150-162.
Figures
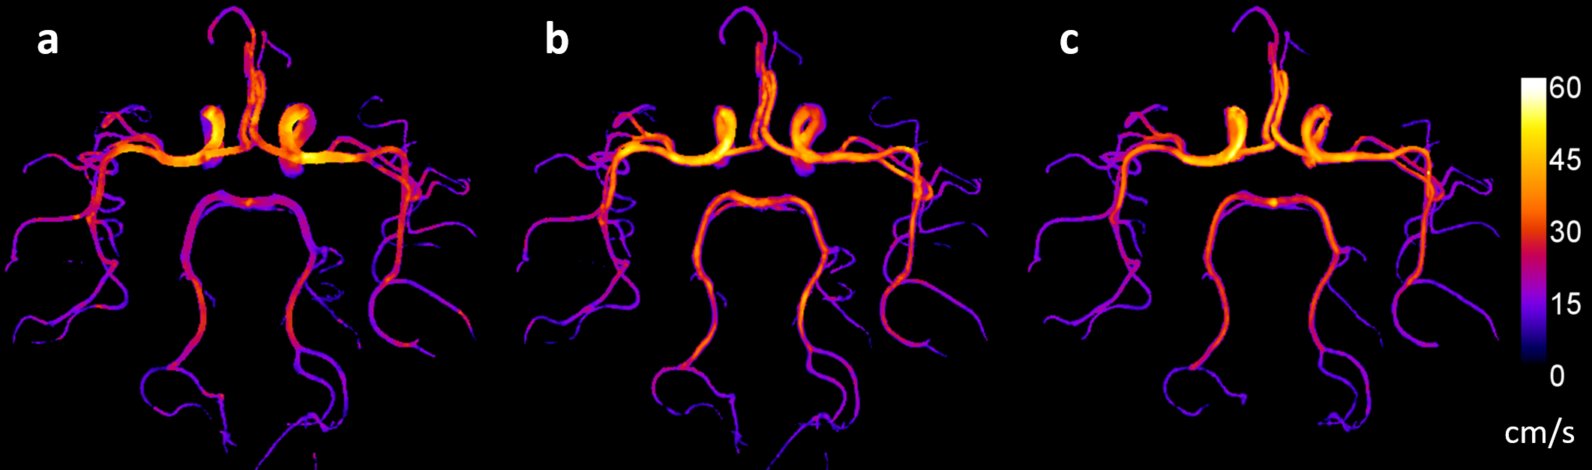
Figure 1.
Comparison of total flow velocity maps obtained with a) qTOF
MRA with hand-crafted image analysis, b) qTOF MRA with deep machine learning
(DML) image analysis, and c) phase contrast MRI. Note the improved
correlation of DML image analysis with respect to phase contrast MRI.
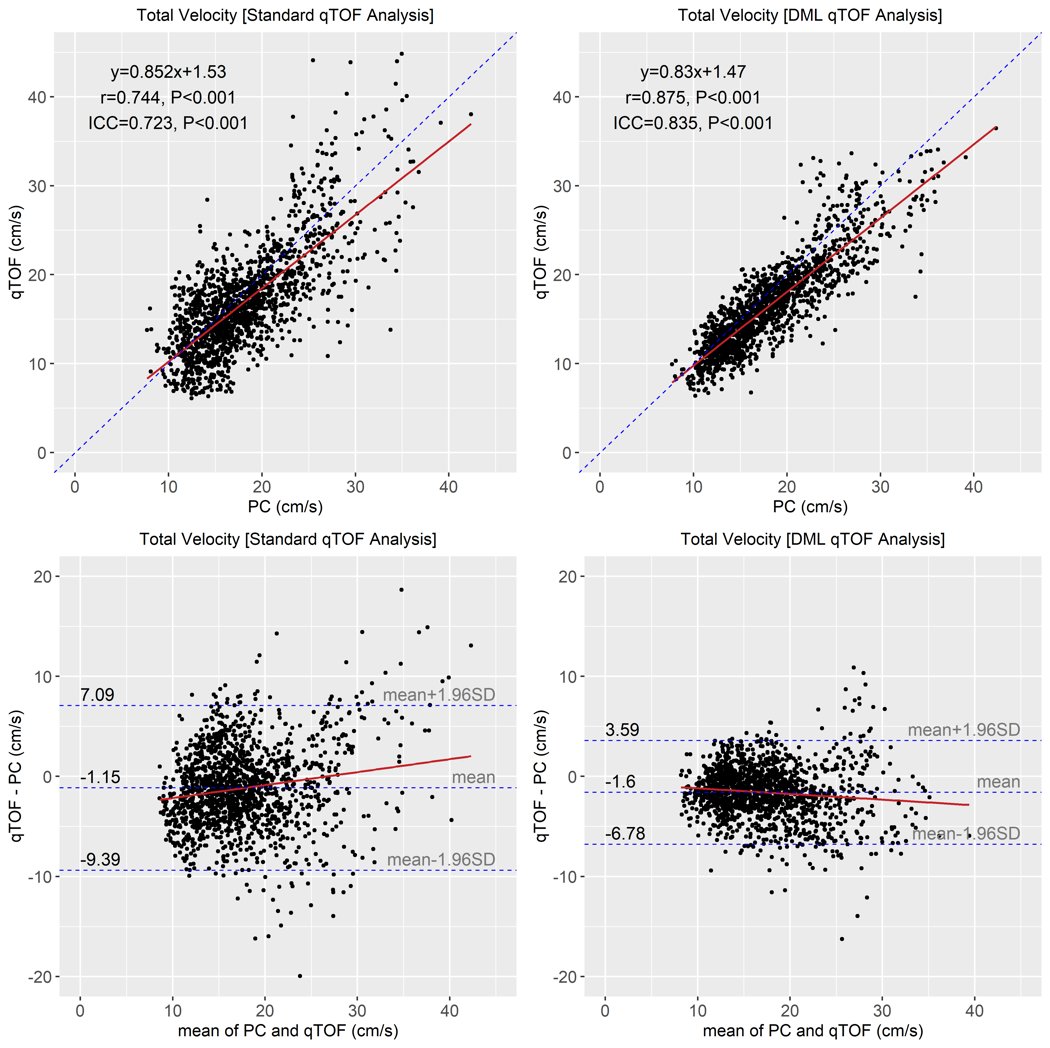
Figure 2.
Scatter
and Bland-Altman plots of total flow velocity obtained with qTOF
MRA using hand-crafted image analysis (left panels) and DML image analysis
(right panels). Note the improved agreement with phase contrast MRI and
narrower Bland-Altman limits of agreement obtained with DML image analysis.
DOI: https://doi.org/10.58530/2023/0937