0933
End-to-end Automation of Quantitative Processing for 4D Flow MRI in the Aorta: Demonstration and Evaluation in 271 Subjects1Northwestern University, Chicago, IL, United States, 2Ann & Robert H. Lurie Children's Hospital, Chicago, IL, United States
Synopsis
Keywords: Data Processing, Velocity & Flow, 4D Flow MRI, Quantitative Hemodynamics
A generalized data-processing pipeline tool for performing completely automated hemodynamic assessment from raw 4D flow MR images is presented. The tool is evaluated for performance in a group of 271 subjects with mixed distribution of healthy, valve disease, and connective-tissue disorder status. A high success rate of 94% is achieved for fully-automated quantification of regional aortic peak velocities and global aortic pulse wave velocity.Introduction
Time-resolved 3D phase-contrast (4D flow) MRI is a flexible technique that can measure and quantify cardiovascular hemodynamics. For example, 4D flow MRI can assess aortic peak velocities (Vmax), a critical metric for management of aortic valve stenosis, or aortic pulse wave velocity (PWV), which indicates aortic stiffness and is affected by aortopathy development/progression. However, the processing steps required to quantify clinically-relevant parameters such as Vmax or PWV require manual and cumbersome human input at several stages, from setting pre-processing parameters1 to segmenting the aorta/regions of interest. This poses a significant challenge for conducting large-cohort studies, as the resultant processing workload (20-30min./dataset) can become untenable. However, advances in AI-based segmentation techniques applied to 4D flow2,3 create opportunities to dramatically reduce the required amount of manual processing needed. Given that 4D flow processing tasks have uniform structure (fig.1), these AI tools can be incorporated into a pipeline framework that facilitates high-throughput, automated processing of 4D flow MRI. Here, we present a framework that fully-automates quantification of key clinical metrics from 4D flow MRI. Additionally, we present demonstration of performance with data from a mixed group of subjects acquired at two institutions.Methods
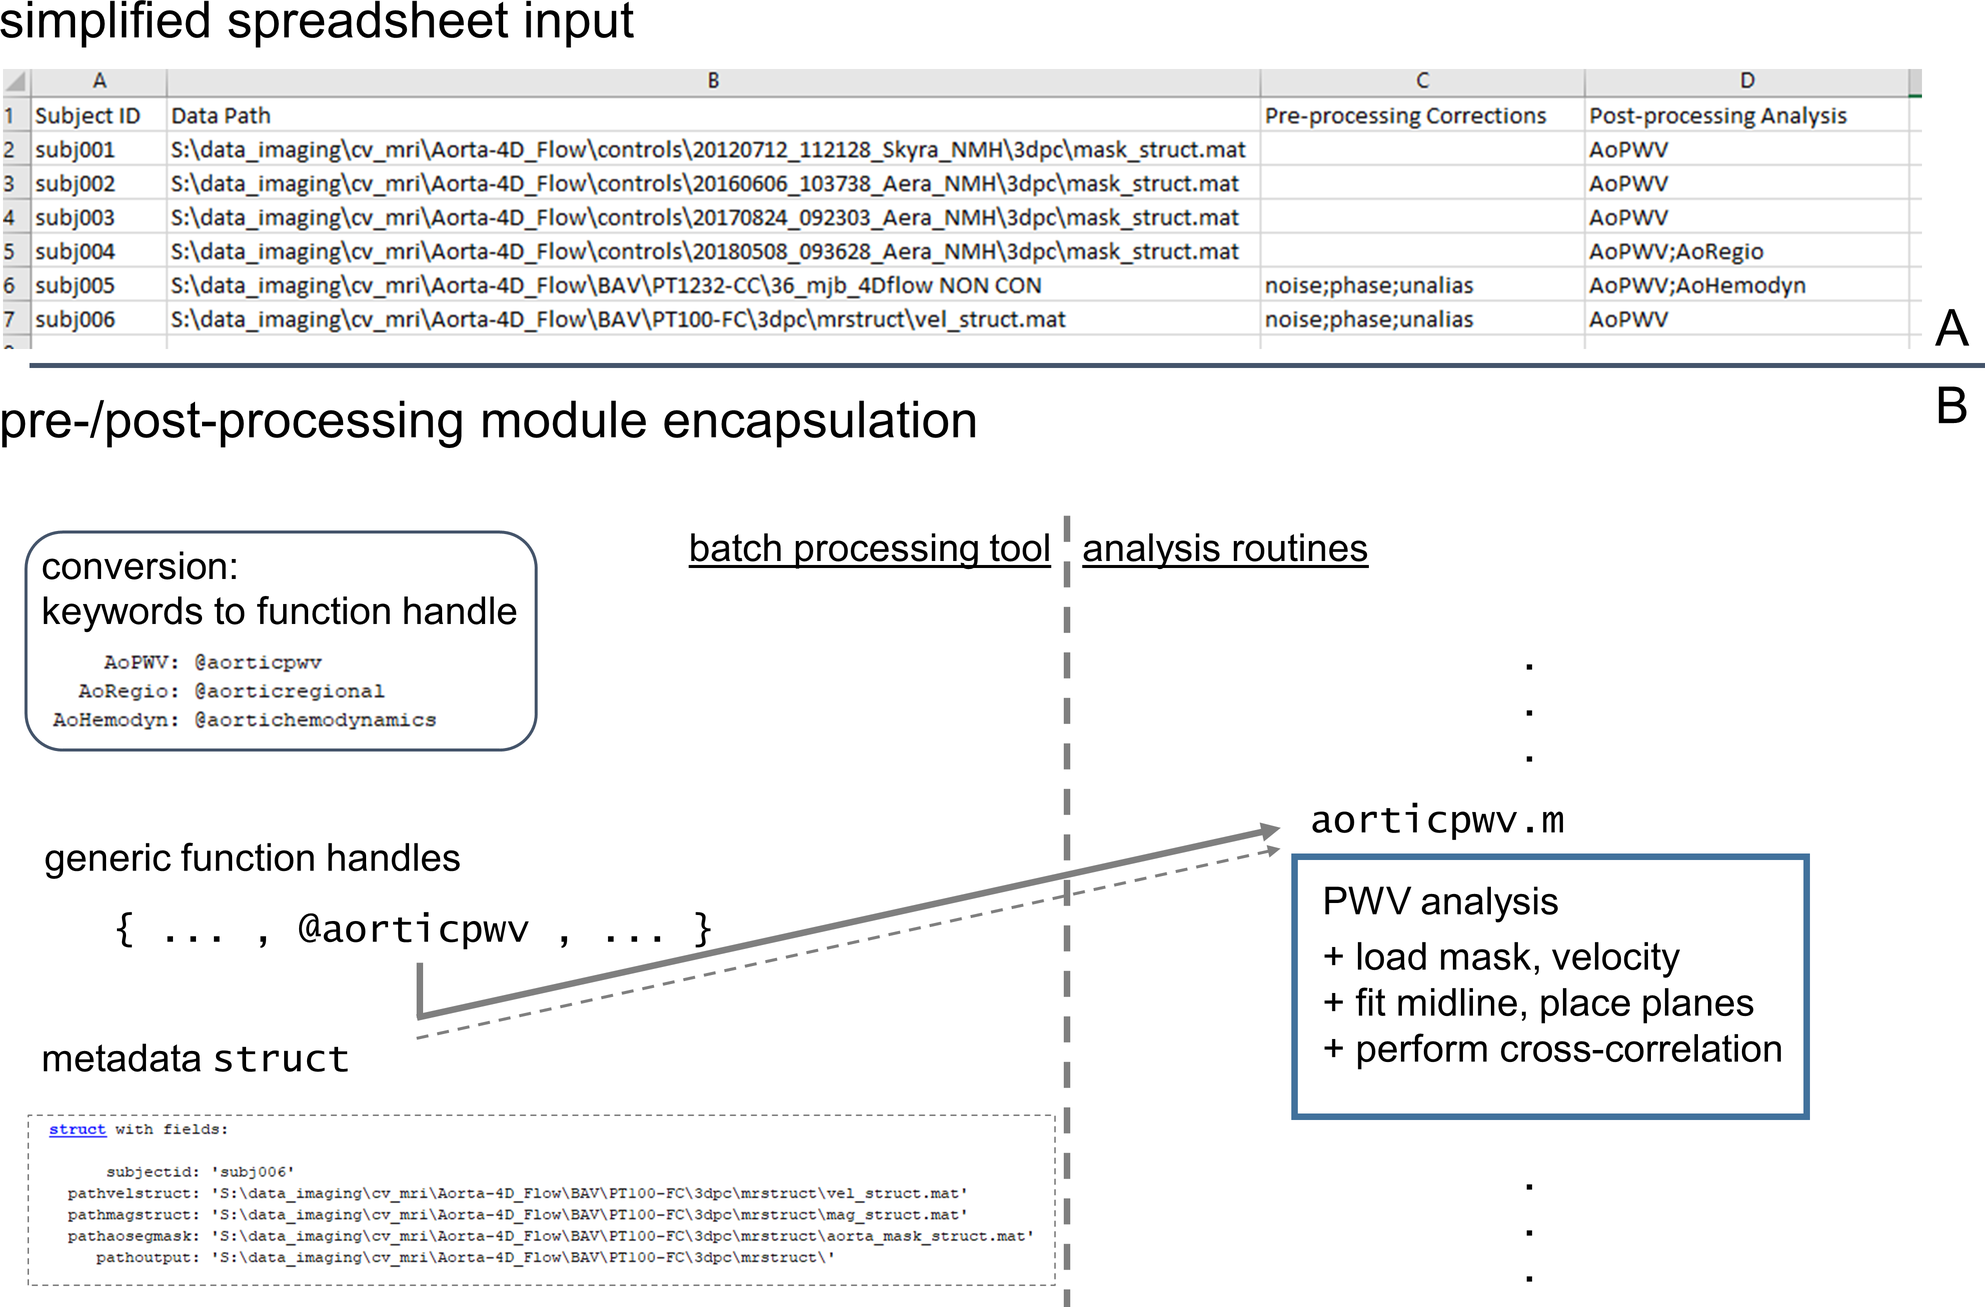
A general framework of processing for 4D flow MRI (fig.1) was constructed and implemented as a script that intakes a list of data to be processed (fig.2) and executes applicable processing. The tool included automated identification of required processing/analysis tasks (fig.1). Encapsulated routines for specific corrections/quantifications (e.g., noise-masking, un-aliasing, PWV estimation) were created, allowing generic handling of input-specified processing (fig.2). The input list format was structured to allow mixed processing of data, for example calculating PWV in one dataset, and completing full conversion/preprocessing/segmentation/postprocessing calculations in another dataset (fig.2). Additionally, a standardized data structure was used for storing four-dimensional magnitude/velocity data in a compact file format rather than thousands of single-slice/time-point DICOMs.Execution flow for the processing pipeline was structured to iterate through all subject datasets specified in the input list, and perform four basic tasks: (1) automatically determine what processing is required, (2) complete any/all preprocessing specified, (3) invoke AI-based aortic segmentation2 as needed, and (4) complete postprocessing steps specified (fig.2). Pre-processing procedures included options to employ parameterized phase-correction, noise-masking and un-aliasing1 using a single setting (all datasets) or to invoke fully-automated AI-based tools performing the same tasks3.
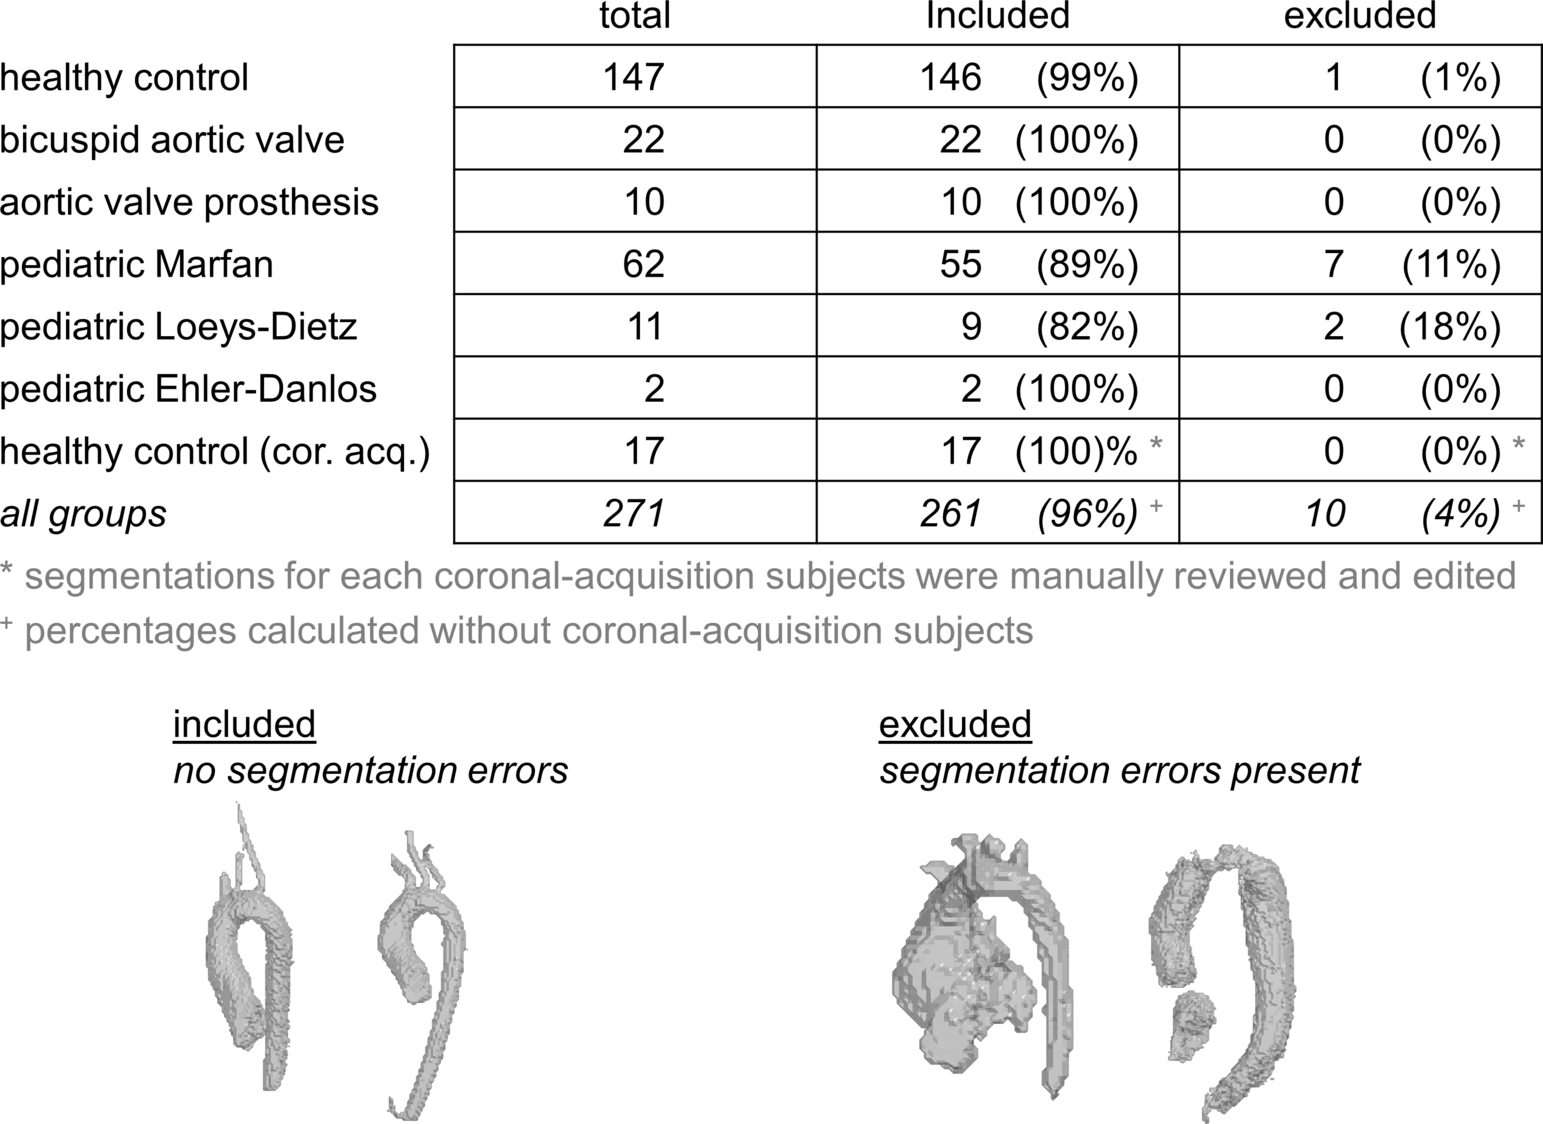
As demonstration of performance, a collection of data was processed using the tool, with datasets drawn from a variety of subject types (healthy controls, patients, adults, pediatric subjects) and acquired at multiple separate MR sites at two institutions (data being analyzed for multiple separate studies). All datasets had the complete set of processing steps applied, from DICOM conversion to postprocessing PWV and velocity analysis (fig.1), and all processed datasets were reviewed for segmentation errors and excluded if errors were noted (fig.3).
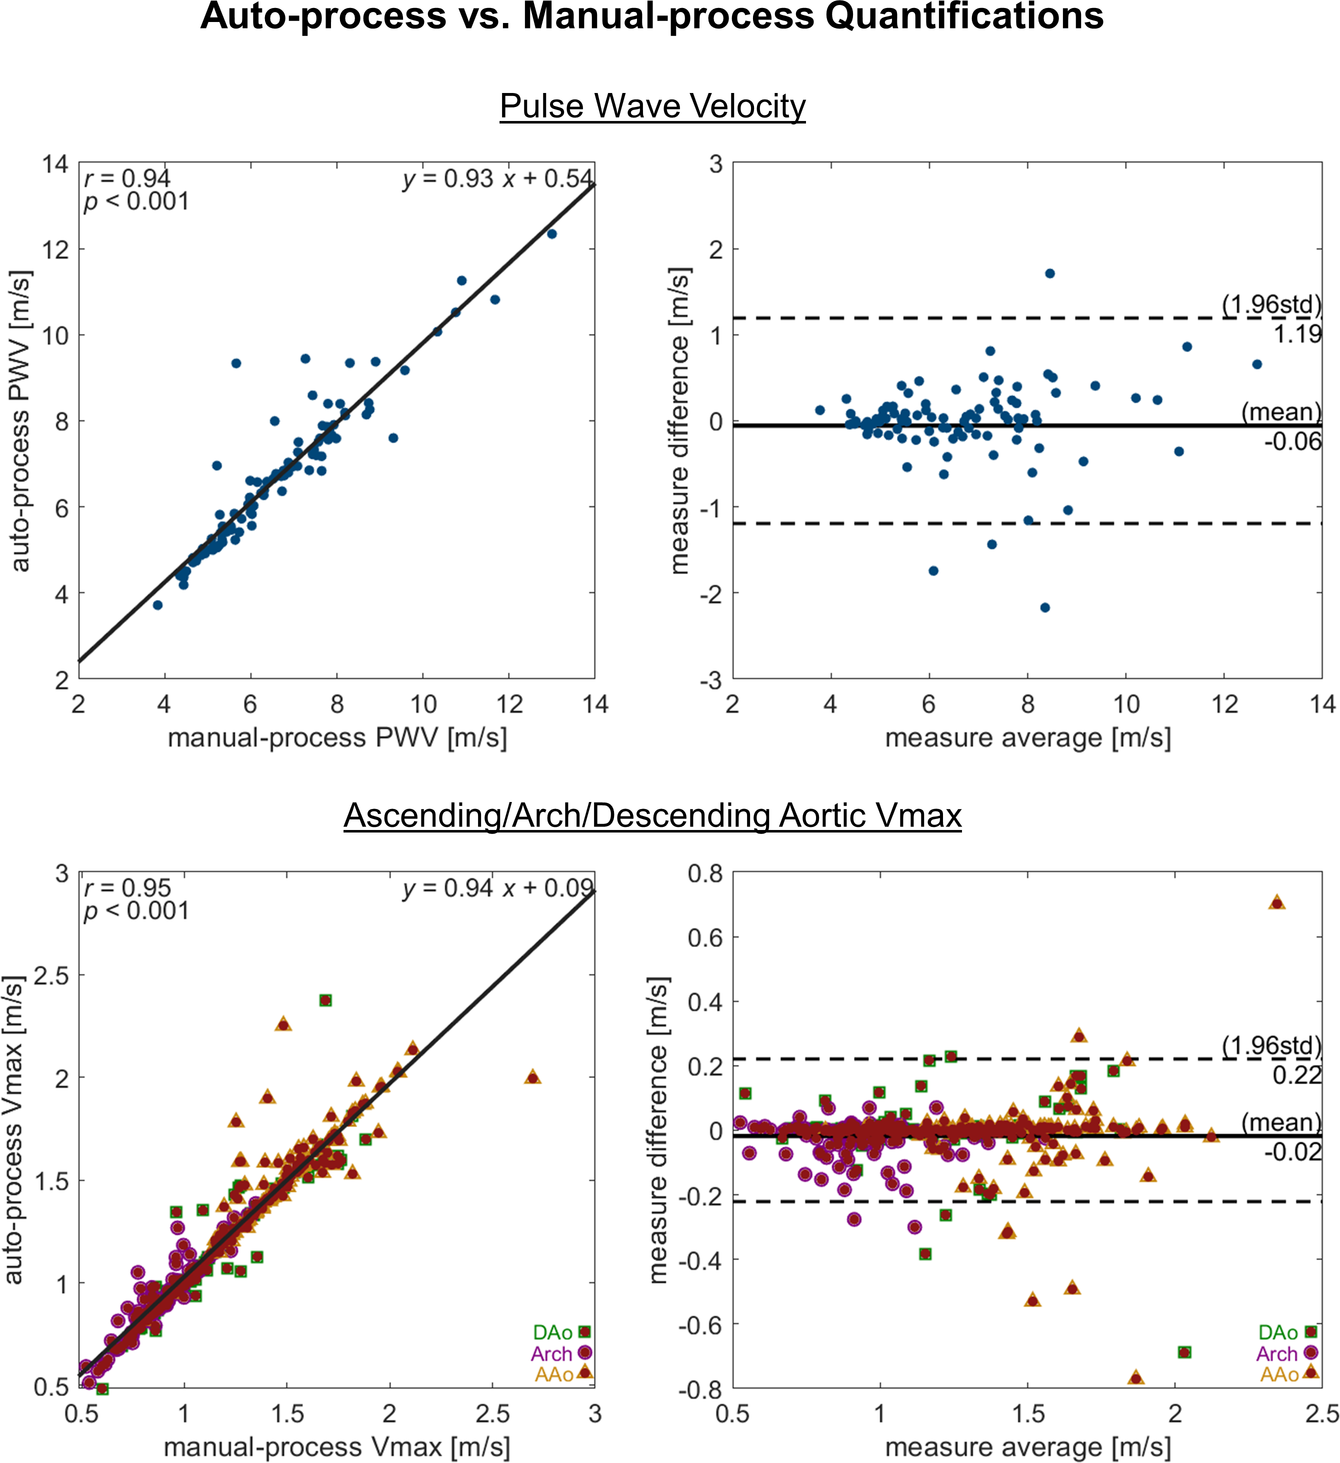
Data were acquired by prospective-/retrospectively-gated 4D flow sequence at 1.5T/3T, with resolution 1.5-2.5×1.5-2.5×1.5-4.5mm3/30-42ms, R=2-10 mixed GRAPPA/compressed-sensing/not, VENC 80-300cm/s. All datasets were acquired sagittal-oblique with thoracic aorta coverage, excepting one subgroup with coronal/whole-chest orientation/coverage. A different subgroup of controls (n=100) was processed manually, and PWV4 and regional Vmax5 were calculated for comparison to automated calculations. Correlation coefficients and Bland-Altman plots were generated to evaluate manual vs automated analysis results.
Results
In total, 271 datasets were processed, including data from 164 controls (17 coronal/whole-chest-acq.), 22 bicuspid aortic valve patients (mixed pediatric/adult), 10 aortic valve disease patients with mechanical prostheses, 62 pediatric Marfan Syndrome patients, 11 pediatric Loeys-Dietz Syndrome patients, 2 pediatric Ehler Danlos Syndrome patients. Of the total processed, 10 datasets had errors from segmentation failure, with net success rate 96% completely-automated processing (fig.3). Logged output and quality-check visualizations from the tool enabled quick identification and exclusion of datasets with processing issues (fig.3).In the manual/automated comparison cohort of healthy subjects, PWV measures had high correlation (R=0.94,p<0.001) and low mean difference (0.06m/s), with limits of agreement 1.19m/s. Regional aortic Vmax measures also had high correlation (R=0.95,p<0.001) and low mean difference (0.02m/s), with limits of agreement 0.22m/s.
Discussion
The simplified input structure and flexibility of processing specification allow for a wide range of applications of this tool, such as simply converting a large batch of DICOM images to a standardized data structure, or such as creating aortic segmentations and calculating a variety of hemodynamic parameters from 4D flow MRI data. In this demonstration, a high rate of successful complete automated processing was achieved. Furthermore, data excluded due to errors could potentially be re-processed manually in reduced time.Software-design principles of modularity/encapsulation were used to structure functionality, allowing the general framework to be extended to new applications, e.g., analyzing 4D flow MRI in the brain if tools for automated brain-vessel segmentation and flow quantification are created. Additionally, encapsulation allows for straightforward incorporation of updates to any component, such as a retrained AI for improved aortic segmentation.
Conclusion
This flexible tool for automating the full array of processing steps required for quantitative analysis of 4D flow MRI data enables construction of studies with cohort sizes in the hundreds to thousands of subjects. By minimizing the degree of user input at all stages of processing, the assembly of large-cohort 4D flow MRI datasets is made feasible and practicable.Acknowledgements
NIH R01HL115828, R01HL133504, P30AG059988References
1. Bock J, Kreher B, Hennig J, Markl M. Optimized pre-processing of time-resolved 2D and 3D phase contrast MRI data. In: Proceedings of the 15th Annual meeting of ISMRM, Berlin, Germany. 2007.
2. Berhane H, Scott M, Elbaz M, Jarvis K, McCarthy P, Carr J, et al. Fully automated 3D aortic segmentation of 4D flow MRI for hemodynamic analysis using deep learning. Magn Reson Med. 2020 Oct;84(4):2204–18.
3. Berhane H, Scott MB, Barker AJ, McCarthy P, Avery R, Allen B, et al. Deep learning–based velocity antialiasing of 4D‐flow MRI. Magnetic Resonance in Med. 2022 Jul;88(1):449–63.
4. Jarvis K, Soulat G, Scott M, Vali A, Pathrose A, Syed AA, et al. Investigation of Aortic Wall Thickness, Stiffness and Flow Reversal in Patients With Cryptogenic Stroke: A 4D Flow MRI Study. J Magn Reson Imaging. 2020 Aug 31;53(3):942–52.
5. Scott MB, Huh H, van Ooij P, Chen V, Herrera B, Elbaz M, et al. Impact of age, sex, and global function on normal aortic hemodynamics. Magn Reson Med. 2020 Oct;84(4):2088–102.
Figures
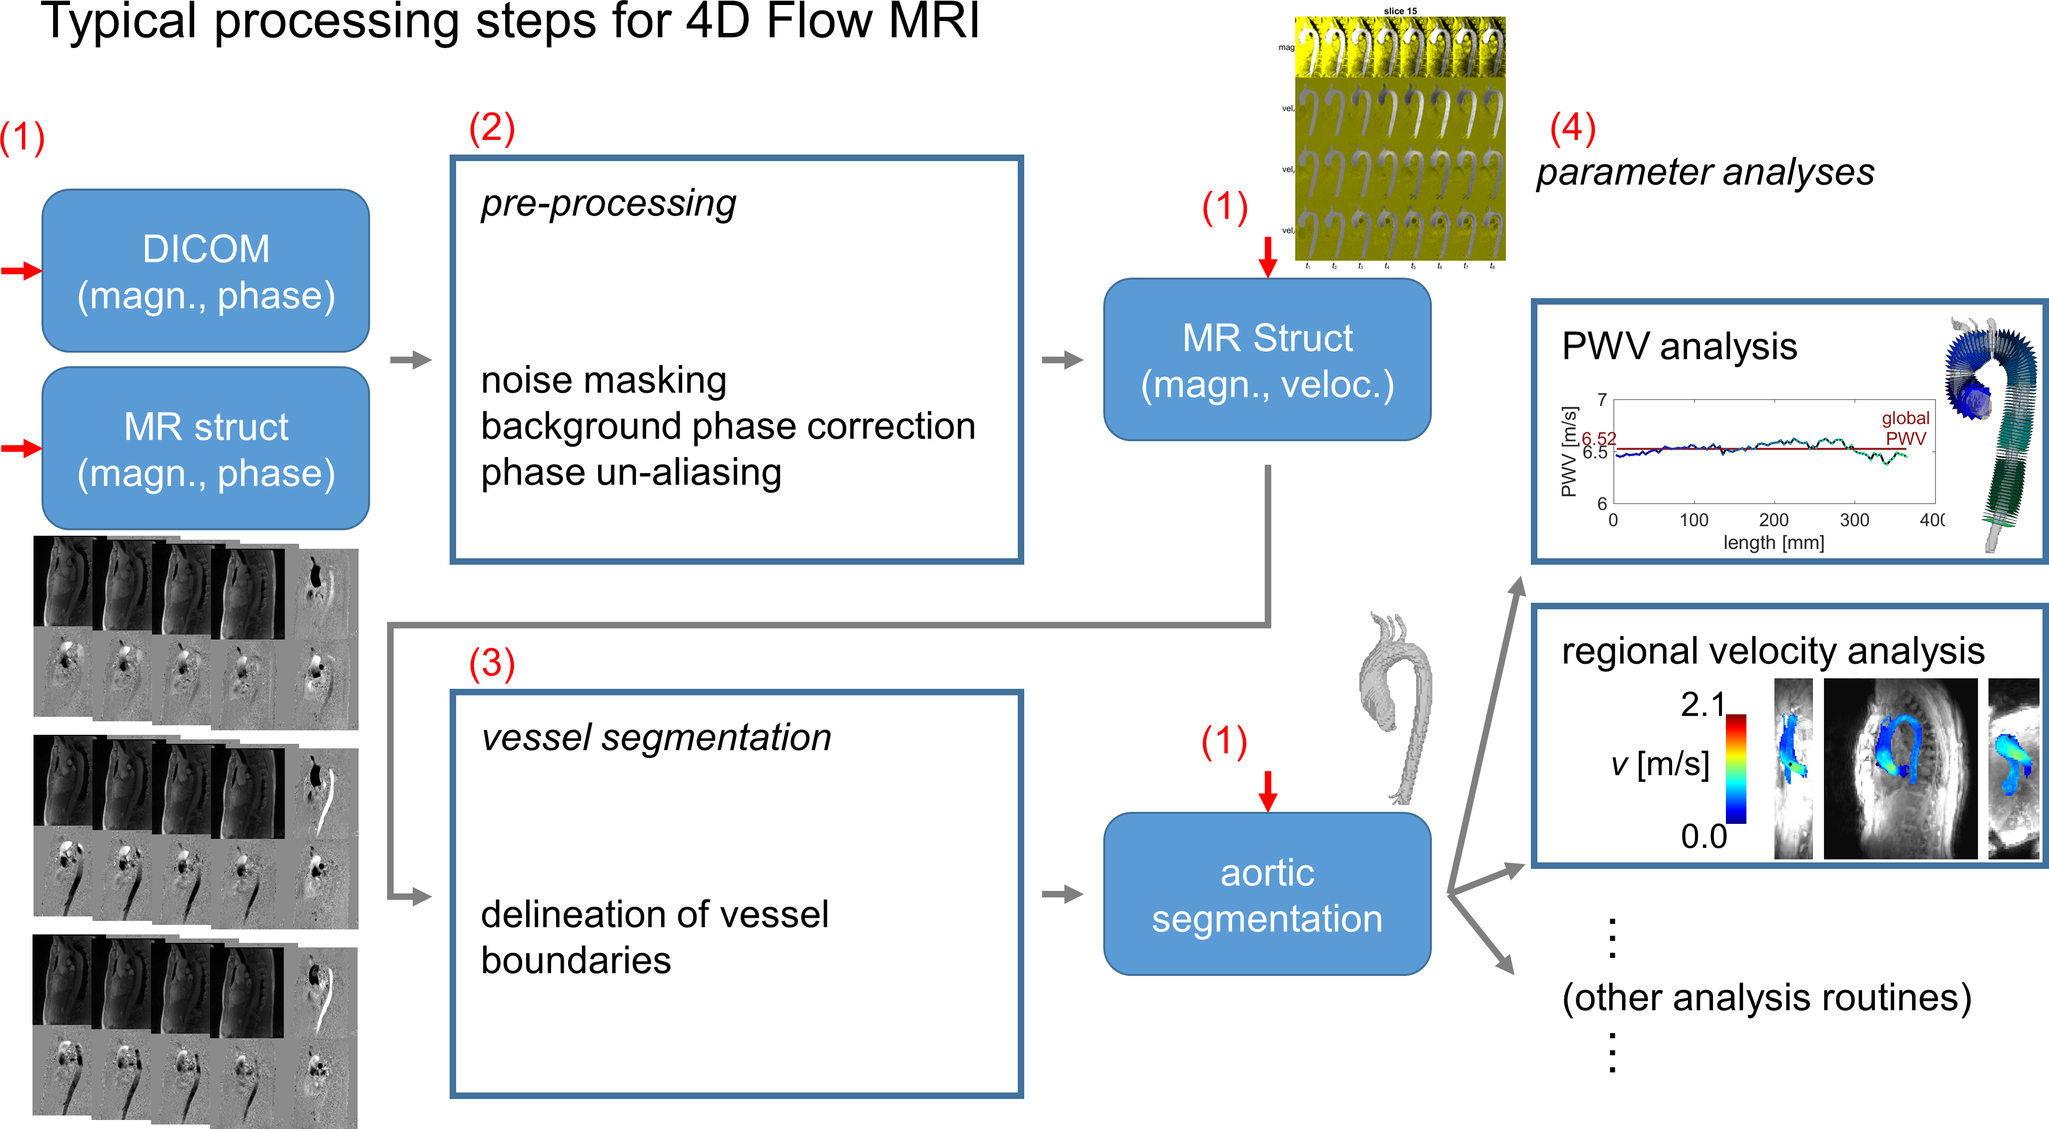
Fig.1. Preprocessing for 4D flow MRI follows a standard progression, with raw magnitude/phase data preprocessed before segmentation of vessels, followed by quantification of hemodynamic parameters (e.g., PWV, Vmax). Data are stored in a standardized data structure (MR struct). The processing pipeline framework presented here automatically determines the appropriate entry point (red arrows) for a given dataset and then proceeds along the rest of the progression to quantify hemodynamic parameters of interest with no user input (red numbers: tasks outlined in methods).