0932
Repeatability of whole aorta 4D flow pulse wave velocity in healthy volunteers and comparison with Marfan Syndrome patients1Radiology and Nuclear Medicine, Amsterdam UMC, Amsterdam, Netherlands, 2Cardiology, Amsterdam UMC, Amsterdam, Netherlands, 3Medical Biochemistry, Amsterdam UMC, Amsterdam, Netherlands, 4Cardiology, Radboud University Medical Center, Nijmegen, Netherlands, 5Cardiology, Leiden University Medical Center, Leiden, Netherlands, 6Cardiology, University Medical Center Groningen, Groningen, Netherlands, 7Clinical Epidemiology, Amsterdam UMC, Amsterdam, Netherlands
Synopsis
Keywords: Flow, Velocity & Flow, Pulse Wave Velocity
Pulse wave velocity (PWV) is a well-established measure to evaluate vessel wall stiffness and increases in the aorta of patients with Marfan Syndrome (MFS). With sufficient temporal resolution, 4D-flow MRI can be used for PWV calculations. In this study, we assess the repeatability of aortic PWV calculations in healthy volunteers using an open-source software tool and apply it in a MFS cohort. Our results show high repeatability of global aortic PWV, elevated PWV in MFS patients, and an association between elevated PWV and biomarkers for advanced disease.Introduction
Marfan Syndrome (MFS) is an inheritable connective tissue disorder, with aortic wall degeneration resulting in aneurysm formation and dissection as a major manifestation1. Aortic wall degeneration results in a loss of elasticity and thus an increase in arterial stiffness2, which is independently associated with aortic disease progression in MFS3 and can be measured using Pulse Wave Velocity (PWV)4. As PWV measurements require a high temporal resolution, 4D-flow MRI PWV measurements have for long not been possible due to time constraints. However, due to the development of acceleration techniques and advanced image reconstruction techniques yielding higher temporal resolution, the use of 4D-flow MRI for PWV is increasingly reported5-7.This study aimed to analyze the repeatability of 4D-flow MRI aortic PWV using a semi-automated tool and assess its application in a MFS cohort.Methods
Fifteen healthy volunteers (age 29 ± 5 years, 8(53%) women) underwent three aortic 4D-flow MRI examinations on a 3T system (Ingenia, Philips Healthcare, Best, Netherlands), with an accelerated undersampled pseudo-spiral acquisition pattern using Prospective Undersampling in Multiple Dimensions and reconstructed using compressed sensing8: two scans in one session (V1 and V2) and a subsequent scan after 14 ± 2 days (V3). Scan parameters were TE/TR/FA=2.4ms/4.9ms/8°, VENC=150 cm/s, 1.5mm isotropic acquired/reconstructed spatial resolution, scan duration ~8:30 min.45 MFS patients (age 36 ± 9 years, 22(49%) women, 25 (56%) with a native aortic root) underwent a single 4D-flow MRI examination with TE/TR/FA = 4.1ms/2.1ms/8°, VENC=150-250 cm/s, 2.5mm isotropic acquired/reconstructed spatial resolution, scan duration ~4:15 min.
All datasets were reconstructed using ReconFrame (Gyrotools, Zurich, Switzerland) and the Berkeley Advanced Reconstruction Toolbox (see Figure 1 for typical images reconstructed) to a fixed temporal resolution of 20ms9.
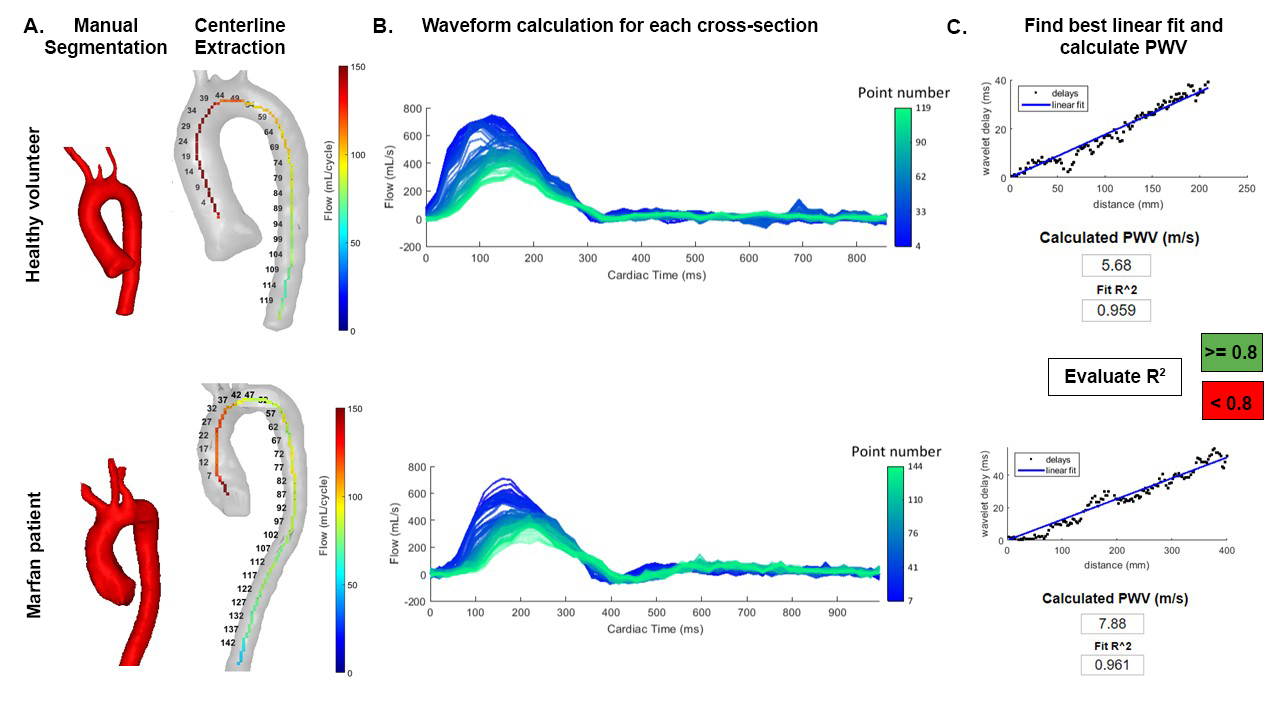
PWV measurements were completed using a previously described open-source Matlab-based app (R2021b, Mathworks, MA, USA)10, 11. Briefly, the tool performs data loading and pre-defined manual aortic segmentation loading, automatic velocity corrections12 and aorta centerline extraction. Combined with the aortic segmentation, orthogonal cross-sections extracted from the centerline are used to automatically measure flow along the aorta. PWV is subsequently calculated by analyzing the flow waveforms using a wavelet cross-spectrum analysis13. The cross-section with the optimal linear fit for the calculated delay times is automatically selected for the PWV calculation (Figure 2). A regression coefficient of variation R2≥0.8 was defined as a sufficiently good fit for accurate PWV; only PWV values above this cut-off value were used for comparison between healthy volunteers and patients.
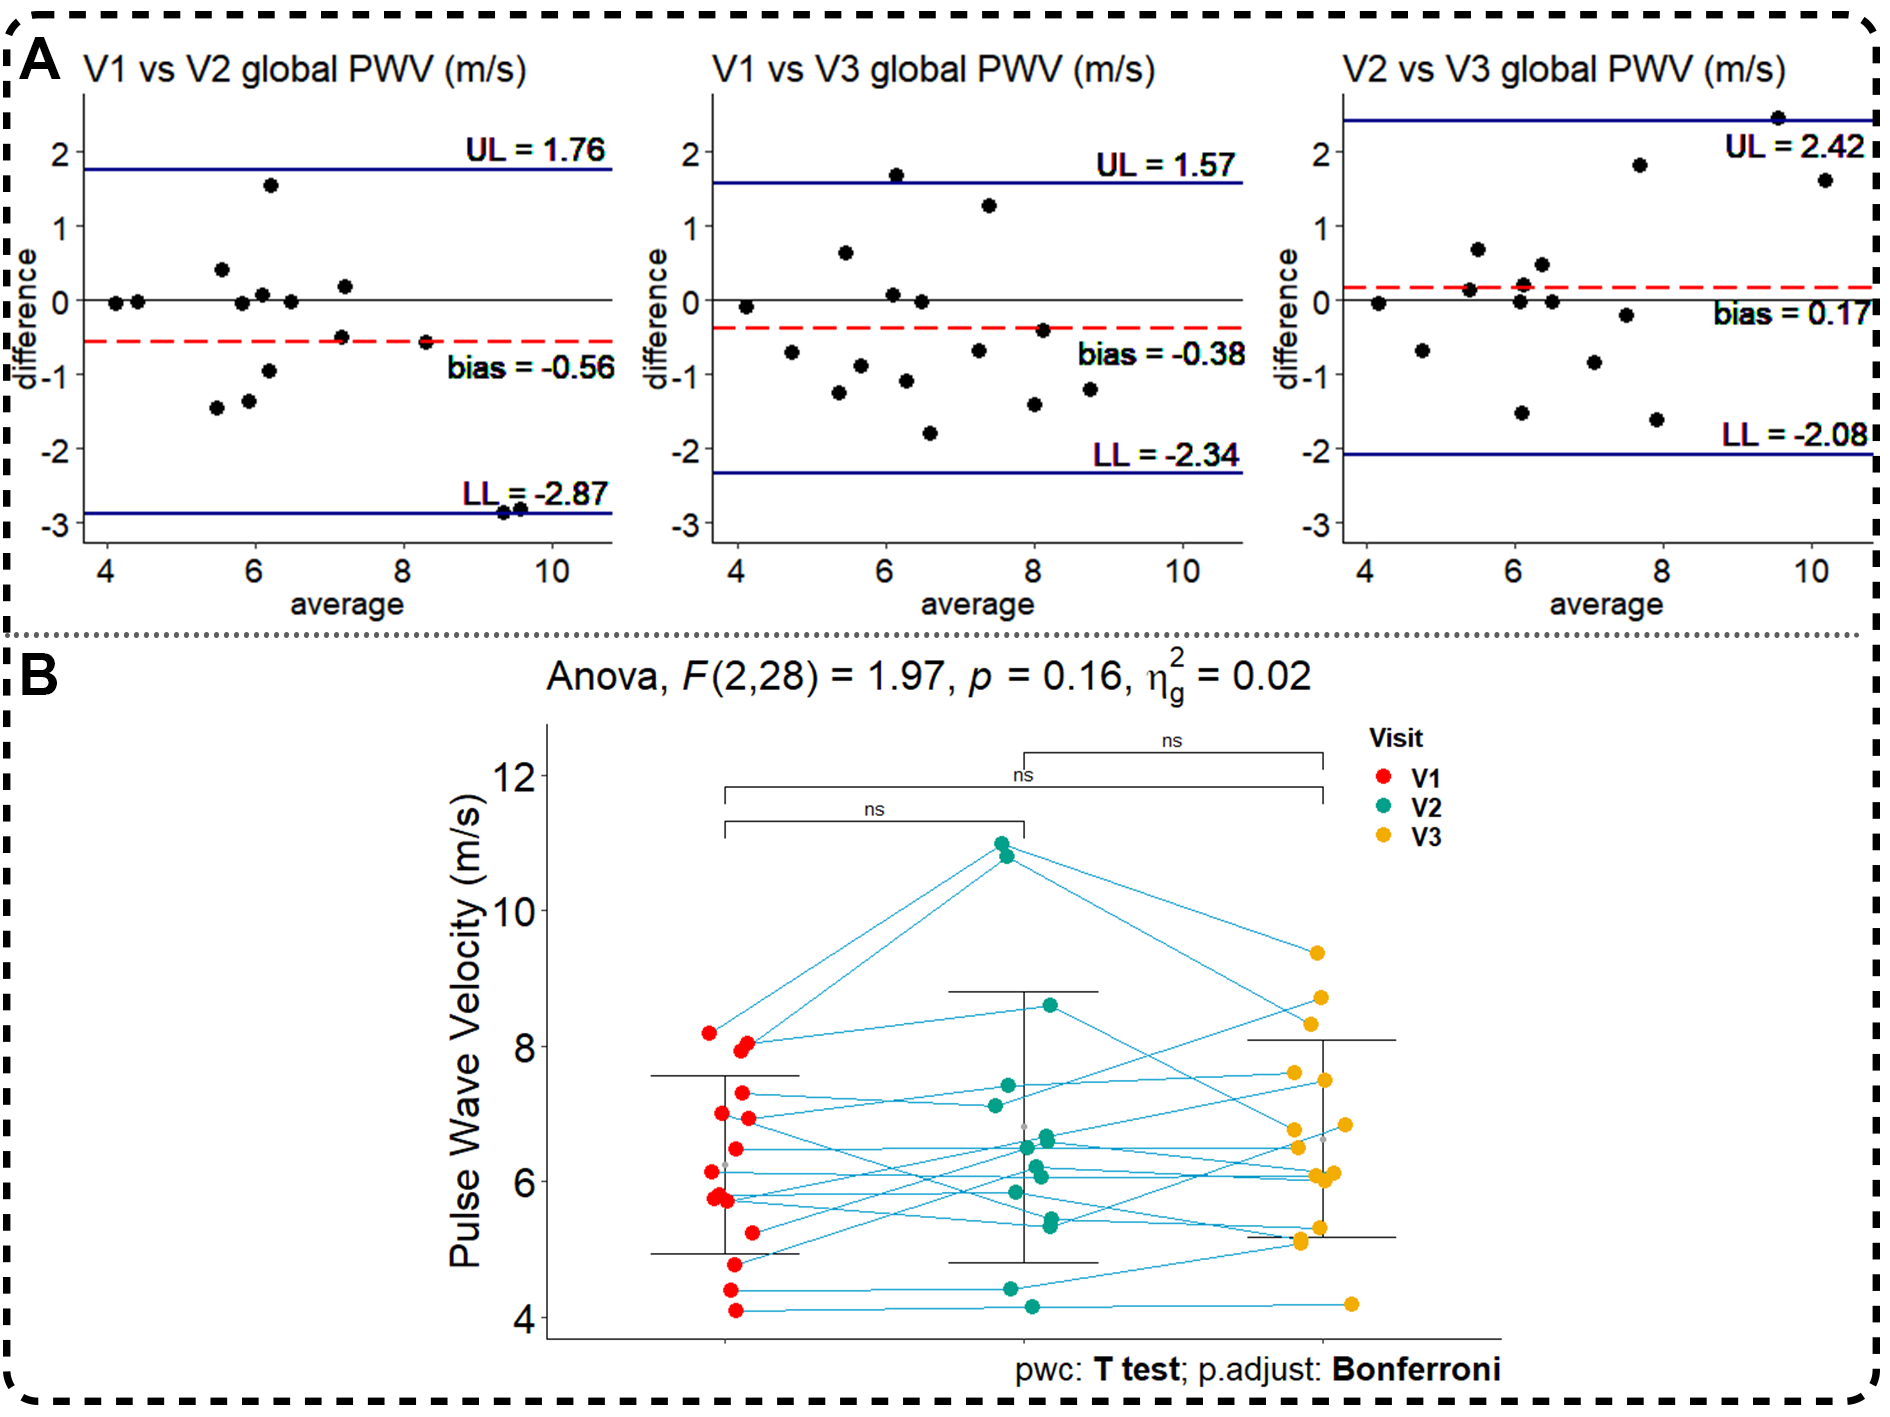
Statistical analysis was performed with Rstudio (v4.0.3) and IBM SPSS statistics (v28). To determine repeatability (see Figure 2A for definitions) of PWV, one-way repeated measures ANOVA and pairwise comparison with Bonferroni correction was performed. Data was visualized with the mean and standard deviation errors bars and Bland-Altman plots and the bias and 95% limits of agreement were defined.
T-tests were used to identify differences between groups and hierarchical multiple regression was used to identify age and blood pressure adjusted differences in PWV between patients and healthy controls. Spearman’s ρ correlation coefficient was used to identify correlations between PWV and baseline characteristics.
Results
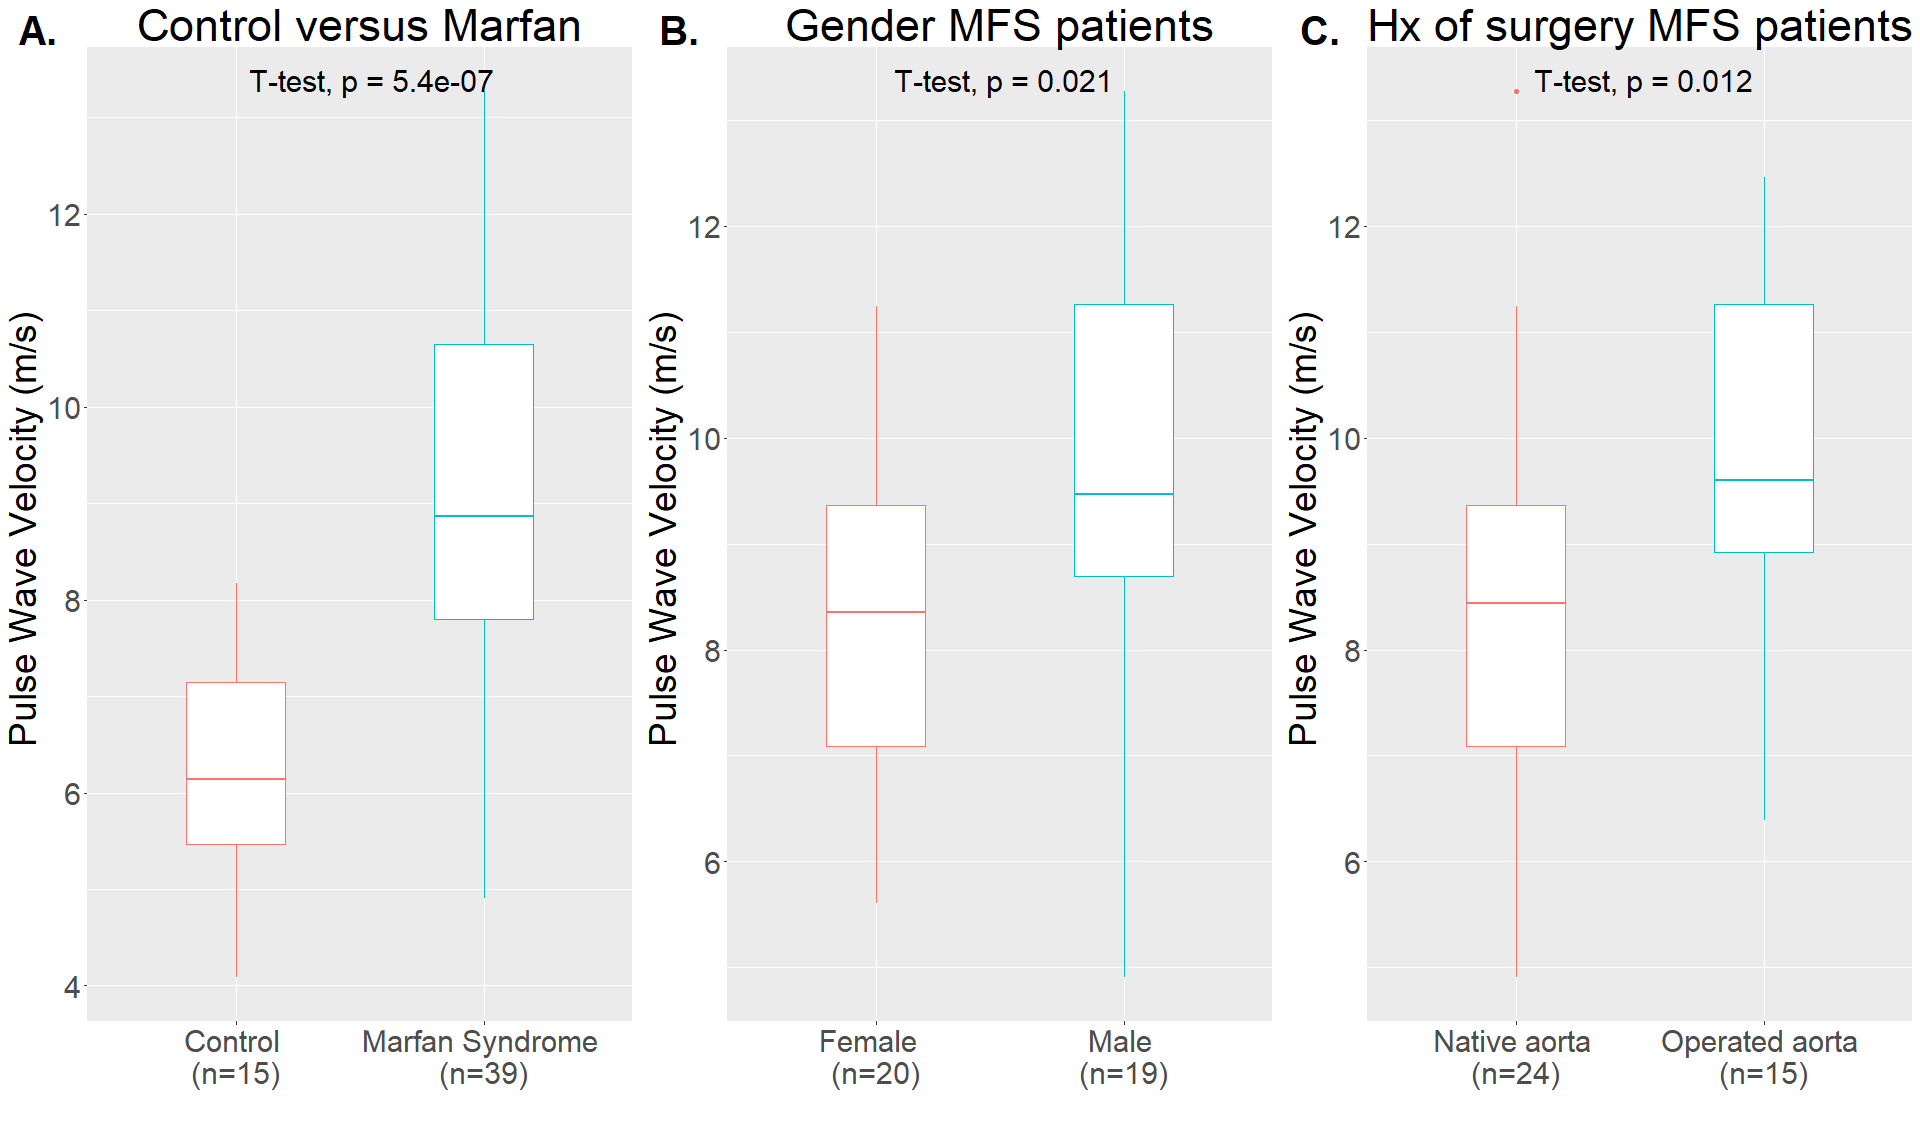
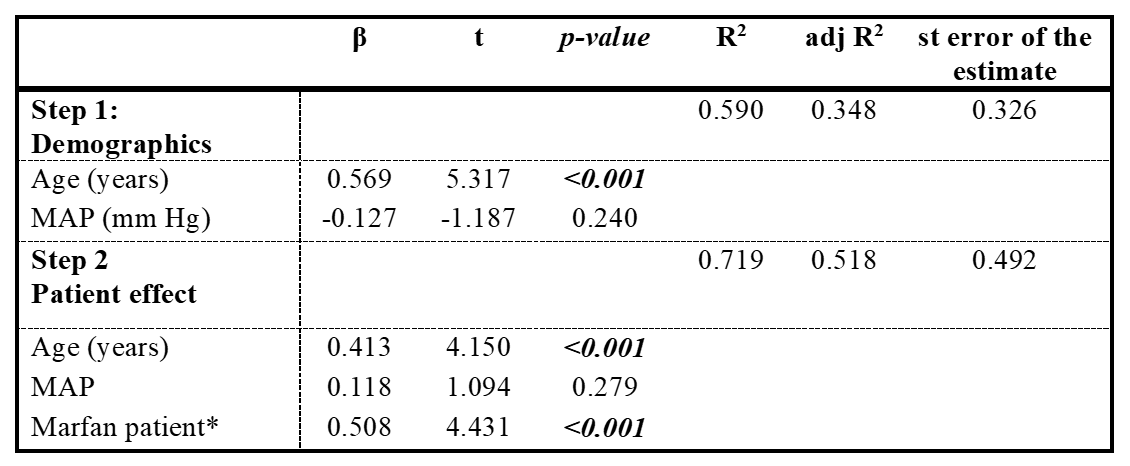
PWV did not differ between the three 4D-flow MRI scans in healthy volunteers (F(2,28)=1.97, p=0.16) and pairwise comparisons with Bonferroni correction showed no significant differences (Figure 3).PWV could reliably be calculated (R2 > 0.8) in 39 (87%) of the MFS patients. Mean PWV (m/s) was significantly higher in MFS patients as compared to healthy controls, 9.02 ± 1.97 versus 6.25 ± 1.31, p<0.001 (Figure 4). This difference remained significant after adjusting for age and mean arterial pressure in the hierarchical multiple regression analysis (Table 1).
PWV (m/s) was significantly higher for male MFS patients (9.76 ± 2.12 versus 8.32 ± 1.57, p=0.021) and for patients who had undergone aortic root surgery in the past (9.98 ± 1.69 versus 8.42 ± 1.91, p=0.012). Furthermore, using Spearman’s ρ correlation coefficient, a positive correlation between PWV and age was found (rs=0.466, n=39, p=0.003).
Discussion
In the current study, we calculated PWV with a dataset with a high temporal resolution of 20ms and required a good fit of the PWV regression line for accurate measurements. Using these criteria, we acquired repeatable PWV results for the entire aorta within one scan session and over a two-week period. Using a 4D-flow dataset for reliable PWV measurements has some major benefits: it can be acquired in a single imaging session without the need for time consuming manual cross-section selection, which is required for 2D phase-contrast MRI14, and the same dataset can be used to calculate other promising hemodynamic biomarkers for aortic disease, such as wall shear stress15. However, not all MFS aortas gave a good fit of the PWV line, possibly due to 4D-flow data quality and the complex aortic geometry in the MFS aortas.Conclusion
Physiological variation of PWV is minimal across a two-week period and can be repeatability measured using 4D-flow MRI PWV and an open-source tool. Additionally, we can confirm previous work that PWV is elevated in MFS and that elevated PWV is associated with operated MFS aortas. Future research should focus on correlating PWV with disease progression in longitudinal studies and on improving the PWV tool to reliably calculate regional PWV14.Acknowledgements
This study is part of the project "Comprehensive assessment of 4D thoracic aorta biomechanics using novel cardiac MRI technology" with project number 18402 of the research programme "Applied and Engineering Sciences", which is partly financed by the Dutch Research Council (NWO).References
1. Grewal N, Gittenberger-de Groot AC. Pathogenesis of aortic wall complications in Marfan syndrome. Cardiovasc Pathol. 2018;33:62-9.
2. Davies JI, Struthers AD. Pulse wave analysis and pulse wave velocity: a critical review of their strengths and weaknesses. Journal of Hypertension. 2003;21(3):463-72.
3. Mortensen K, Aydin MA, Rybczynski M, Baulmann J, Schahidi NA, Kean G, et al. Augmentation index relates to progression of aortic disease in adults with Marfan syndrome. Am J Hypertens. 2009;22(9):971-9.
4. Kim EJ, Park CG, Park JS, Suh SY, Choi CU, Kim JW, et al. Relationship between blood pressure parameters and pulse wave velocity in normotensive and hypertensive subjects: invasive study. Journal of Human Hypertension. 2007;21(2):141-8.
5. Harloff A, Mirzaee H, Lodemann T, Hagenlocher P, Wehrum T, Stuplich J, et al. Determination of aortic stiffness using 4D flow cardiovascular magnetic resonance - a population-based study. Journal of Cardiovascular Magnetic Resonance. 2018;20(1):43.
6. Jarvis K, Scott MB, Soulat G, Elbaz MSM, Barker AJ, Carr JC, et al. Aortic Pulse Wave Velocity Evaluated by 4D Flow MRI Across the Adult Lifespan. J Magn Reson Imaging. 2022;56(2):464-73.
7. Houriez-Gombaud-Saintonge S, Mousseaux E, Bargiotas I, De Cesare A, Dietenbeck T, Bouaou K, et al. Comparison of different methods for the estimation of aortic pulse wave velocity from 4D flow cardiovascular magnetic resonance. J Cardiovasc Magn Reson. 2019;21(1):75.
8. Gottwald LM, Peper ES, Zhang Q, Coolen BF, Strijkers GJ, Nederveen AJ, et al. Pseudo-spiral sampling and compressed sensing reconstruction provides flexibility of temporal resolution in accelerated aortic 4D flow MRI: A comparison with k-t principal component analysis. NMR Biomed. 2020;33(4):e4255.
9. Uecker M TJ. J. mrirecon/bart: version 0.5.00. (2019) doi:10.5281/ZENODO.3376744. 2019.
10. Schrauben E, van Andel M, Gottwald L, Nederveen A, Groenink M, van Ooij P. A Pulse Wave Velocity Calculation Tool for 4D flow MRI–Data Requirements and Application in Marfan Patients. ISMRM; Online 2021. Poster Nr. 2091.
11. Schrauben E. . 4D Flow PWV Tool [Computer software]. 2022.https://github.com/schrau24/4DFlowPWVTool
12. Fischer C, Wetzl J, Schaeffter T, Giese D. Fully automated background phase correction using M-estimate SAmple consensus (MSAC)-Application to 2D and 4D flow. Magn Reson Med. 2022;88(6):2709-17.
13. Bargiotas I, Mousseaux E, Yu WC, Venkatesh BA, Bollache E, de Cesare A, et al. Estimation of aortic pulse wave transit time in cardiovascular magnetic resonance using complex wavelet cross-spectrum analysis. J Cardiovasc Magn Reson. 2015;17(1):65.
14. Mura J, Sotelo J, Mella H, Wong J, Hussain T, Ruijsink B, et al. Non-invasive local pulse wave velocity using 4D-flow MRI. Biomedical Signal Processing and Control. 2022;71:103259.
15. Guala A, Teixido-Tura G, Dux-Santoy L, Granato C, Ruiz-Muñoz A, Valente F, et al. Decreased rotational flow and circumferential wall shear stress as early markers of descending aorta dilation in Marfan syndrome: a 4D flow CMR study. J Cardiovasc Magn Reson. 2019;21(1):63.
Figures