0929
Impact of regularization factor on quantification of flow and turbulence in highly undersampled 4D flow MRI
Pietro Dirix1, Stefano Buoso1, Valery Vishnevskiy1, and Sebastian Kozerke1
1University and ETH Zurich, Zürich, Switzerland
1University and ETH Zurich, Zürich, Switzerland
Synopsis
Keywords: Flow, Image Reconstruction
We investigate the impact of regularization on the quantification of flow and turbulence in highly undersampled data. To overcome the uncertainties due to the lack of ground truth, patient-specific aortic geometry and inflow conditions were extracted from in-vivo 2D cine and 2D phase-contrast MRI and used to generate synthetic personalized ground truth flow fields. Simulation results were embedded into the corresponding patient-specific 4D flow MRI effectively resulting in personalized synthetic datasets with known aortic ground truth and realistic background. The reconstruction of multiple undersampled datasets showed two distinct optimal regularization ranges for the quantification of flow velocities and turbulence.Introduction
Accurate quantification of velocity and turbulence of aortic flow using 4D flow MRI is critical to improve the diagnosis of aortic stenosis1. Highly undersampled acquisitions allow to reduce scan times2, but pose several challenges in data reconstruction, where a large impact of the choice of regularization parameters is observed on the resulting phase and magnitude values. Commonly, a single regularization term is selected for both phase and magnitude3,4, however, optimal reconstructions require different regularization weights depending on the target quantities5,6. These investigations were based on either fully sampled in-vivo data lacking ground truth values of flow7 or idealized numerical phantoms with limited ability in mimicking realistic acquisitions5. Here we synthesize stenotic aortic flow ground truth from patient-specific MRI scans and embed the data back into the patient’s 4D flow MRI. Prospective undersampling and reconstruction are used to investigate the impact of the regularization term on quantification of velocity and turbulent kinetic energy (TKE).Methods
A 13-point 5D flow MRI (Figure 1a.1) was acquired (2.5x2.5x2.5mm3, $$$V_{enc}=1.5,3ms^{-1}$$$, 20 cardiac phases) using pseudo-spiral Cartesian k-space filling and respiratory binning, resulting in an effective undersampling factor R=14. Cine 2D images (Figure 1a.2) of the ascending aorta were acquired using balanced SSFP protocols (1x1x5mm3) perpendicular to the aortic centerline. Time-resolved 2D velocity vector data (Figure 1a.3) were measured downstream of the aortic valve using phase-contrast (PC) spoiled gradient-echo protocols (1.5x1.5x8mm3). Spatiotemporal segmentation of the aortic lumen (Figure 1b.1) and inflow (Figure 1b.2), flow simulations (Figure 1c) and synthesis of 4D flow MRI (Figure 1d and 1e) were performed following Dirix et al.8. The synthetic 4D flow MRI foreground was embedded into the patient-specific 5D flow background, effectively creating ground-truth data (Figure 1f). Retrospective undersampling matching the original 5D flow dataset was achieved using pseudo-spiral Cartesian k-space filling masks (Figure 1g)2. Finally, the synthetic undersampled data was reconstructed (Figure 1h) using a locally low-rank approach (LLR) and Bayesian unfolding of multi-venc acquisitions was used to cast velocities U and Reynolds stress tensors RST (Figure 1i)8. LLR reconstruction was achieved by solving the following convex optimization problem9:$$I=\underset{I}{\arg\min}||\Omega\mathcal{F}CI-S||^2_2+\lambda\Sigma||P_bI||_*$$where $$$I$$$ is is the reconstructed image, $$$\Omega$$$ is the undersampling operator, $$$\mathcal{F}$$$ is the Fourier operator, $$$C$$$ are the coil sensitivities, $$$S$$$ is the zero filled k-space data, $$$P_b$$$ refers to the bth patch and $$$\lambda$$$ is the LLR regularization weight. Turbulent kinetic energy (TKE) and integrated turbulence kinetic energy (iTKE) were computed from the diagonal of the reconstructed RST:$$TKE=\frac{1}{2}(RST_{xx}+RST_{yy}+RST_{zz})\;\;[Jm^{-3}]$$$$iTKE=\int_{\Omega}TKE\,dV\;\;[mJ]$$Similarly, kinetic energy (KE) and integrated kinetic energy (iKE) were computed from the reconstructed velocity U:$$KE=\frac{\rho}{2}(U_x^2+U_y^2+U_z^2)\;\;[Jm^{-3}]$$$$iKE=\int_{\Omega}KE\,dV\;\;[mJ]$$Error metrics were computed using the structural similarity index measure (SSIM) and the normalized root mean square error (NRMSE) with respect to the fully sampled reference.Results
Reconstructed velocity maps are presented in Figure 2. Under-regularized maps of velocity ($$$\lambda_{1 \rightarrow 5}$$$) show large patches of unphysiological flow with an integrated KE overestimation of up to 3.4 times when compared to the fully sampled reference. Intermediate regularization values $$$\lambda_{7}$$$ and $$$\lambda_{8}$$$ give the best reconstruction of velocity fields, with peak integrated KE errors of -9% and -32%, respectively. Further increasing the regularization worsens reconstruction (see $$$\lambda_{10}$$$).Contours of reconstructed TKE maps are presented in Figure 3. Large patches of unphysiological TKE are present in under-regularized maps ($$$\lambda_{1 \rightarrow 5}$$$) with an overestimation of integrated TKE of up to 21.8 times for the lower values of regularization. In velocity maps, larger regularization terms tend to yield lower estimations of TKE. Depending on the error metric, the best reconstructions are obtained with $$$\lambda_{8}$$$ and $$$\lambda_{9}$$$ , with peak integrated TKE errors of 380% and 340%, respectively. Reconstructed velocity and turbulence maps for the in-vivo case are presented in Figure 4. Synthetic data and the original 4D flow MRI reconstruction are contrasted in Figure 5. When compared to the synthetic dataset, the 4D flow MRI data presents a peak integrated KE error of 48% and peak integrated TKE error of 136%.Discussion
We have built personalized aortic stenosis twins by embedding synthetic patient-specific ground-truth values into in-vivo background data. This approach enhances realism, in comparison to previous approaches, for testing performance of image reconstruction. From the integrated KE plots, an optimal regularization value between $$$\lambda_{6}$$$ and $$$\lambda_{7}$$$ would best reproduce the fully sampled results. Similarly, regularization values ~$$$\lambda_{9}$$$ would be more appropriate for TKE quantification. Optimal values differ significantly for velocity and turbulence quantification, suggesting that single approaches are insufficient for combined analysis of velocity and turbulence. This study also demonstrates that good quality reconstructions of velocity can be achieved for highly undersampled data with appropriate values. This is further confirmed by comparison with in-vivo data, where regularization behaves as predicted from the synthetic data, close similarities in integrated KE plots are observed, and qualitative similarities are observed in the structure of the stenotic jet. Reconstructed TKE maps, on the other hand, present significant overestimation when compared to the fully sampled ground truth, rendering the analysis of turbulence using highly undersampled 4D flow datasets particularly uncertain. Increasing regularization does improve TKE quantification but errors remain >100%. Comparison between in-vivo data and synthetic data might suggest that in-vivo acquisitions and MRI imperfections further accentuate overestimation of TKE.Acknowledgements
No acknowledgement found.References
- Garcia J, Barker AJ, Markl M. The role of imaging of flow patterns by 4D flow MRI in aortic stenosis. JACC: Cardiovascular Imaging. 2019 Feb;12(2):252-66.
- Peper ES, Gottwald LM, Zhang Q, Coolen BF, van Ooij P, Nederveen AJ, Strijkers GJ. Highly accelerated 4D flow cardiovascular magnetic resonance using a pseudo-spiral Cartesian acquisition and compressed sensing reconstruction for carotid flow and wall shear stress. Journal of Cardiovascular Magnetic Resonance. 2020 Dec;22(1):1-5.
- Walheim J, Dillinger H, Kozerke S. Multipoint 5D flow cardiovascular magnetic resonance-accelerated cardiac-and respiratory-motion resolved mapping of mean and turbulent velocities. Journal of Cardiovascular Magnetic Resonance. 2019 Dec;21(1):1-3.
- Walheim, Jonas, et al. "5D flow tensor MRI to efficiently map Reynolds stresses of aortic blood flow in-vivo." Scientific Reports 9.1 (2019): 1-12.
- Santelli C, Loecher M, Busch J, Wieben O, Schaeffter T, Kozerke S. Accelerating 4D flow MRI by exploiting vector field divergence regularization. Magnetic resonance in medicine. 2016 Jan;75(1):115-25.
- Ong F, Cheng JY, Lustig M. General phase regularized reconstruction using phase cycling. Magnetic resonance in medicine. 2018 Jul;80(1):112-25.
- Braig M, Menza M, Leupold J, LeVan P, Feng L, Ko CW, von Zur Mühlen C, Krafft AJ, Hennig J, von Elverfeldt D. Analysis of accelerated 4D flow MRI in the murine aorta by radial acquisition and compressed sensing reconstruction. NMR in Biomedicine. 2020 Nov;33(11):e4394.
- Dirix P, Buoso S, Peper ES, Kozerke S. Synthesis of patient-specific multipoint 4D flow MRI data of turbulent aortic flow downstream of stenotic valves. Scientific reports. 2022 Sep 26;12(1):1-1.
- Zhang T, Pauly JM, Levesque IR. Accelerating parameter mapping with a locally low rank constraint. Magnetic resonance in medicine. 2015 Feb;73(2):655-61.
Figures
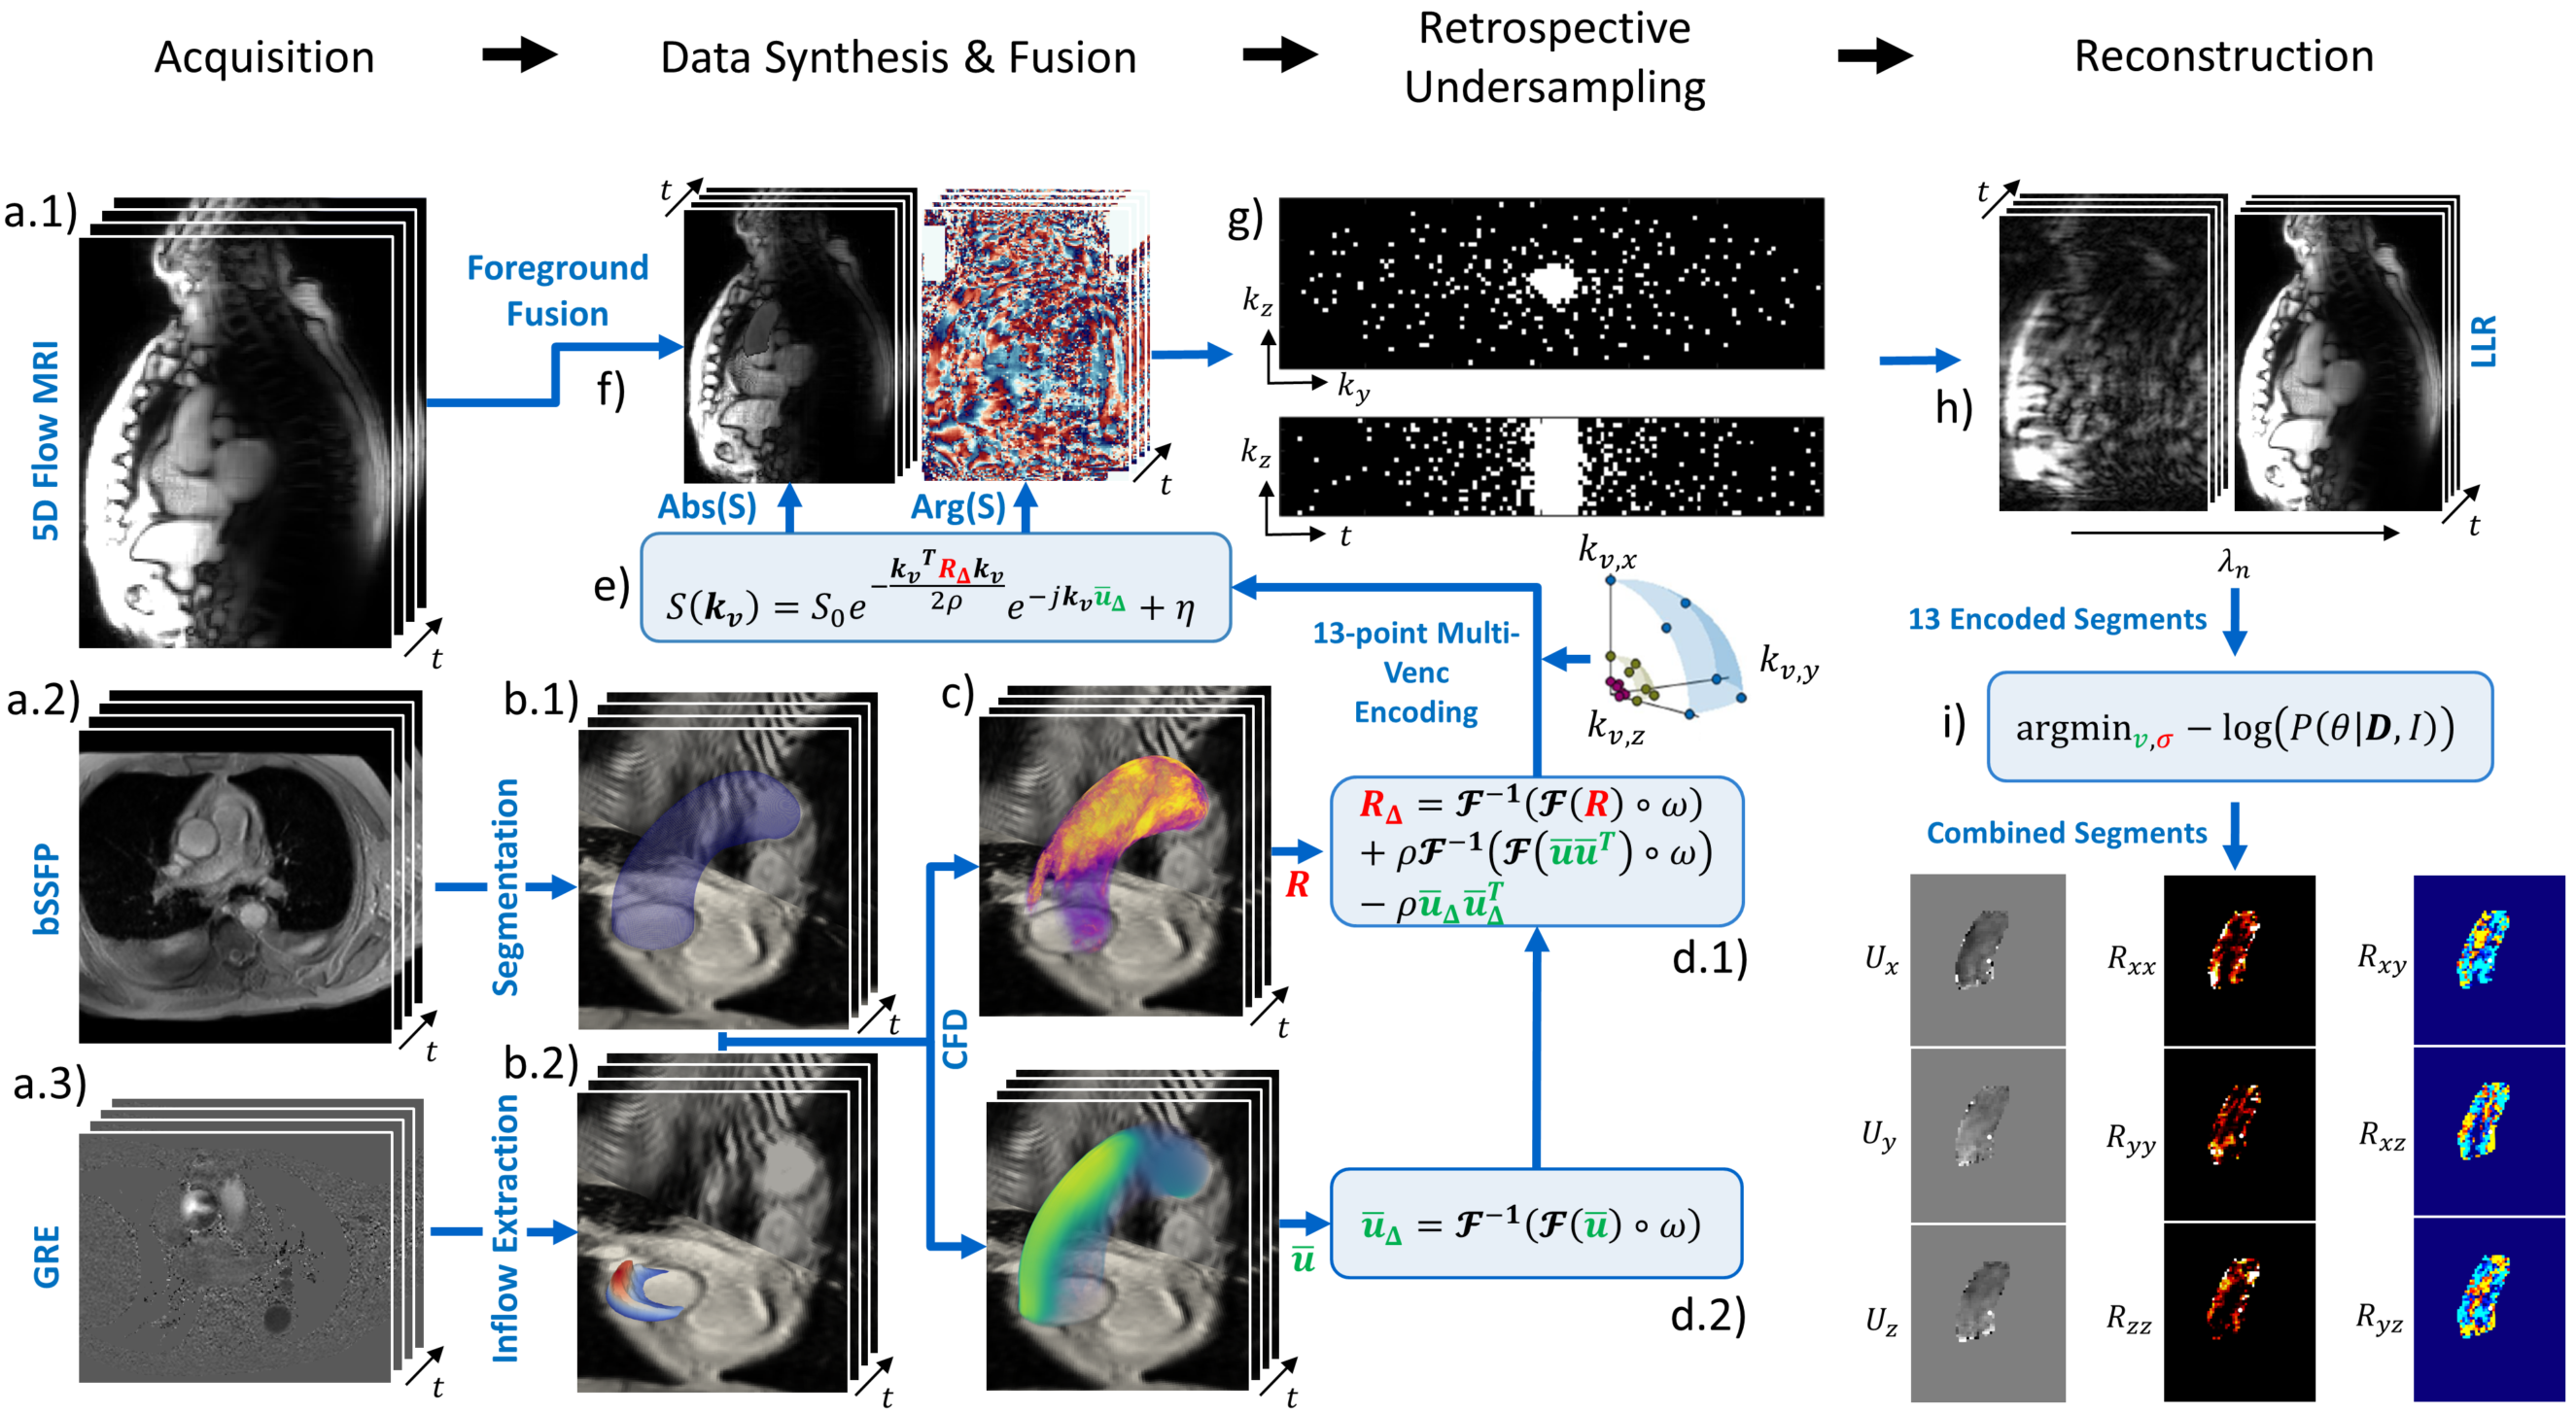
Figure 1: Pipeline to generate personalized synthetic aortic flow datasets. a) Acquisition of the MR dataset. b) Aortic lumen segmentation and inflow extraction. c) Large Eddy Simulation of turbulent flow. d) Bandwidth-limited projection of U and RST. e) Synthesis of 4D flow tensor MRI signal S. f) Fusion of synthetic foreground with measured background g) Retrospective undersampling with pseudo-spiral Cartesian k-space filling. h) LLR reconstruction of undersampled data. i) Bayesian combination of multi-venc reconstructions.
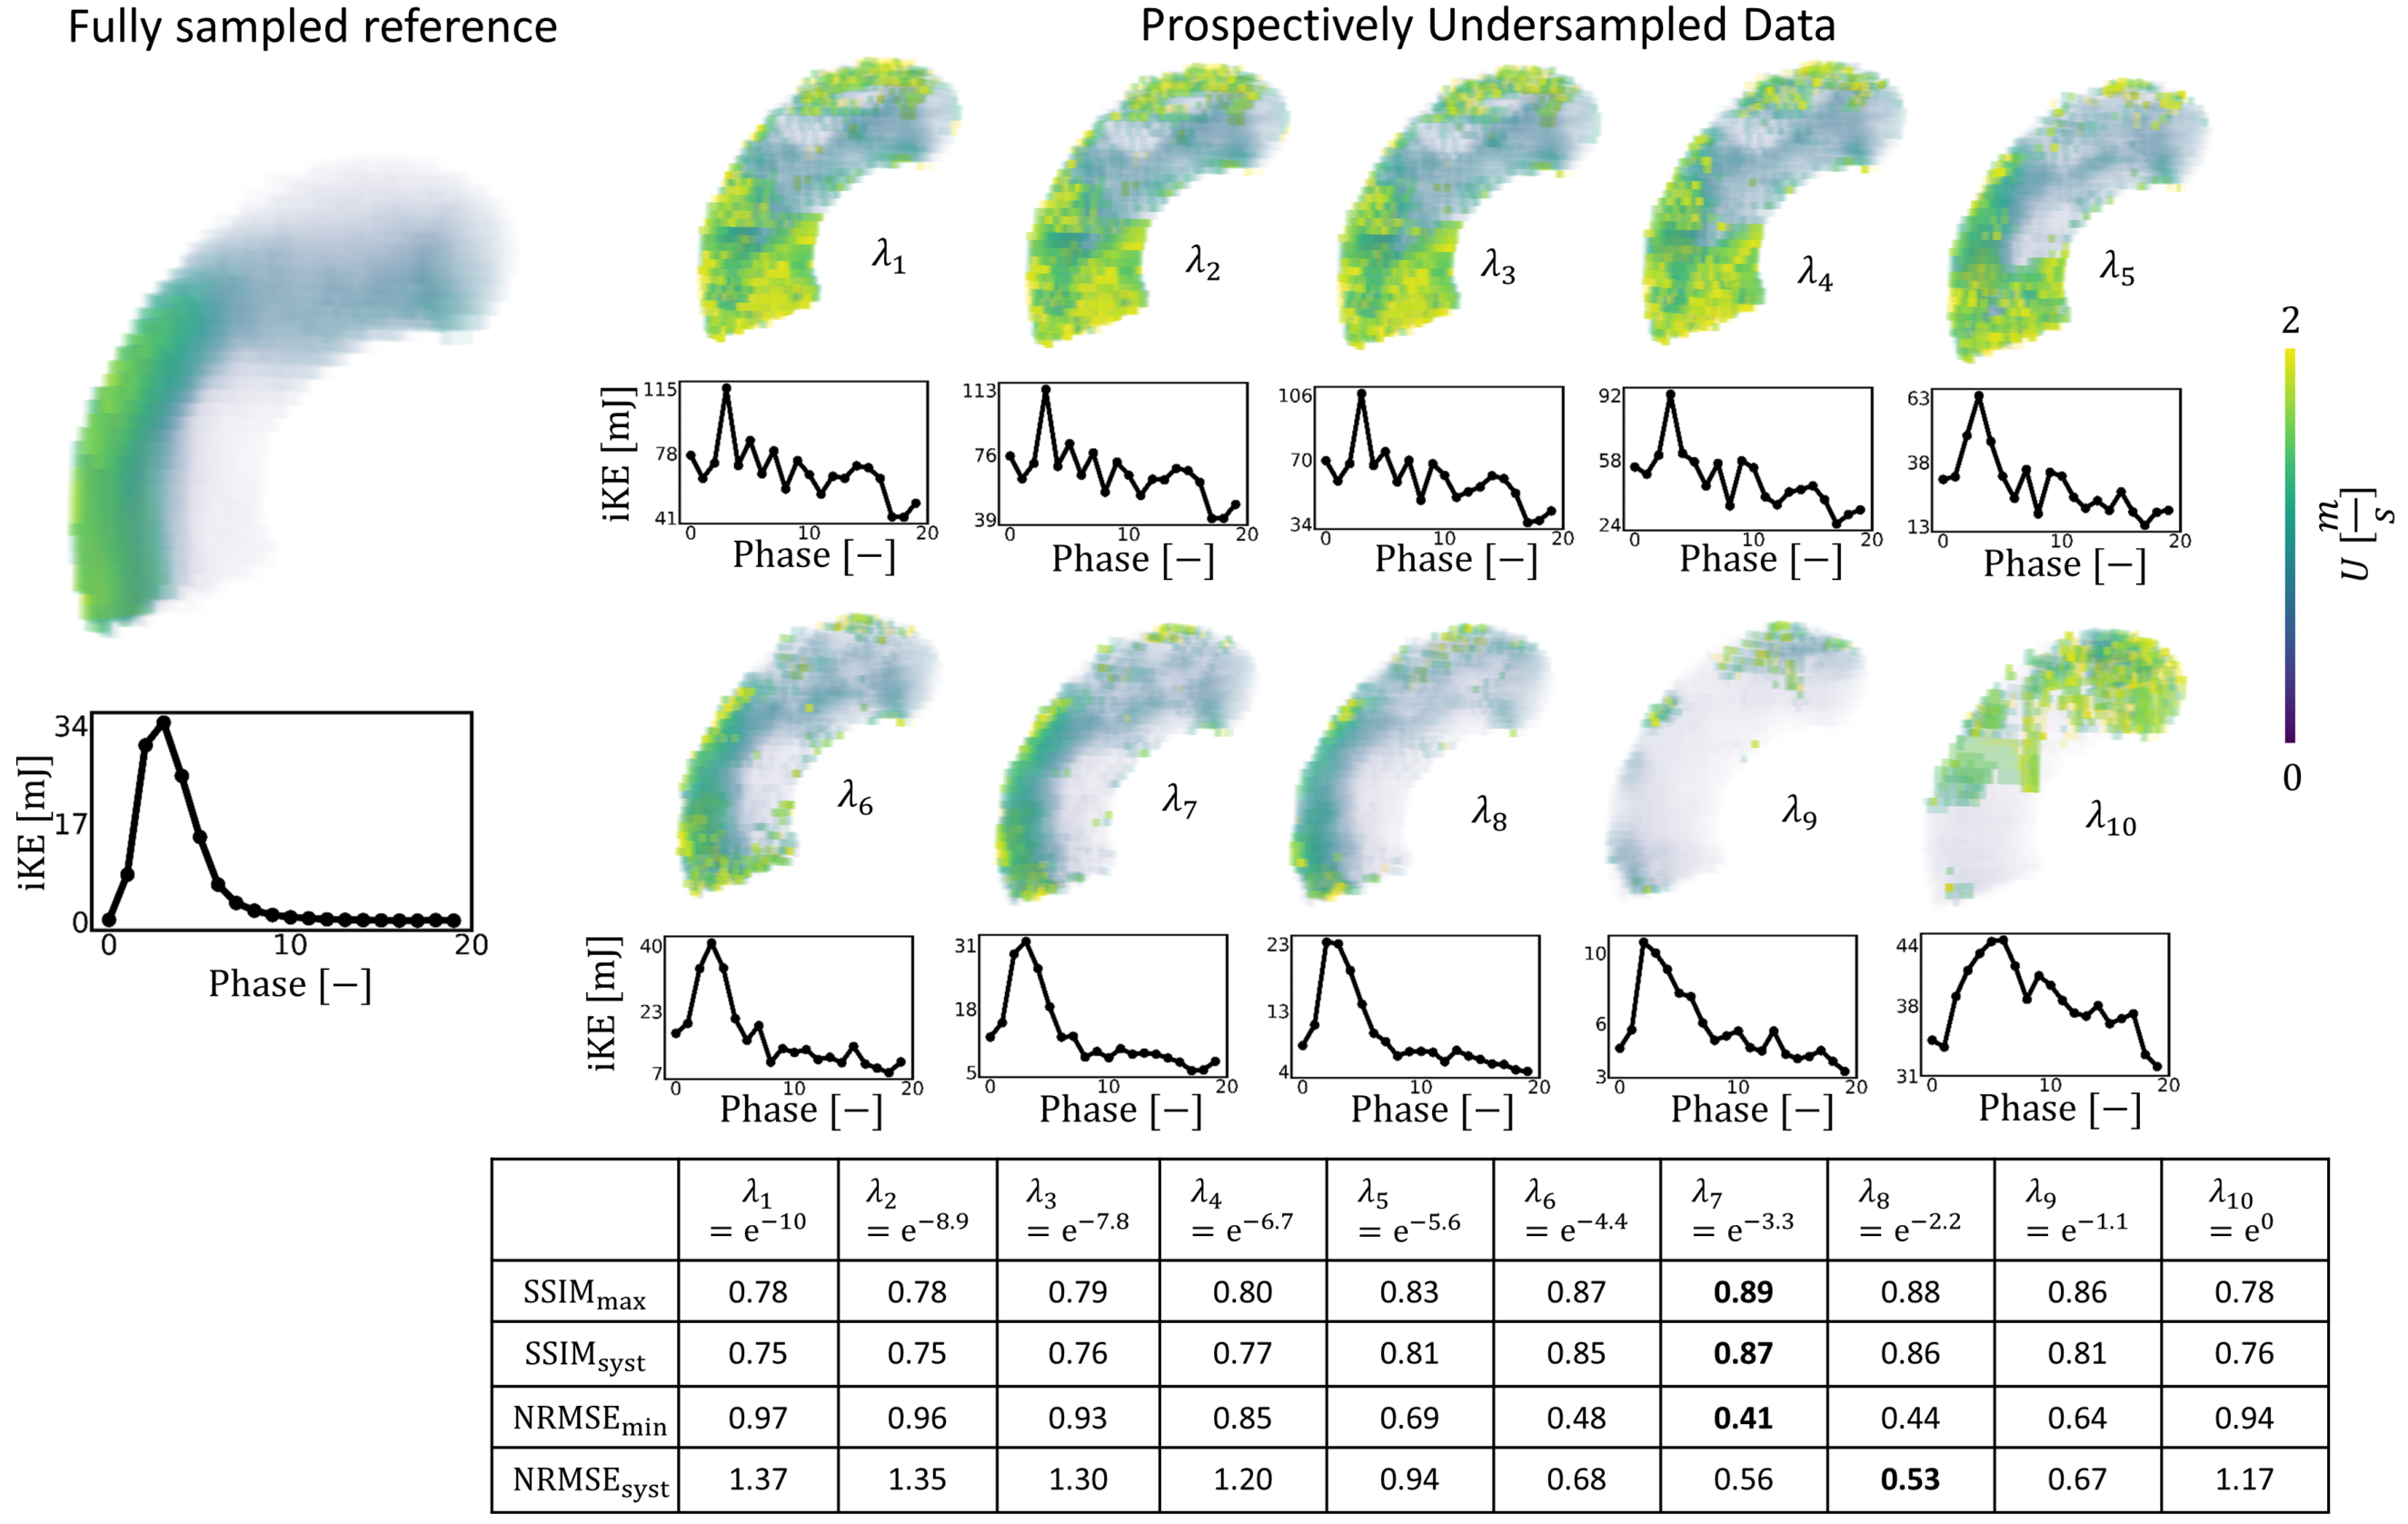
Figure 2: Impact of regularization on undersampled synthetic data ($$$V_{enc} =1.5,3ms^{-1} $$$, R=14) on reconstructed velocity magnitude. $$$\lambda_{1 \rightarrow 10}$$$ correspond to the normalized regularization factors. Line plots show the evolution of integrated KE for each cardiac phase. $$$SSIM_{max}$$$ and $$$NRMSE_{min}$$$ correspond to the maximum similarity and minimum error between the reconstructed data and the fully sampled synthetic reference. $$$SSIM_{syst}$$$ and $$$NRMSE_{syst}$$$ correspond to the averaged similarity and error during systole.
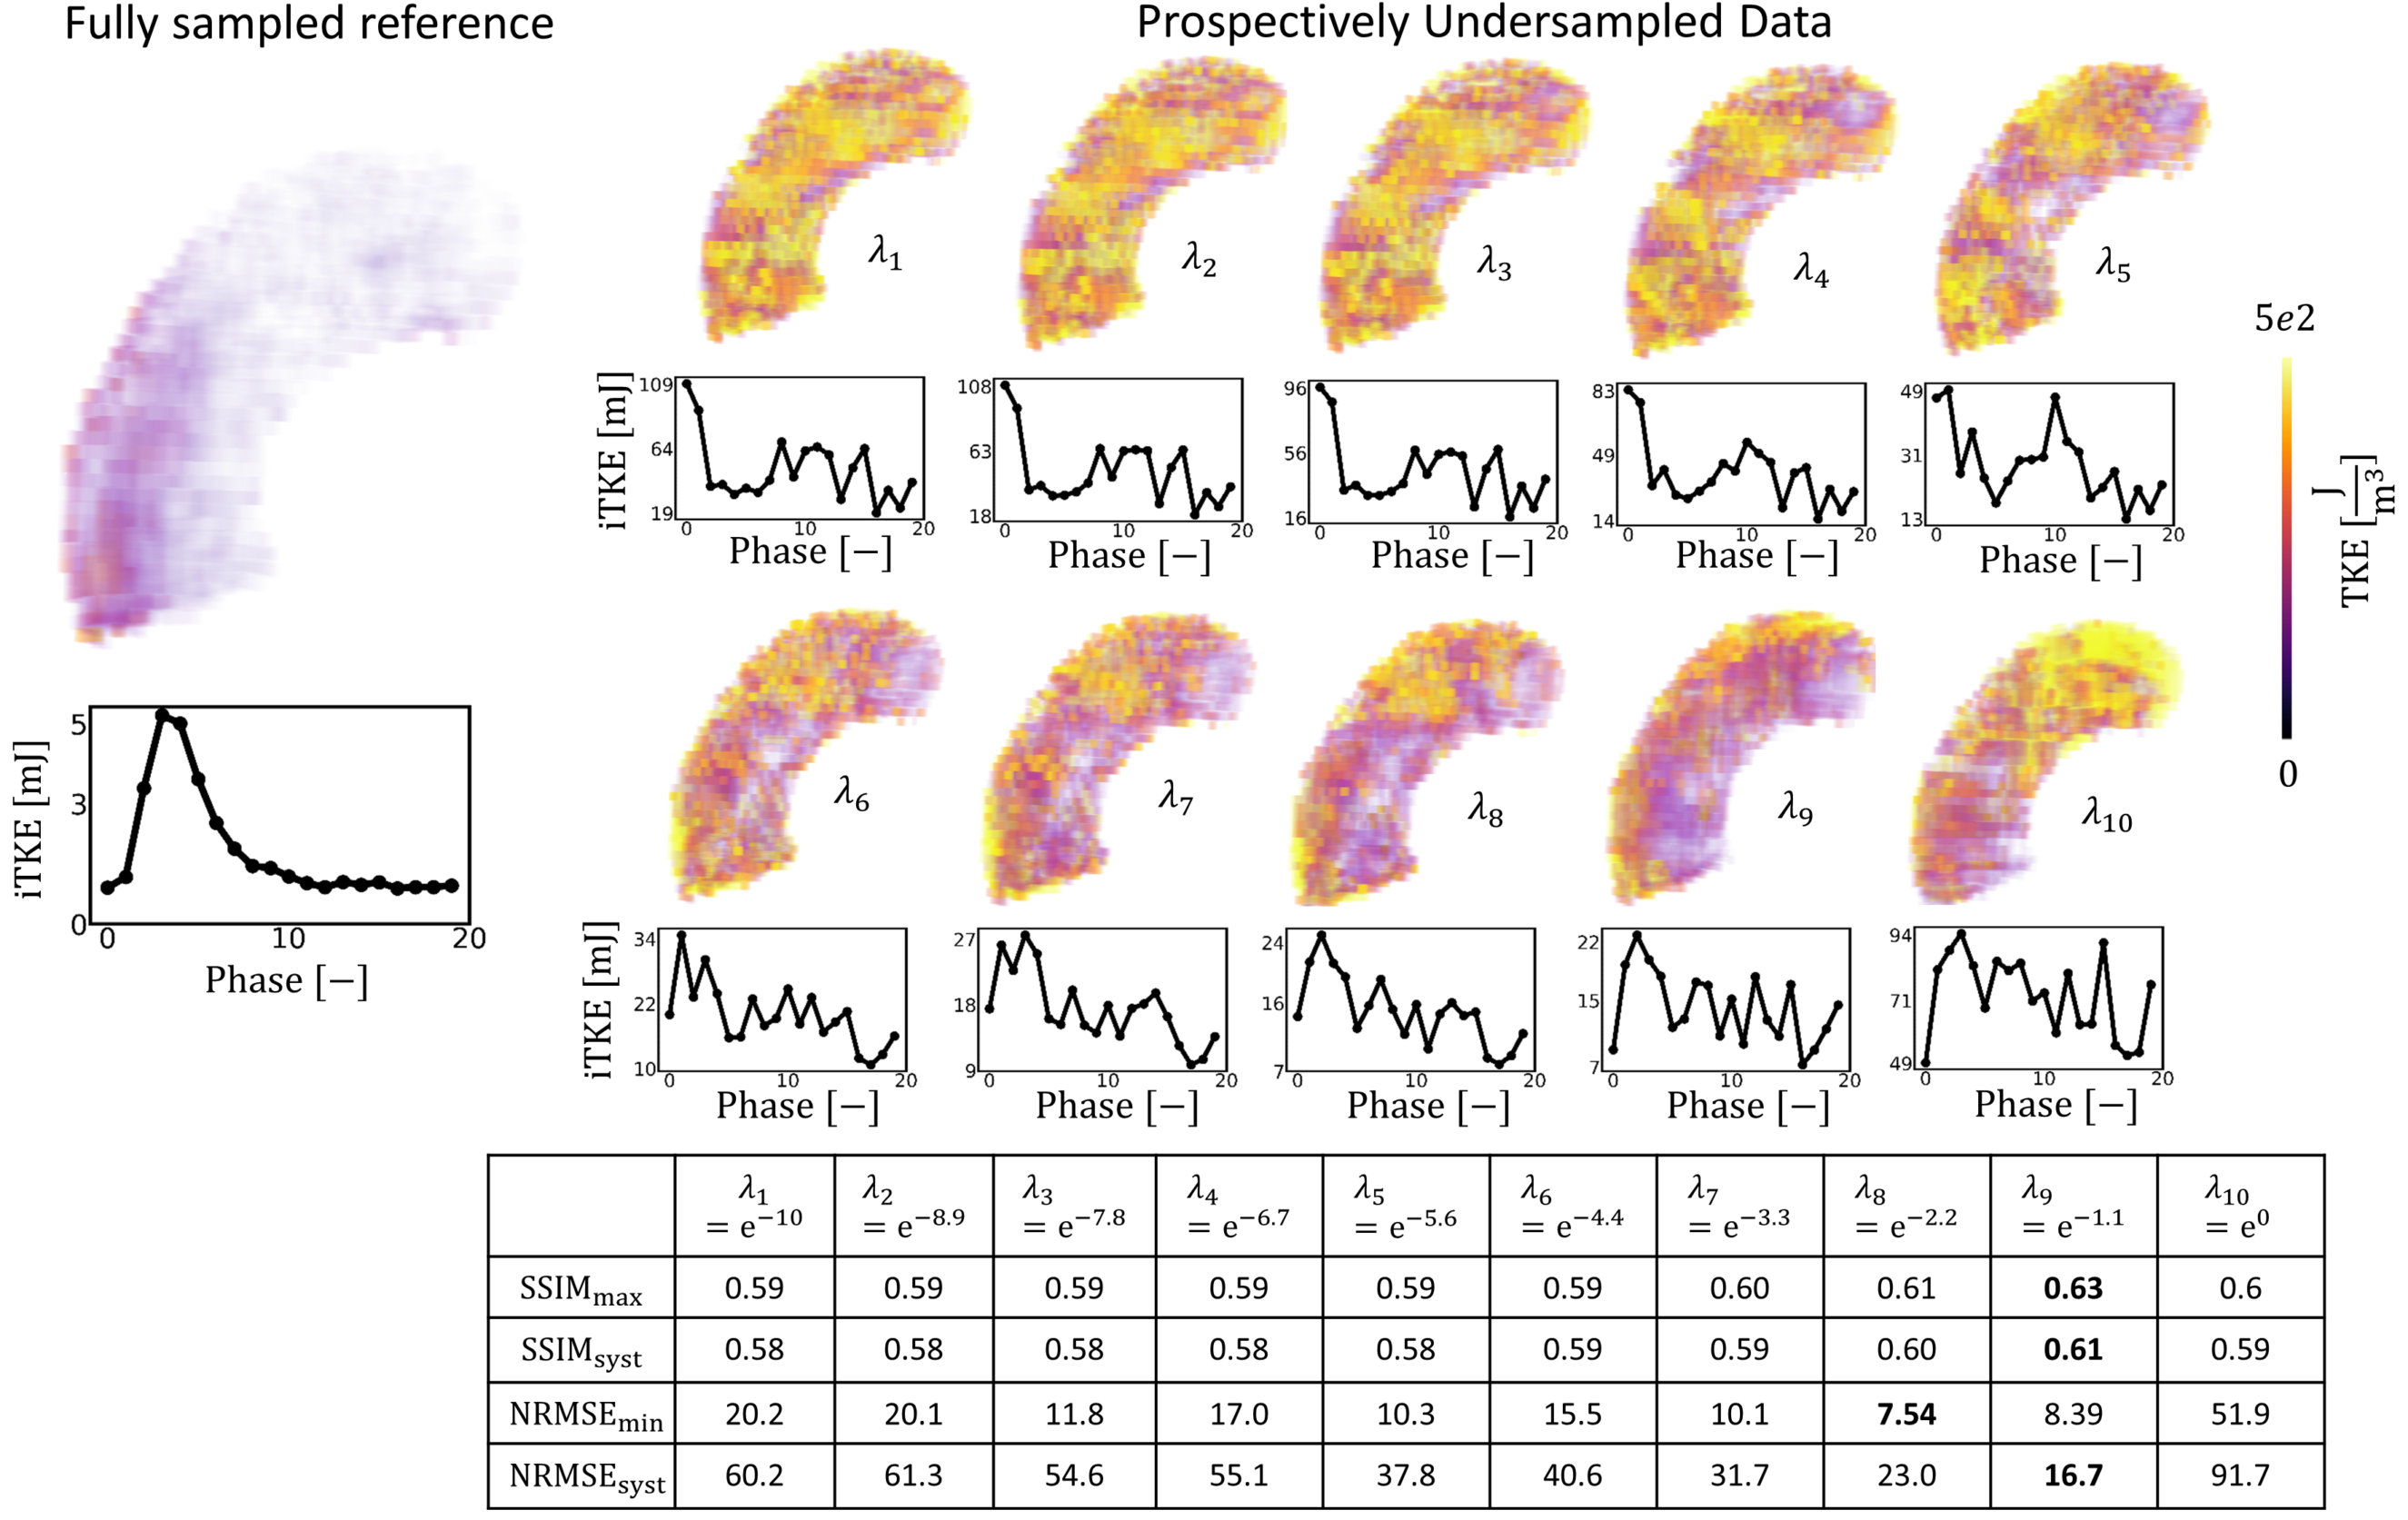
Figure 3: Impact of regularization on undersampled synthetic data ($$$V_{enc} =1.5,3ms^{-1}$$$ , R=14) on reconstruction of TKE. $$$\lambda_{1 \rightarrow 10}$$$ correspond to the normalized regularization factors. Line plots show the evolution of integrated TKE for each cardiac phase. $$$SSIM_{max}$$$ and $$$NRMSE_{min}$$$ correspond to the maximum similarity and minimum error between the reconstructed data and the fully sampled synthetic reference. $$$SSIM_{syst}$$$ and $$$NRMSE_{syst}$$$ correspond to the averaged similarity and error during systole.
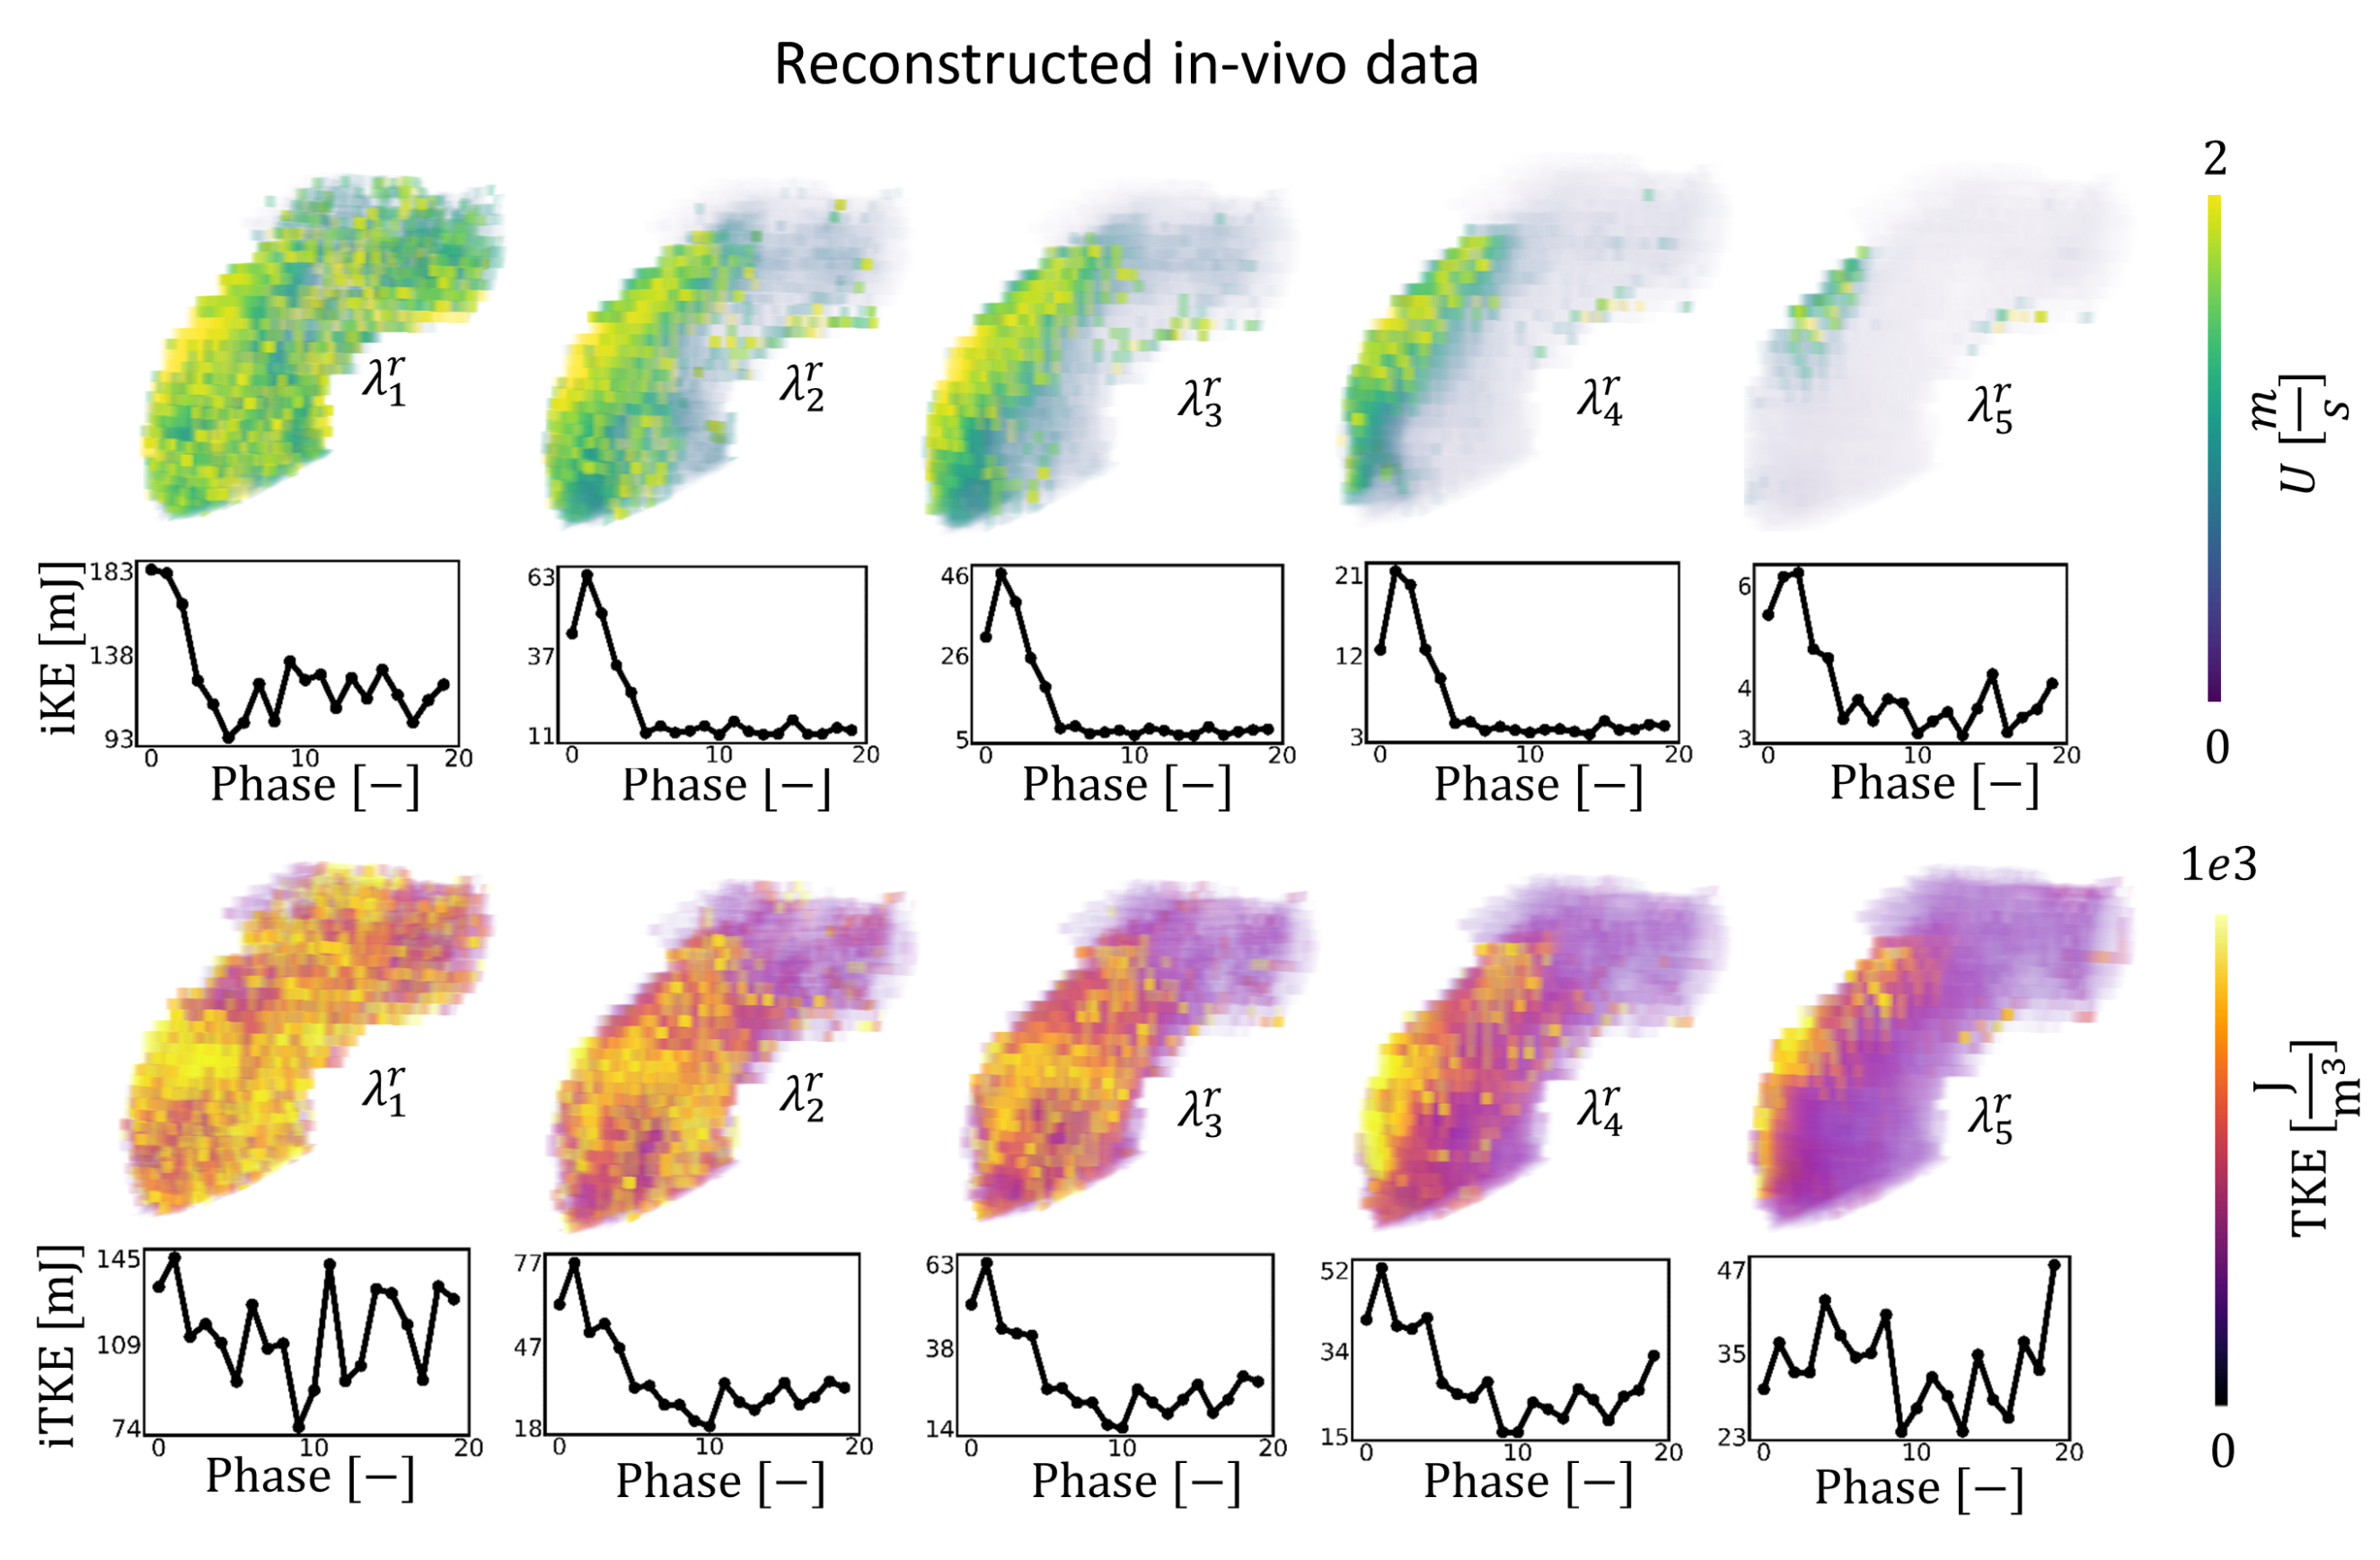
Figure 4: Impact of regularization (R=14) on undersampled in-vivo data on reconstruction of velocity and TKE. $$$\lambda_{1 \rightarrow 5}^{r}$$$ correspond to the normalized regularization factors for the in-vivo case. In vivo data was reconstructed using a MI-LLR approach with 3 respiratory bins, with the first bin used here. The line graphs show the evolution of integrated KE and integrated TKE for each cardiac phase.
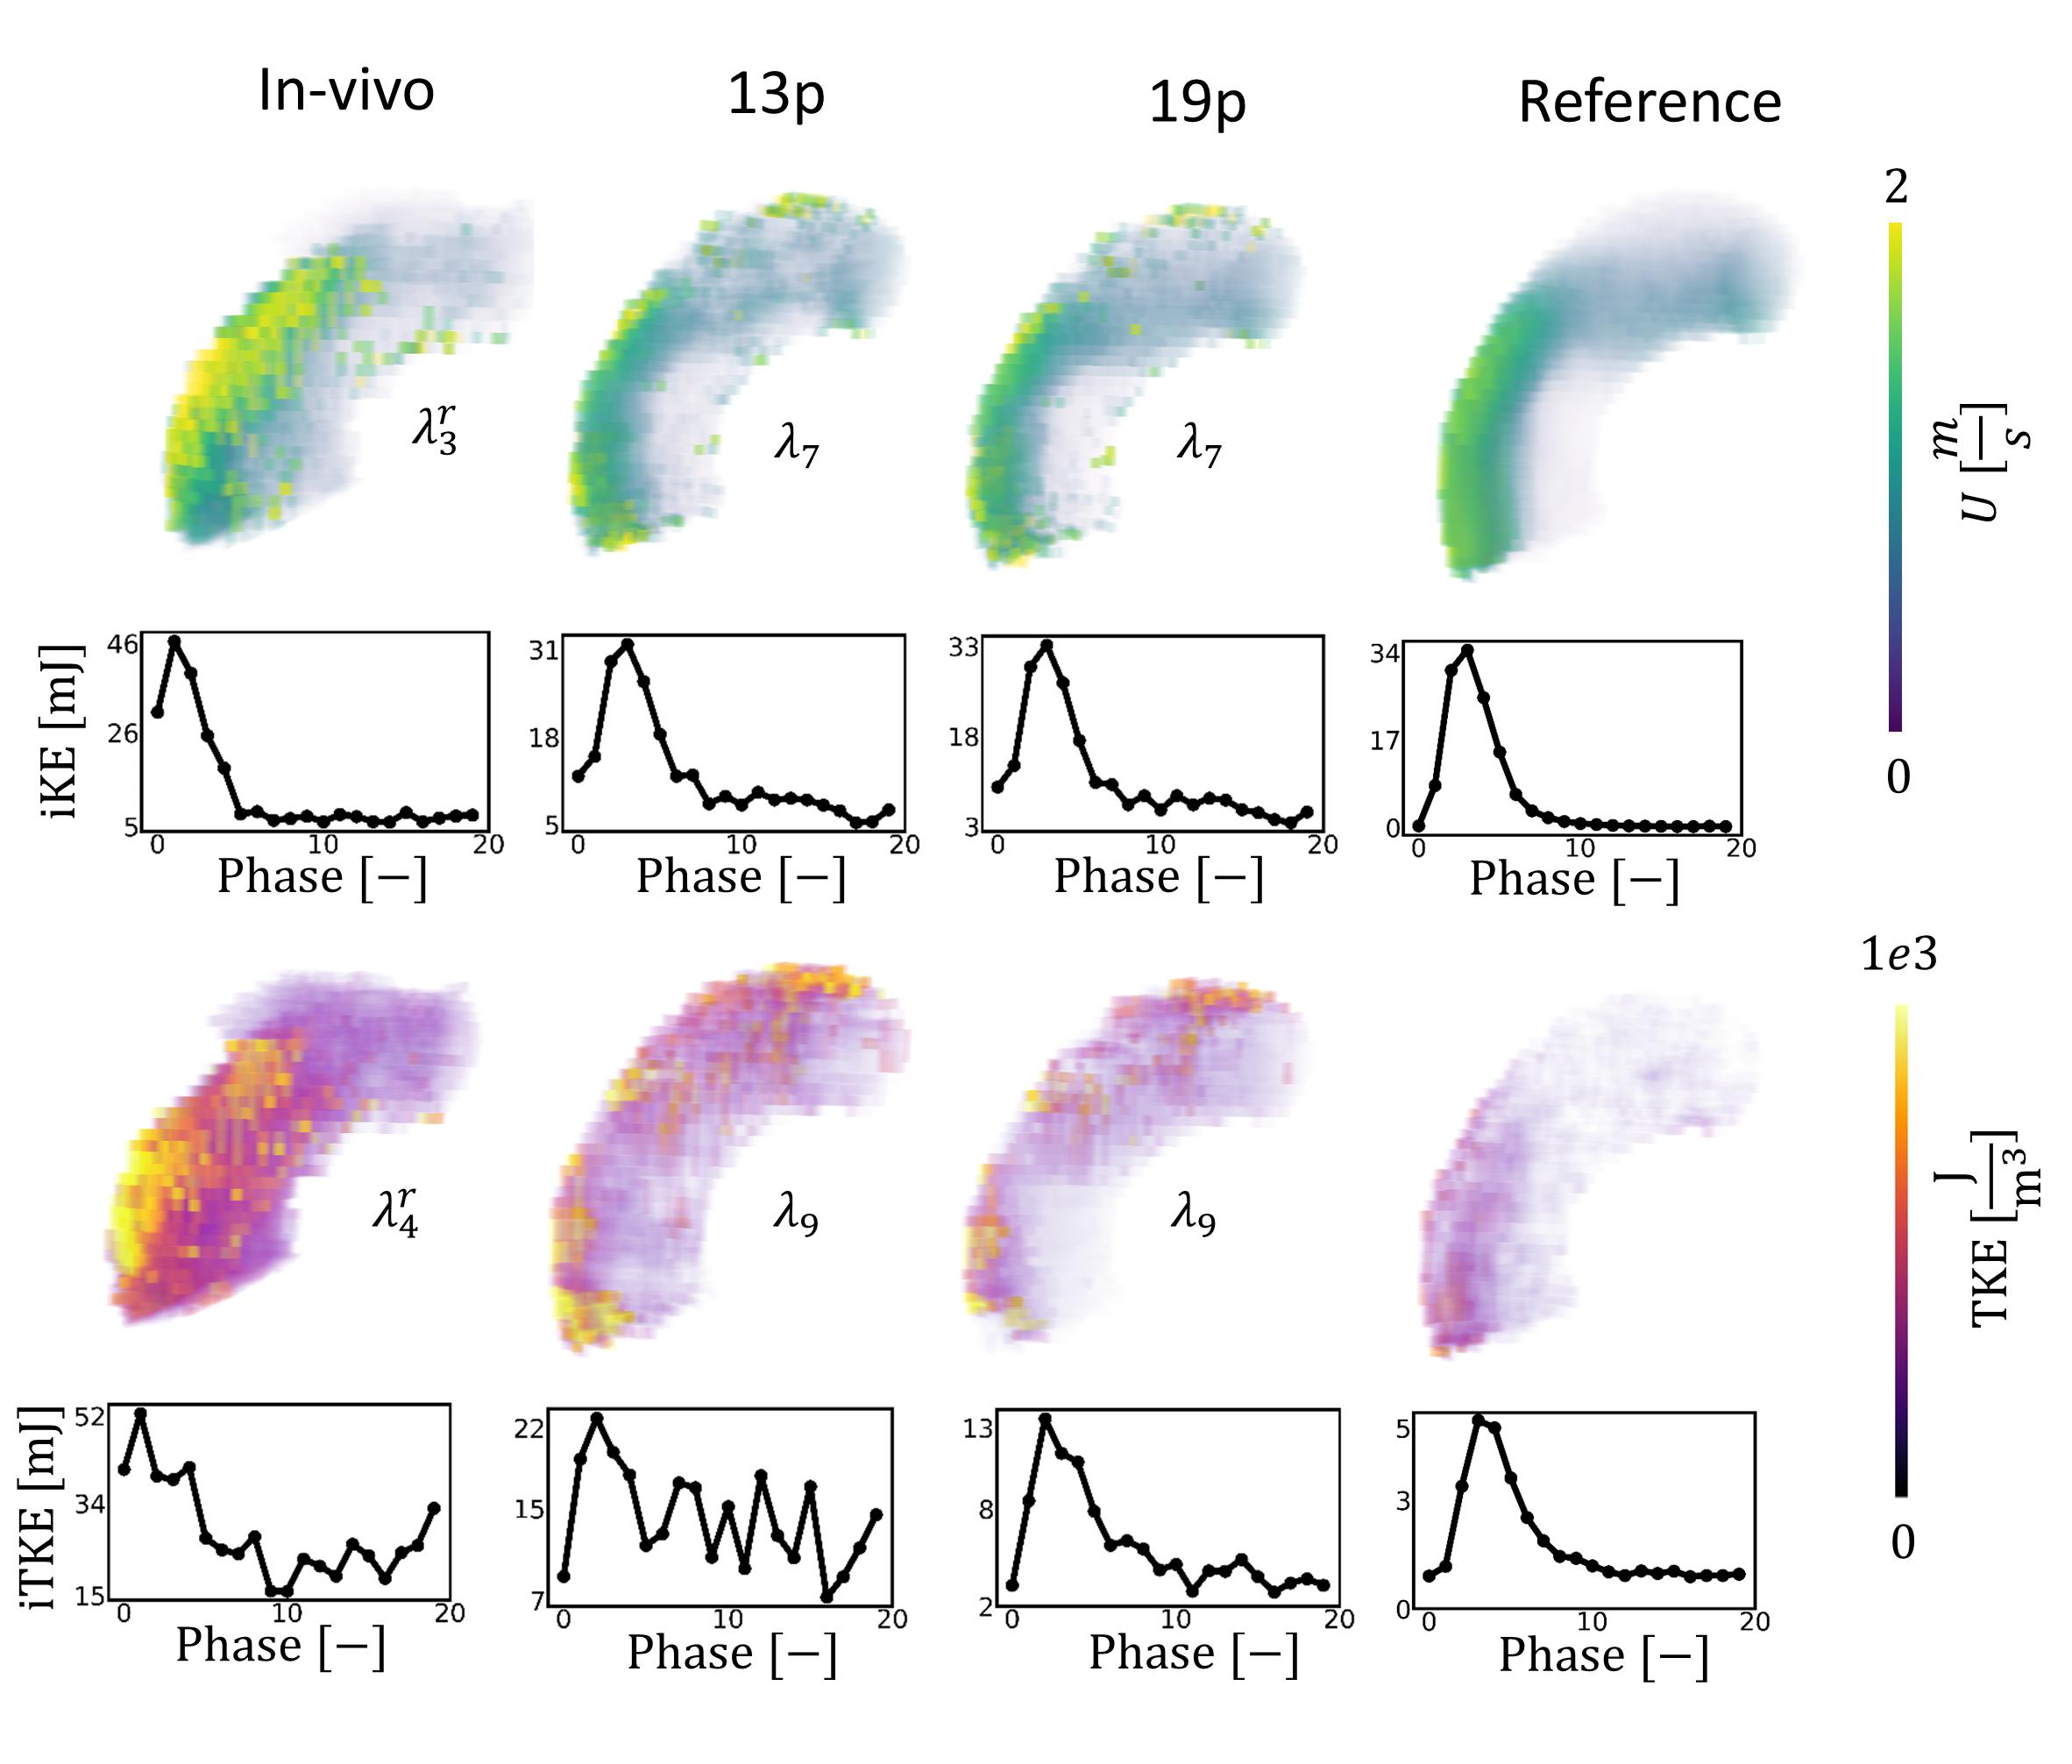
Figure 5: Comparison of synthetic data with the patient-specific 5D flow MRI data. In vivo data was reconstructed using a MI-LLR approach with 3 respiratory bins, with the first bin used here. Synthetic data was reconstructed using a LLR approach. In-vivo, 13p and reference scans were acquired with $$$V_{enc} =1.5,3ms^{-1}$$$ . The 19p scan was synthesized with an additional $$$V_{enc} =0.5ms^{-1}$$$ . An undersampling factor of R=14 is used for all the data. $$$\lambda_{4}^{r}$$$ and $$$\lambda_{5}^{r}$$$ were tuned for velocity and TKE reconstruction, respectively.
DOI: https://doi.org/10.58530/2023/0929