0928
A deep learning framework for cardiac self-gating in free-running radial 4D flow MRI
Mariana B.L. Falcão1, Giulia M.C. Rossi1, Jonas Richiardi1, Xavier Sieber1, Pierre Monney2, Tobias Rutz2, Milan Prša3, Estelle Tenisch1, Anna Giulia Pavon4, Panagiotis Antiochos2, Matthias Stuber1,5, and Christopher W. Roy1
1Department of Radiology, Lausanne University Hospital (CHUV) and University of Lausanne (UNIL), Lausanne, Switzerland, 2Service of Cardiology, Centre de Resonance Magnétique Cardiaque (CRMC), Lausanne University Hospital (CHUV) and University of Lausanne (UNIL), Lausanne, Switzerland, 3Woman- Mother- Child Department, Lausanne University Hospital (CHUV) and University of Lausanne (UNIL), Lausanne, Switzerland, 4Division of Cardiology, Cardiocentro Ticino Institute, Ente Ospedaliero Cantonale, Lugano, Switzerland, 5Center for Biomedical Imaging (CIBM), Lausanne, Switzerland
1Department of Radiology, Lausanne University Hospital (CHUV) and University of Lausanne (UNIL), Lausanne, Switzerland, 2Service of Cardiology, Centre de Resonance Magnétique Cardiaque (CRMC), Lausanne University Hospital (CHUV) and University of Lausanne (UNIL), Lausanne, Switzerland, 3Woman- Mother- Child Department, Lausanne University Hospital (CHUV) and University of Lausanne (UNIL), Lausanne, Switzerland, 4Division of Cardiology, Cardiocentro Ticino Institute, Ente Ospedaliero Cantonale, Lugano, Switzerland, 5Center for Biomedical Imaging (CIBM), Lausanne, Switzerland
Synopsis
Keywords: Flow, Cardiovascular, Cardiac signal extraction
Self-gating (SG) techniques improve the ease-of-use of cardiac MR by deriving cardiac signals from the data itself, obviating the need for ECG lead placement. Nonetheless, unpredictable shifts between the features of SG signals and the conventionally used R-wave peaks from ECG might hamper a direct link of reconstructed image frames with physiology. In this work, we developed a fully convolutional neural network to predict R-wave peak timepoints from SG imaging readouts in free-running radial 4D flow data, and provided a proof-of-concept of the usability of such learned R-wave peak timepoints for reconstructing cardiac-resolved 4D flow images.Introduction
Accurate detection of cardiac motion is essential for producing high-quality MR images of the heart. Electrocardiography (ECG) is currently the gold-standard to trigger the acquisition or to perform retrospective cardiac gating, as the peaks of the R-waves can be reliably identified. However, ECG placement may be time consuming and the signal is prone to corruption by magnetohydrodynamic effects or gradient switching. Alternatively, self-gating (SG) techniques use the acquired MRI data to derive a signal related to the underlying motion that can be used for retrospective cardiac gating1. Nevertheless, features of SG signals do not usually correspond to ECG R-wave peaks, hampering a direct and reproducible link of reconstruction frames with physiology2. This can lead to asynchrony when comparing multiple SG images to gold-standard ECG-gated images, limiting the translation of SG techniques to clinical practice.Previous studies have demonstrated the feasibility of training neural networks to find R-wave peak timepoints using SG signals, both for angiography3,4 and MRI5–7. To our knowledge, no network has so far been developed for 4D flow MRI.
The aim of our study was therefore to train, validate, and test a network for predicting R-wave peak timepoints using repeated readouts from free-running radial 4D flow data. We performed our analysis in a cohort of heart disease patients, compared our deep-learning-based predictions against ground-truth ECG, and demonstrated the feasibility of using deep-learning-based self-gating to reconstruct radial 4D flow data.
Methods
Acquisitions. Free-running 3D radial Phase-Contrast MRI (PC-MRI)8 data were acquired in 75 consenting patients (3-82 years; 47 M) on a 1.5T MAGNETOM Sola (Siemens Healthcare, Erlangen, Germany), while recording ECG. Each interleaf of the 3D radial trajectory9 was preceded by a readout along the superior-inferior (SI) direction for subsequent self-gating (Fig.1A).Data preparation. Datasets were split into training (55), validation (10) and testing (10) sets. For each dataset, the extracted SI readouts were inverse-Fourier-transformed and subdivided into 3-second windows (Fig.1B). Each window was temporally interpolated (Nt=60 timepoints, temporal resolution=48ms), spatially cropped (Np=128 samples), and underwent coil compression (Nc=10 virtual coils). Ground-truth binary labels (RECG), indicating the true temporal location of R-wave peaks (RECG triggers), were obtained for each window from ECG.
Network architecture and training. A fully convolutional neural network (FCNN)7 was designed to predict from each SI projection a probability of correspondence to an R-wave peak (Fig.1C). Network weights (2458540 trainable parameters) were learned on training data by minimizing the weighted binary cross-entropy loss between RECG and the predicted probabilities (60 epochs, Adam optimizer, learning rate 0.0005).
Model selection. Validation data were used for a Youden Index-based selection of the best model (Mopt∈[0 60]) and optimal threshold (Topt∈[0 1]) for the conversion of probabilities into binary labels (RFCNN) predicting exact R-wave peak timepoints (RFCNN triggers).
Performance evaluation. The performance of Mopt in combination with Topt was evaluated by predicting RFCNN for the validation (biased) and testing (unbiased) sets and comparing against RECG. For each subject, outlier RFCNN and RECG triggers (missed and additional R-wave peaks) were counted and excluded from further analysis2. The timing between consecutively detected triggers (RR intervals) was compared, and trigger shifts and jitters were computed. For one subject, two 4D flow reconstructions10 using either RFCNN or RECG triggers were performed and flow measurements were compared.
Results
Predictions from the selected model Mopt (epoch 47) in combination with Topt (0.00003) were overall in good agreement with RECG, both for validation and testing (Fig.2A,C-D), with five visually assessed failure cases (validation=2, test=3, Fig.2B) that were excluded from further analysis.Despite the larger number of bad RFCNN triggers (Tab.1), the model proved capable of identifying R-wave peak timepoints even when the latter were missed in RECG (Fig.2D). After exclusion of bad triggers, RFCNN triggers showed a good concordance with RECG, with average trigger shifts and jitters close to the temporal resolution of the data (12.8±18.9ms and 52.7±28.5ms for validation, 40.5±30.3ms and 84.2±79.5ms for testing, Tab.1). The distribution of RRFCNN and RRECG intervals was comparable (Fig.3A), confirmed by the low bias and limits of agreement (1.98±104.19ms for validation, -1.79±109.56ms for testing, Fig.3B-C).
4D flow reconstructions using both RFCNN and RECG triggers showed good synchronization of flow rate curves, with comparable net volume (NV) and peak flow (PF) measurements in the ascending (NVFCNN=58.03mL, NVECG=57.35mL, PFFCNN=347.64mL/s, PFECG=345.93mL/s) and descending aorta (NVFCNN=38.49mL, NVECG=37.57mL, PFFCNN=215.61mL/s, PFECG=215.19mL/s).
Discussion and Conclusion
We showed the feasibility of extracting R-wave peak timepoints from SG readouts in free-running radial 4D flow data using deep learning. The detected timepoints agreed with ground-truth ECG (shifts and jitters close to temporal resolution, comparable RR intervals), and allowed for the generation of 4D flow images with reliable flow measurements.Despite these preliminary results, the temporal resolution of the datasets used for training the network (48ms) had limited the precision. Additionally, the relatively small number of patients included resulted in a low variability in terms of image contrasts and resolution, possibly explaining failure cases.
An extension of the network to other free-running sequences is envisaged, with the aim of achieving a reliable synchronization of SG reconstructions to gold-standard ECG-gated images, further validating the use of SG as an ECG-free alternative for cardiac gating, and simplifying the clinical workflow of cardiac MRI.
Acknowledgements
MS is the PI on the Swiss National Science Foundation grants 320030_173129 and 201292 that funded part of this research. CWR is the PI on Swiss National Science Foundation Grant PZ00P3_202140 that funded part of this research.References
- Larson AC, White RD, Laub G, McVeigh ER, Li D, Simonetti OP. Self-Gated Cardiac Cine MRI. Magn Reson Med. 2004;51(1):93-102. doi:10.1002/mrm.10664
- Di Sopra L, Piccini D, Coppo S, Stuber M, Yerly J. An automated approach to fully self‐gated free‐running cardiac and respiratory motion‐resolved 5D whole‐heart MRI. Magn Reson Med. 2019;(June):1-15. doi:10.1002/mrm.27898
- Ciusdel C, Turcea A, Puiu A, et al. TCT-231 An artificial intelligence based solution for fully automated cardiac phase and end-diastolic frame detection on coronary angiographies. J Am Coll Cardiol. 2018;72(13):B96-B97. doi:10.1016/j.jacc.2018.08.1356
- Ciusdel C, Turcea A, Puiu A, et al. Deep neural networks for ECG-free cardiac phase and end-diastolic frame detection on coronary angiographies. Comput Med Imaging Graph. 2020;84:101749. doi:10.1016/j.compmedimag.2020.101749
- Usman M, Atkinson D, Kolbitsch C, Schaeffter T, Prieto C. Manifold learning based ECG‐free free‐breathing cardiac CINE MRI. J Magn Reson Imaging. 2015;41:1521–1527.
- Ahmed AH, Aggarwal H, Nagpal P, Jacob M. Dynamic MRI using Deep Manifold Self-Learning. Proc IEEE Int Symp Biomed Imaging. 2020:1052–1055. doi:10.1109/ isbi45749.2020.9098382.
- Hoppe E, Wetzl J, Yoon SS, et al. Deep Learning-Based ECG-Free Cardiac Navigation for Multi-Dimensional and Motion-Resolved Continuous Magnetic Resonance Imaging. IEEE Trans Med Imaging. 2021;40(8):2105-2117. doi:10.1109/TMI.2021.3073091
- Ma LE, Yerly J, Piccini D, et al. 5D Flow MRI : A Fully Self-gated, Free-running Framework for Cardiac and Respiratory Motion – resolved 3D Hemodynamics. Radiol Cardiothorac Imaging. 2020;2(6). doi:10.1148/ryct.2020200219
- Piccini D, Littmann A, Nielles-vallespin S, Zenge MO. Spiral Phyllotaxis : The Natural Way to Construct a 3D Radial Trajectory in MRI. Magn Reson Med. 2011;66:1049-1056. doi:10.1002/mrm.22898
- Falcão MBL, Rossi GMC, Ma L, et al. Correcting vs resolving respiratory motion in accelerated free-running whole-heart radial Flow MRI using focused navigation (fNAV). Proc Intl Soc Mag Reson Med. 2021;29(0304). doi:10.1002/mrm.27918
Figures
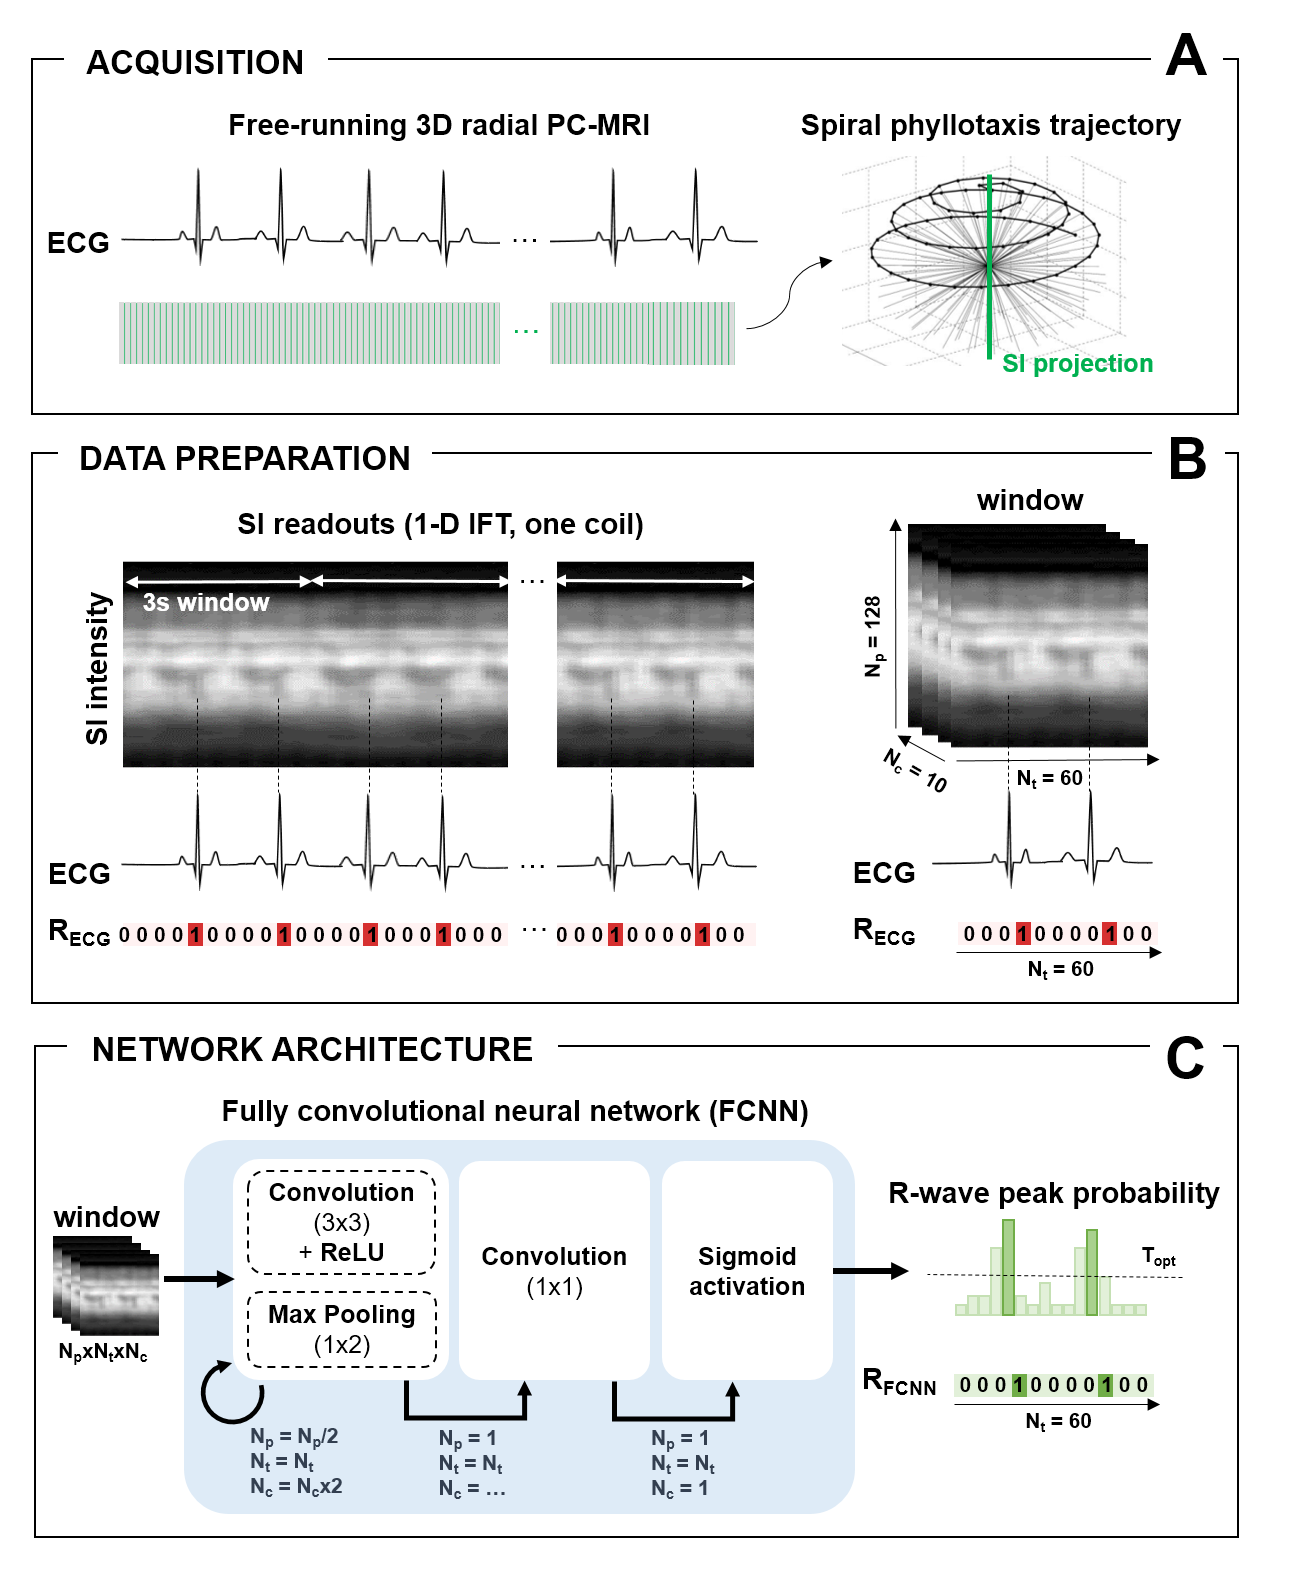
Figure 1. Study Framework. A. Free-running 3D radial PC-MRI data were acquired, while recording
the ECG. B. Inverse-Fourier-transformed
SI readouts were divided into 3s windows (Nt=60 timepoints, Np=128
samples, Nc=10 virtual coils). C. The
FCNN repeatedly applies blocks of convolutional layers (3x3), rectified linear
unit activations and max-pooling (1x2). At each iteration, Np is
halved, Nc is doubled, and Nt is preserved, until Np=1
is reached. Nc is reduced to 1 within a last convolutional block
(1x1), and a sigmoid activation yields a final vector of R-wave peak probabilities.
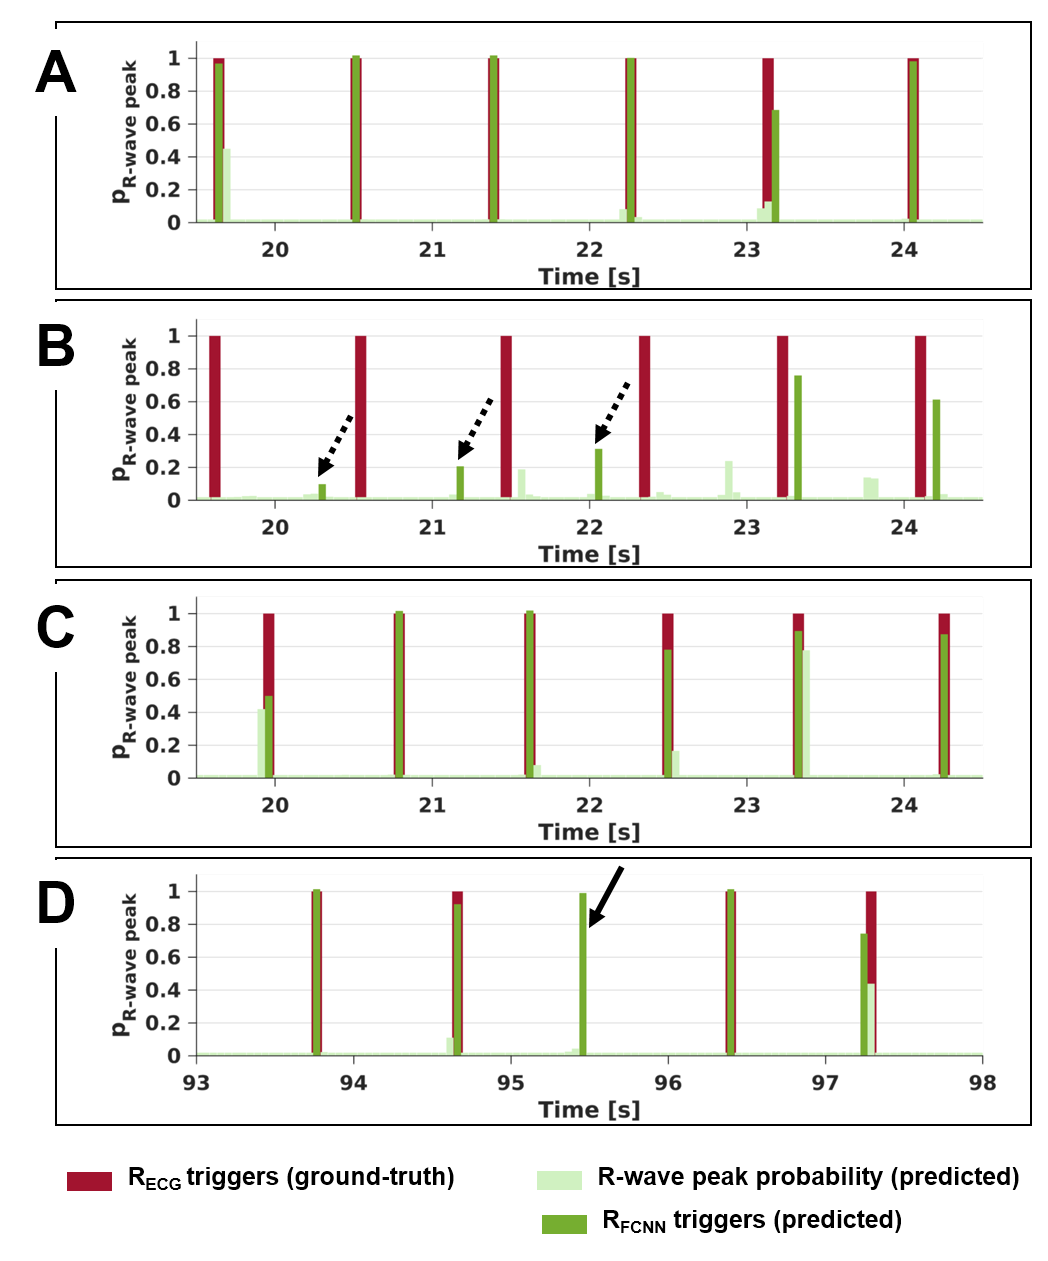
Figure 2. Comparison of
FCNN predictions to ground-truth ECG. Examples of accurate (A,C,D) and erroneous (B) FCNN predictions (light green: R-wave
peak probability, dark green: RFCNN triggers) as compared to ground-truth
ECG (dark red: RECG triggers) for two subjects belonging to the validation (A-B) and test (C-D) sets. Dashed arrows: inaccurate RFCNN triggers.
Solid arrow: RFCNN detecting a missed RECG trigger.
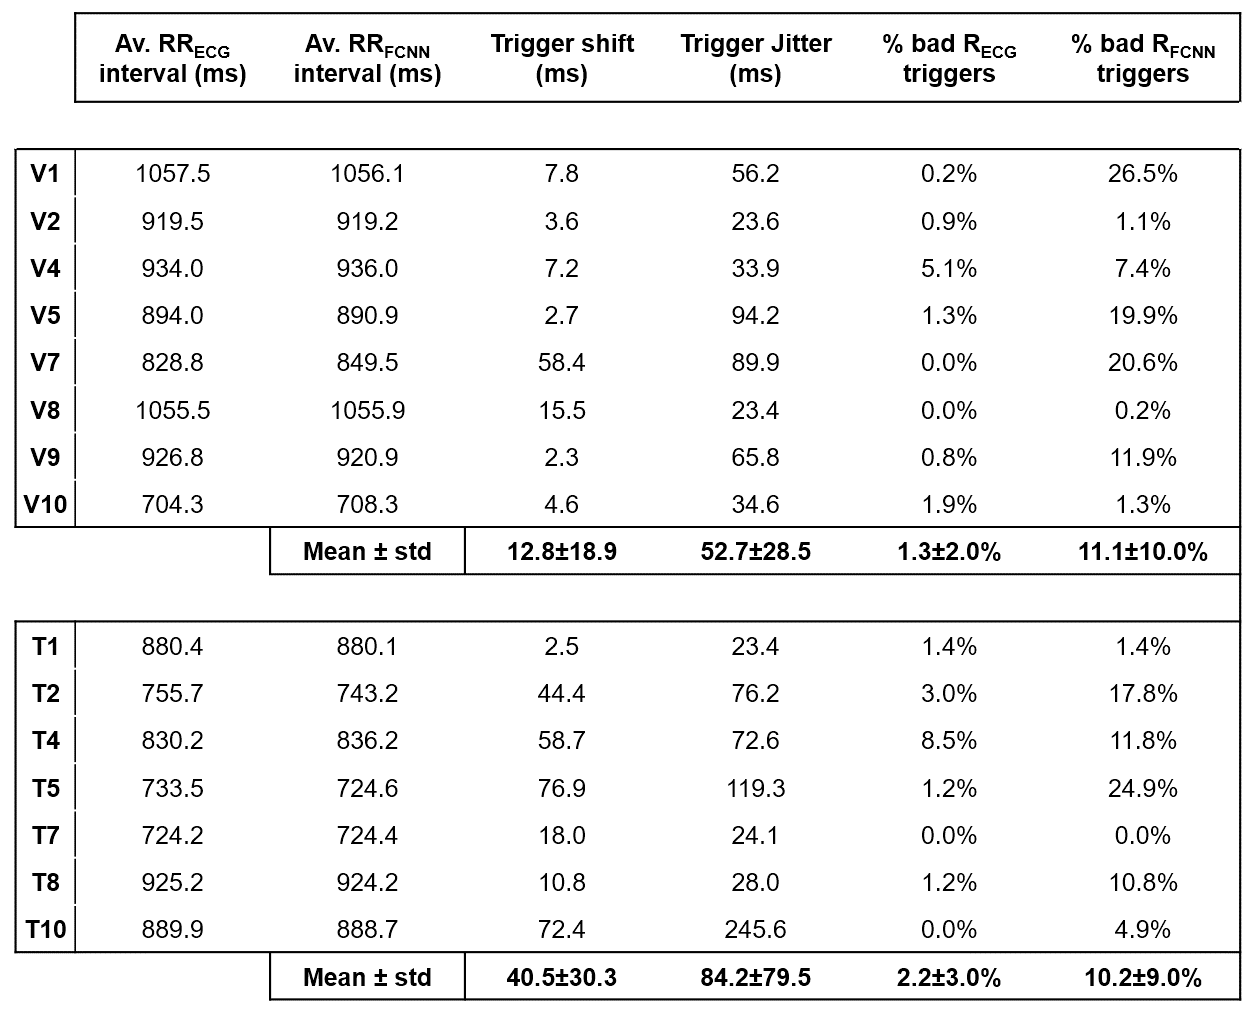
Table 1. Quantitative comparison of FCNN predictions to ground-truth ECG. For both RECG and RFCNN,
the resulting average RR interval (RRECG and RRFCNN) as
well as the percentage of bad triggers (missed and additional R-wave peaks) are
reported together with the trigger shifts and jitters (bad triggers excluded). Five
visually assessed FCNN failure cases were excluded from this analysis. V, T:
subjects belonging to the validation (V) and testing (T) sets.
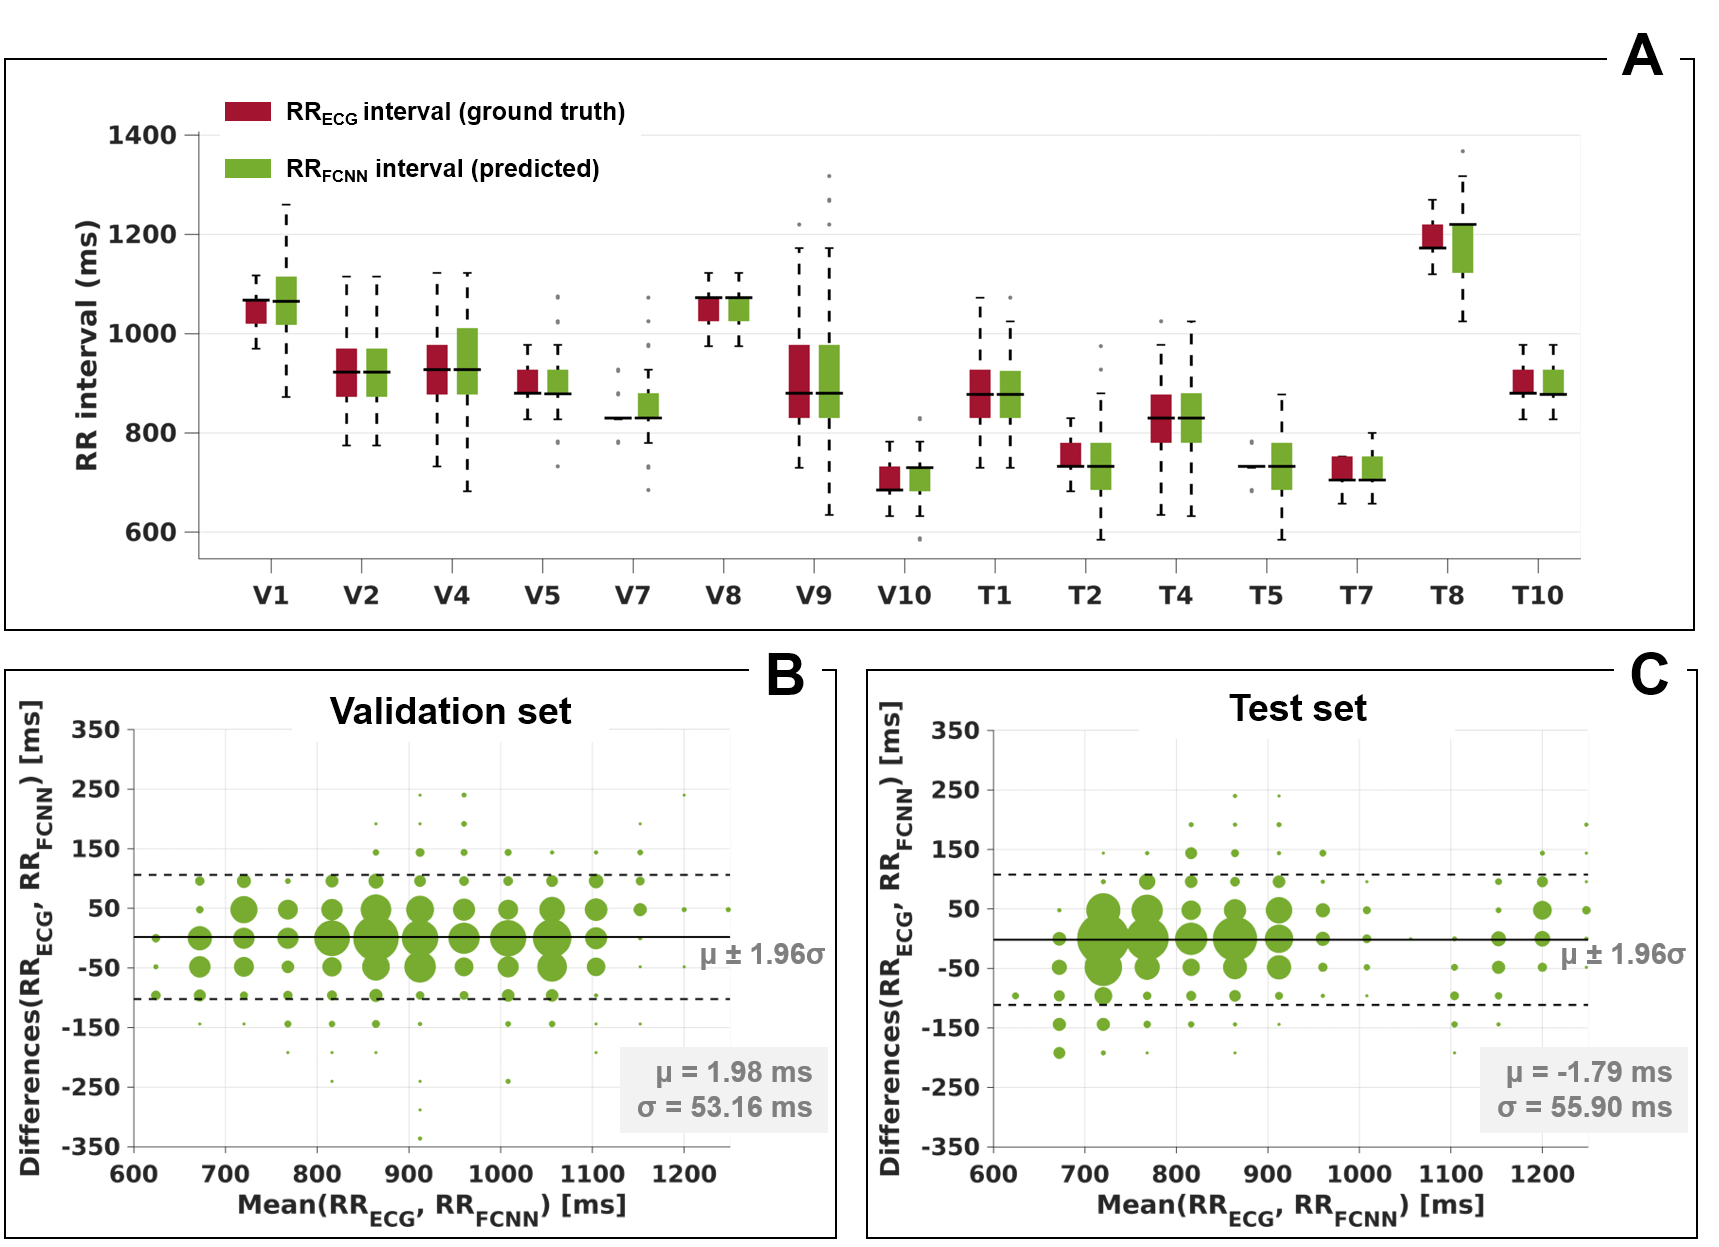
Figure 3. Comparison of
RR intervals. A. Box plots showing
the distribution of RR intervals in RFCNN (green) and RECG
(red). B-C. Bland-Altman plots of RR
intervals in RFCNN and RECG for the validation (B) and test (C) sets. The size of the points is proportional to their relative
occurrence. Five visually assessed FCNN failure cases were excluded from this
analysis.
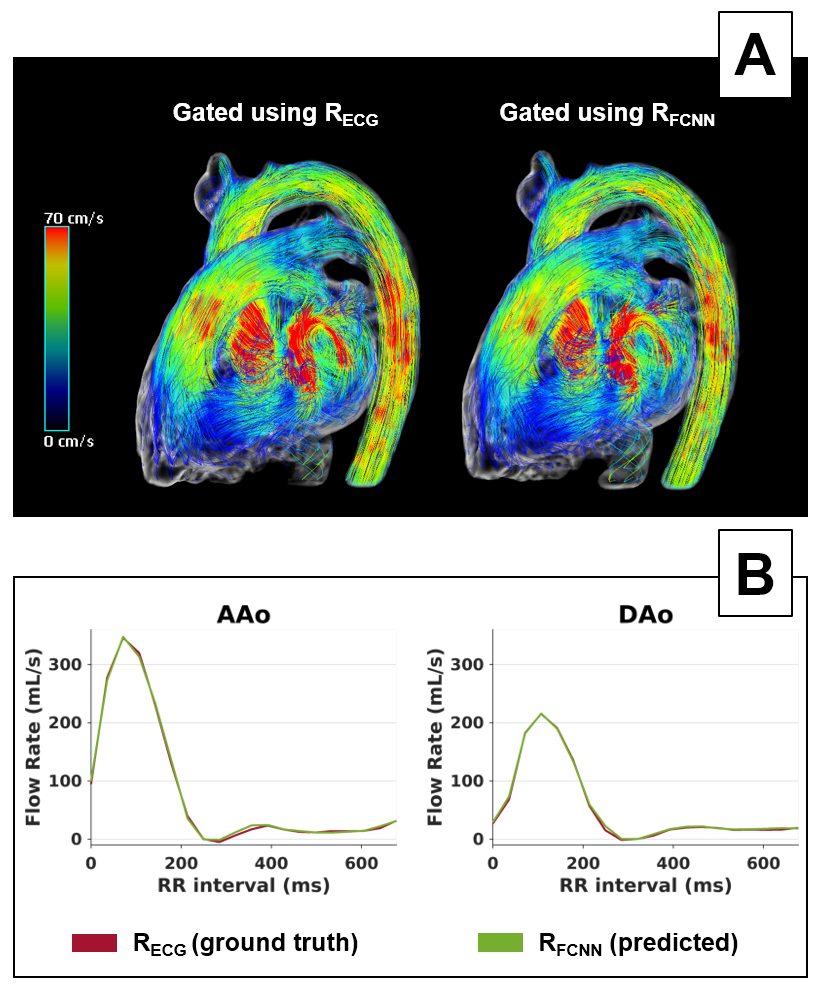
Figure 4. Comparison of 4D flow reconstructions
of one dataset using either RFCNN or RECG triggers for cardiac gating. The patient shown (T7 in Tab.1) is a 69 years
old Mitral Regurgitation female patient (degree 3). A. Streamline visualization in peak systole showing comparable
image quality. B. Flow rates in the ascending
(AAo) and descending (DAo) aorta. A good synchronization of the two triggering techniques,
as well as a good agreement in the flow curves is shown.
DOI: https://doi.org/10.58530/2023/0928