0927
Autonomous 5D-flow with Radial k-Space Sampling1Radiology, University of California San Diego, La Jolla, CA, United States, 2Rady Children's Hospital San Diego, San Diego, CA, United States, 3University of Pennsylvania, Philadelphia, PA, United States, 4Bioengineering, University of California San Diego, La Jolla, CA, United States
Synopsis
Keywords: Flow, Simulations
Autonomous acquisition of radial k-space data improves sample uniformity in 2D cardiac MRI. We aim to extend this approach to 5D-flow imaging (4D flow with respiratory gating). We have simulated data acquisition using an autonomous approach (ARKS) and compared it to golden-angle (GA) based spiral phyllotaxis acquisition. Simulations were based on physiologic data recorded from pediatric patients undergoing conventional 4D flow imaging. We found that a 4.5 min ARKS scan achieves a higher degree of sampling uniformity than an 8 min GA scan. Future work will focus on implementing 5D-flow ARKS in vivo and evaluating the impact on flow accuracy.Introduction
Pre-defined k-space acquisition schemes, such as golden angle-based approaches, can be cardio-respiratory binned for multi-shot reconstruction. However, in this setting, they can suffer from suboptimal distribution of samples in k-space and are time-consuming.1 In 2D, it has been shown that an adaptive radial k-space sampling approach (ARKS) can improve multi-shot sampling uniformity by continuously monitoring and optimizing the acquisition of k-space data in a closed-loop.2 ARKS identifies the current physiologic bin and all previously collected data in the bin via cross-correlation of short and long buffers containing recent physiological signals.3 In 2D, the location of the largest arc without data is identified and the angle at which it is bisected is estimated and collected in the next TR.Here, we extended ARKS to 3D-flow imaging with cardiac and respiratory binning (5D flow) by simulating the k-space trajectory using physiologic signals acquired in pediatric patients.
Methods
IRB-approved waiver of informed consent was granted to perform this study. Cardiac and respiratory signals from 18 pediatric patients (average age 11.1±5.1 years old, range 0.6-18 years old, 9 females) were extracted from the 4D-flow scans. Five patients were under general anesthesia.All analyses were performed in Matlab (Version 2022a. Natick, Massachusetts. The MathWorks Inc.). Physiologic data were used to simulate two 5D-flow free-breathing schemes. First, a 3D predetermined, golden-angle (GA) based spiral phyllotaxis 4D-flow sequence (similar to Ma et al4) was simulated with the following parameters: TR 4.7msec, 21 spokes/interleave (1 SI projection for and 5 spokes repeated 4 times for 3D velocity encoding) and 4820 interleaves, resulting in 96400 total spoke locations, and scan time 7:55 minutes. In this case, the trajectory was predetermined and the data was sorted into 10 cardiac and 3 respiratory phases retrospectively.
For ARKS, the same scan parameters were used, however the spatial encoding of each spoke was calculated autonomously and dynamically. At each TR, ARKS analyzed the cardiac and respiratory signals to identify the current cardio-respiratory bin. From the location of samples already acquired in this bin, the ten largest gaps in k-space were determined. This was done by creating a Delaunay triangulation on the surface of a sphere with the points already acquired and identifying the location of the Voronoi vertex associated with the largest circle. This vertex represents the largest gaps on the surface of the k-space sphere. At the beginning of the simulation, data were collected following the GA spiral phyllotaxis acquisition trajectory until enough data existed per bin to estimate the Delaunay triangulation.
We compared the maximum Voronoi area across all cells and the scan efficiency for both approaches, every 30 seconds and at the end of scan time. Scan efficiency is a measure of how quickly the largest Voronoi area approaches the area obtained by uniform sampling, Aoptimal. For half a sphere with radius of 1, Aoptimal = 2π/m, where m is the total number of spoke locations per physiologic bin. Scan efficiency was then estimated as: 100*(d – Amax)/d, where d = (π/6 – Aoptimal).
Maximum Voronoi cell area and scan efficiency were compared using two-way repeated measures ANOVA and post-hoc tests (SPSS, Version 28.0, Arkmonk, NY. IBM Corp.) to identify significant differences between approaches and scan time.
Results
The average heart and respiratory rates of the 18 patients were 78.1±16.4 bpm (range 56.1-126.3 bpm) and 17.6±5.2 bpm (range 8.0-28.3 breaths/min), respectively. Each cardiorespiratory phase had 803.3±36.4 spokes acquired (range 678 to 1005).Maximum cell area and scan efficiency were different (p<0.05) between both approaches across all time points. The optimal Voronoi cell area for this set of scan parameters was 0.0078 (dotted line in Fig. 1A). At all time points, the maximum Voronoi cell areas from ARKS were smaller (p<0.05) than those from the GA approach. Similarly, ARKS efficiency was higher (p<0.05) than that of GA at all time points except at 30 sec, when both approaches followed the GA trajectory. For the initial physiologic bin, ARKS closed-loop began at 53.8±8.9msec.
The scan efficiency achieved by ARKS and GA at the end of the simulation was 82.8% and 79.6%, respectively (Fig. 1B). The scan efficiency of ARKS was higher (p<0.05) than that of GA at all time points. ARKS reached the maximum scan efficiency achieved by GA 2.5 mins earlier (Fig. 1B). In other words, by efficiently targeting gaps in k-space, in simulations, ARKS was more effective at acquiring more equality distributed data.
We show the k-space trajectories throughout scan time in Figs. 2 and 3. In GA, k-space coverage is less uniform (Fig. 2) because a predetermined trajectory is acquired without any information on the physiologic bin. Because ARKS incorporates this information in the closed-loop, it achieves a more uniform sampling of k-space (Fig. 3, right column).
Discussion and Conclusions
Adaptive k-space sampling may be beneficial in 5D imaging approaches, particularly in pediatric patients who have higher heart and respiratory rates with more variation. Here, we showed that 5D ARKS improved the distribution of k-space data and reached the same scan efficiency as 3D spiral phyllotaxis 2.5 mins earlier. Future work will focus on implementing 5D-flow ARKS in vivo and evaluating the effect of quick-changing imaging trajectory and resulting eddy currents on data quality.Acknowledgements
Supported by NIH R01HL162671.References
1. Di Sopra L, Piccini D, Coppo S, Stuber M, Yerly J. An automated approach to fully self-gated free-running cardiac and respiratory motion-resolved 5D whole-heart MRI. Magn Reson Med. Dec 2019;82(6):2118-2132. doi:10.1002/mrm.27898
2. Contijoch F, Han Y, Kamesh Iyer S, et al. Closed-loop control of k-space sampling via physiologic feedback for cine MRI. PLoS One. 2020;15(12):e0244286. doi:10.1371/journal.pone.0244286
3. Rodríguez-Soto AE, Schuchardt EL, Hegde S, Witschey WR, Contijoch F. Autonomous radial k-space sampling in 5D. SCMR 2023.
4. Ma LE, Yerly J, Piccini D, et al. 5D Flow MRI: A Fully Self-gated, Free-running Framework for Cardiac and Respiratory Motion-resolved 3D Hemodynamics. Radiol Cardiothorac Imaging. Nov 2020;2(6):e200219. doi:10.1148/ryct.2020200219
Figures
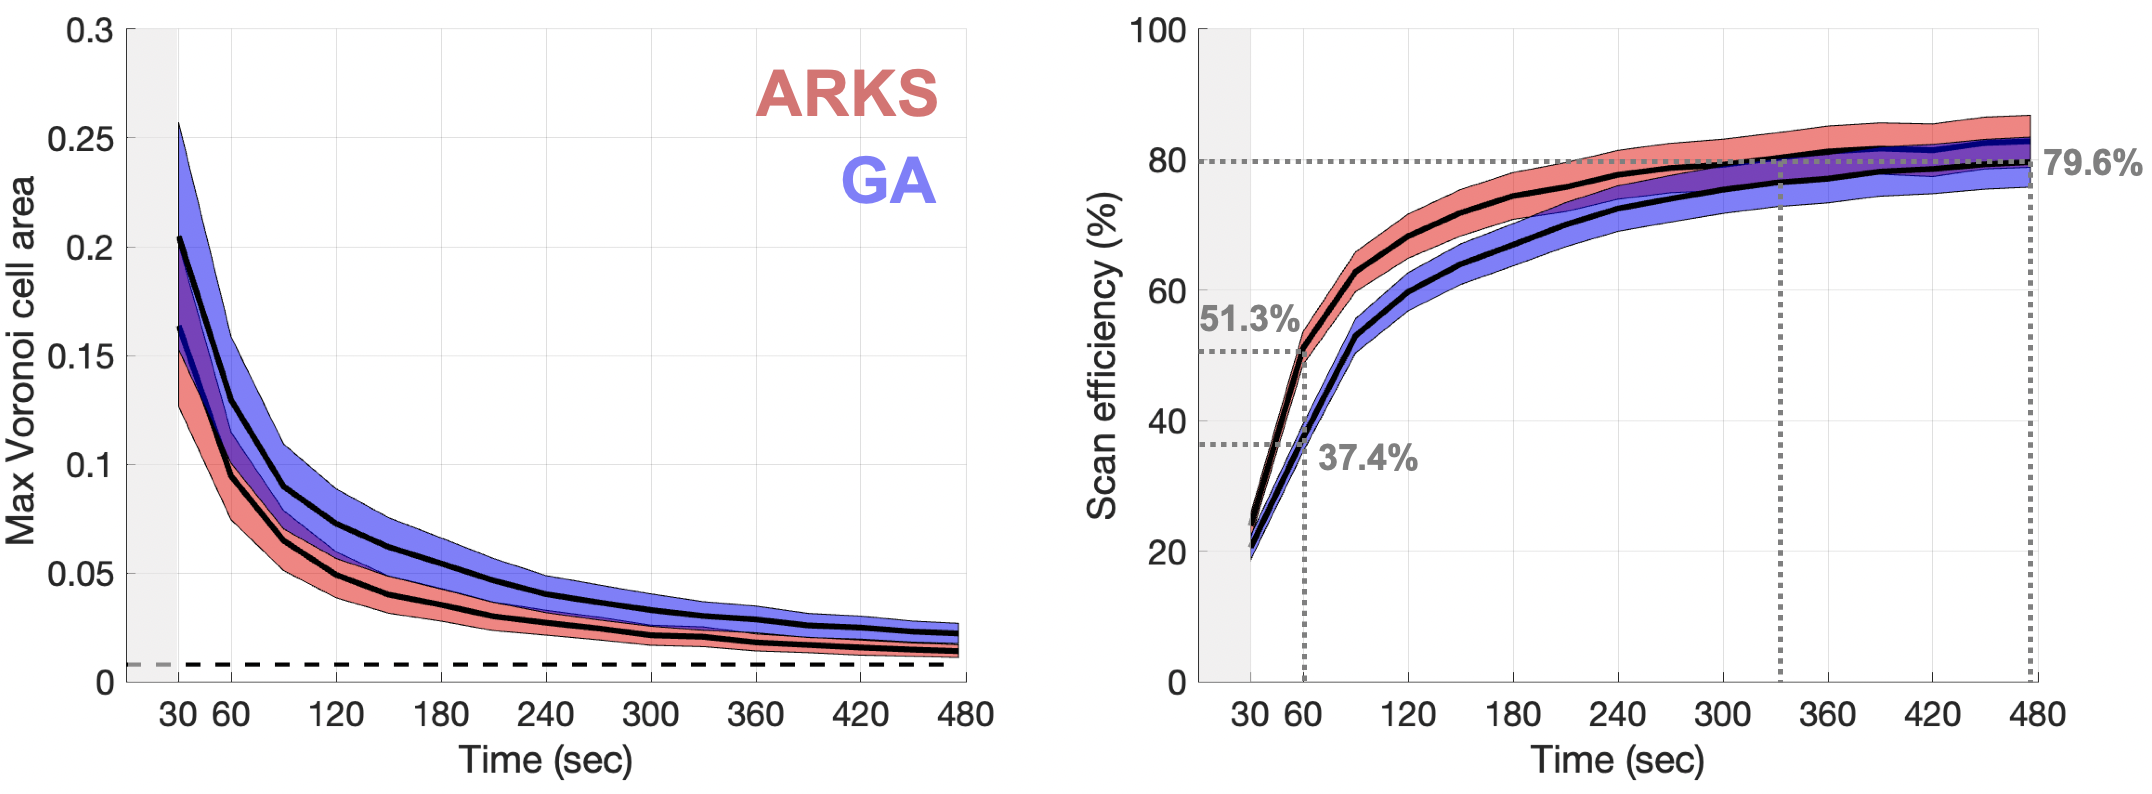
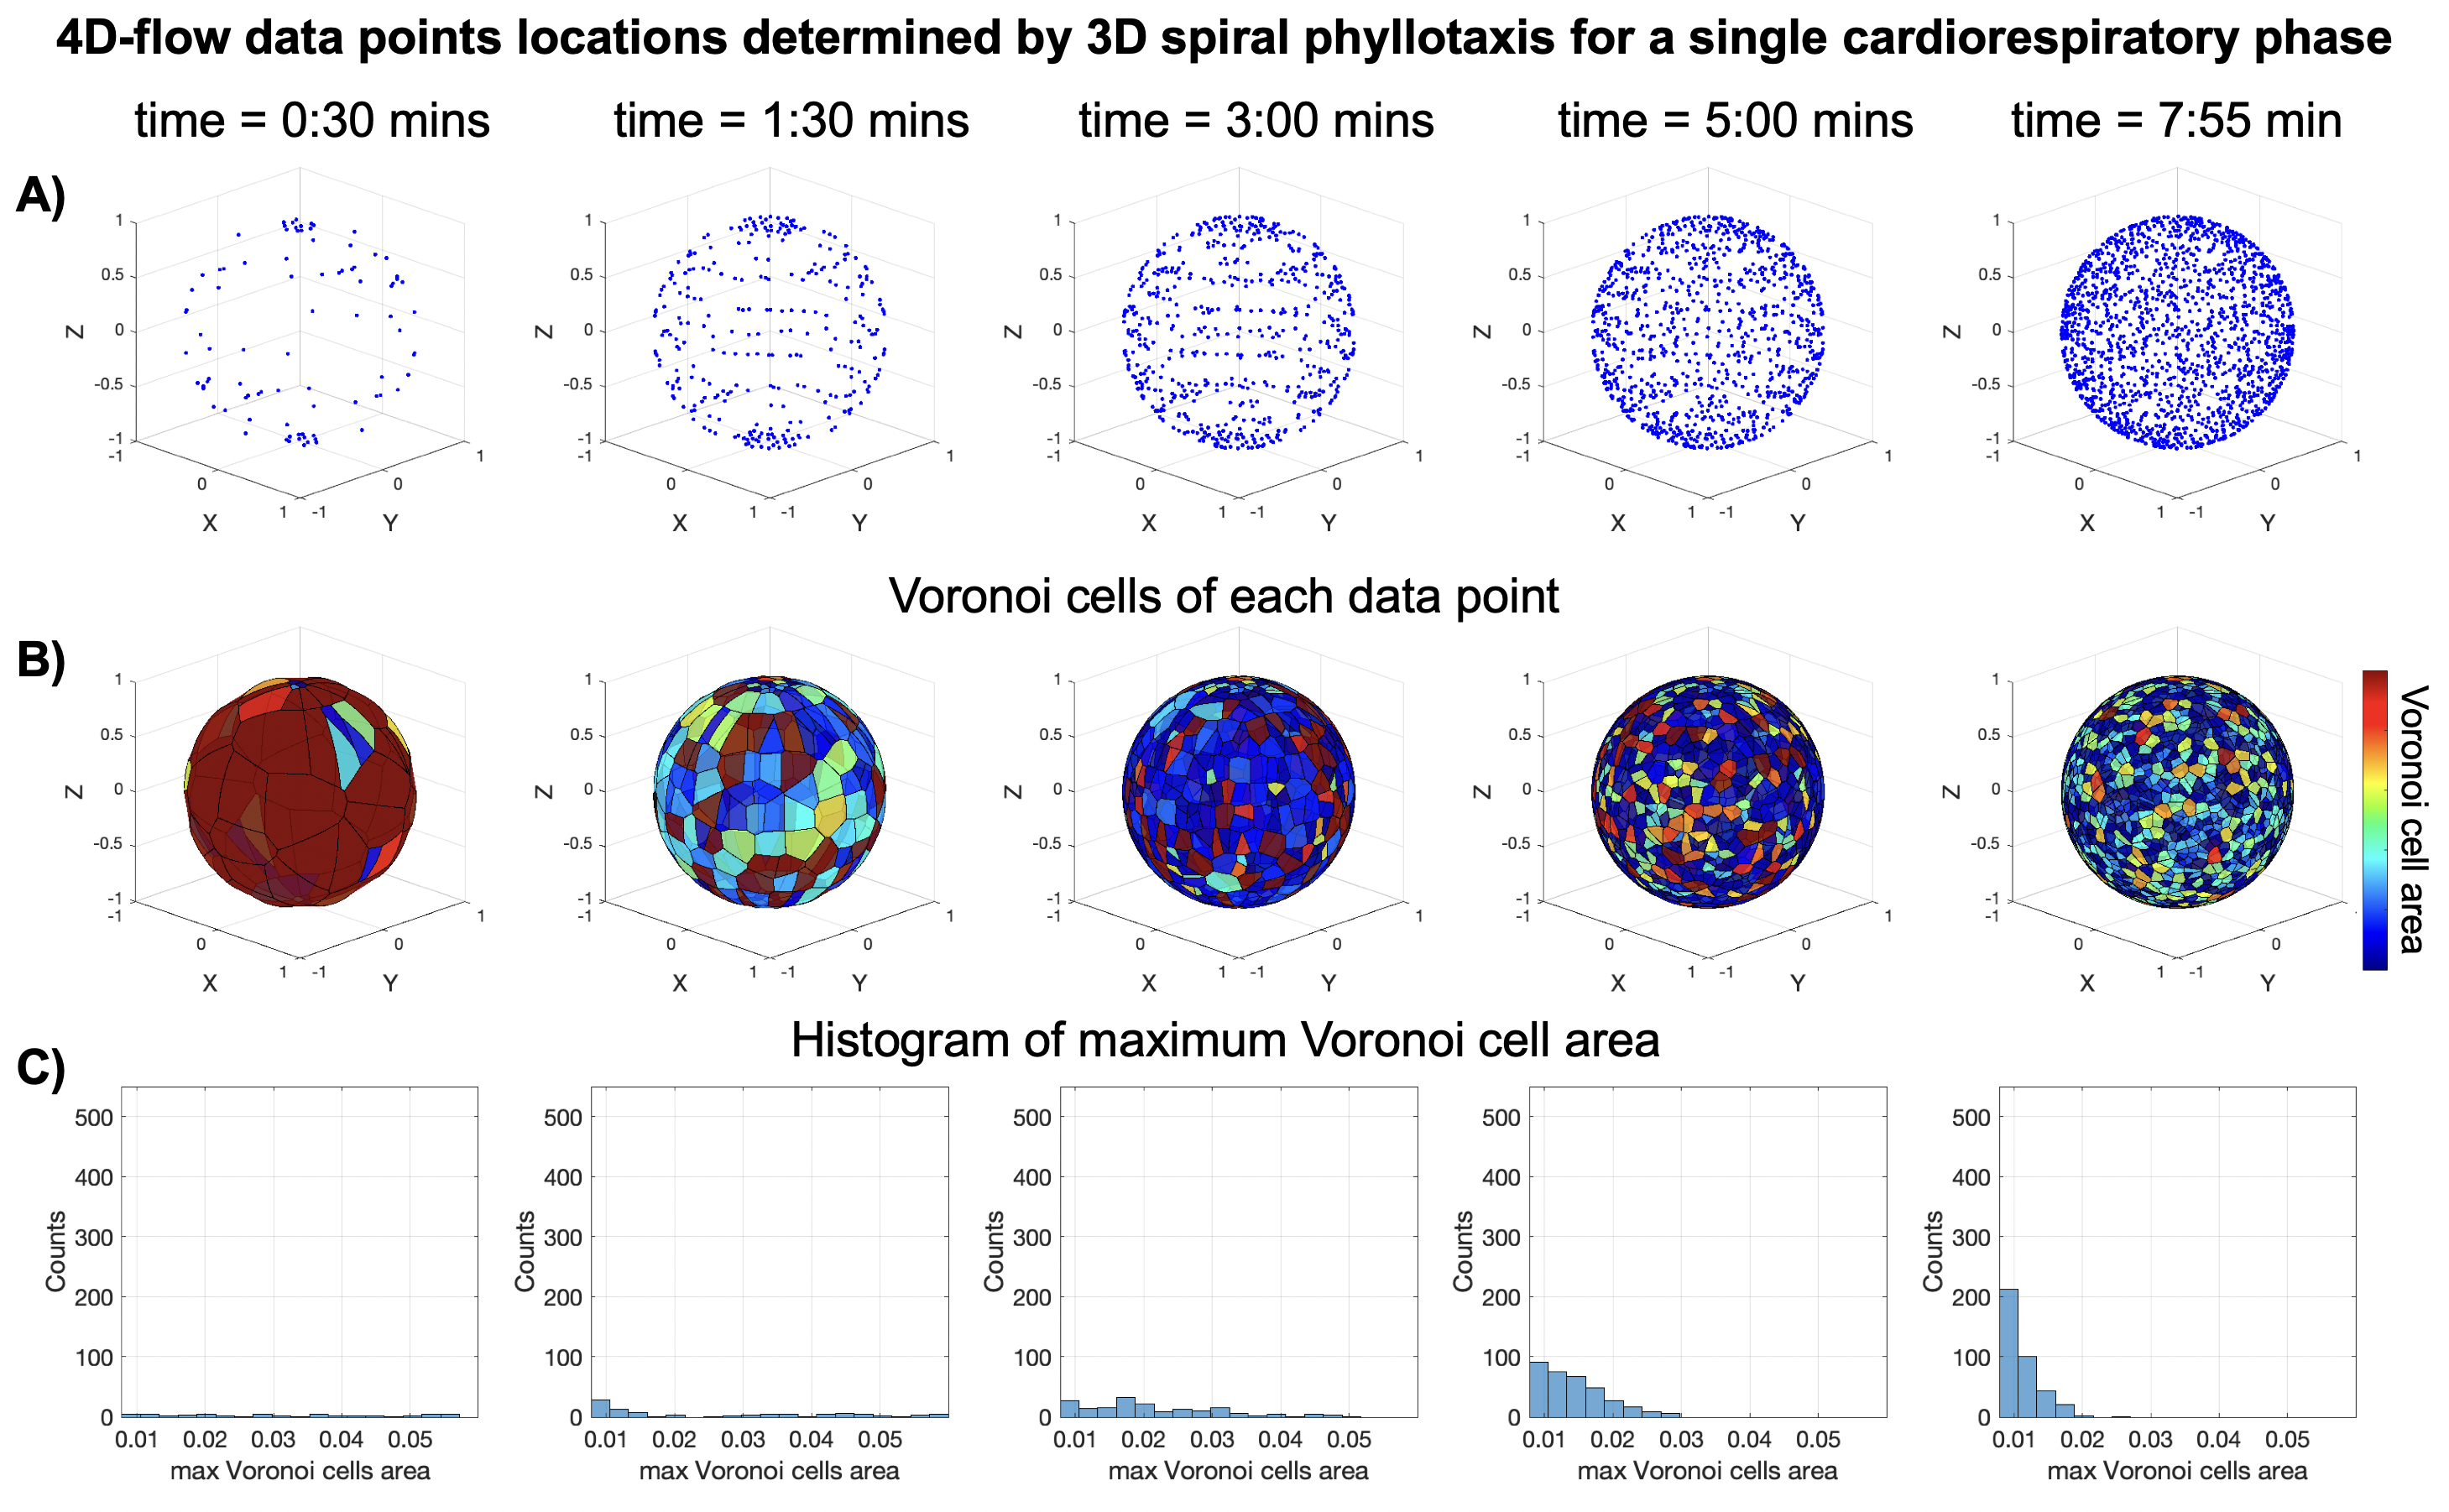
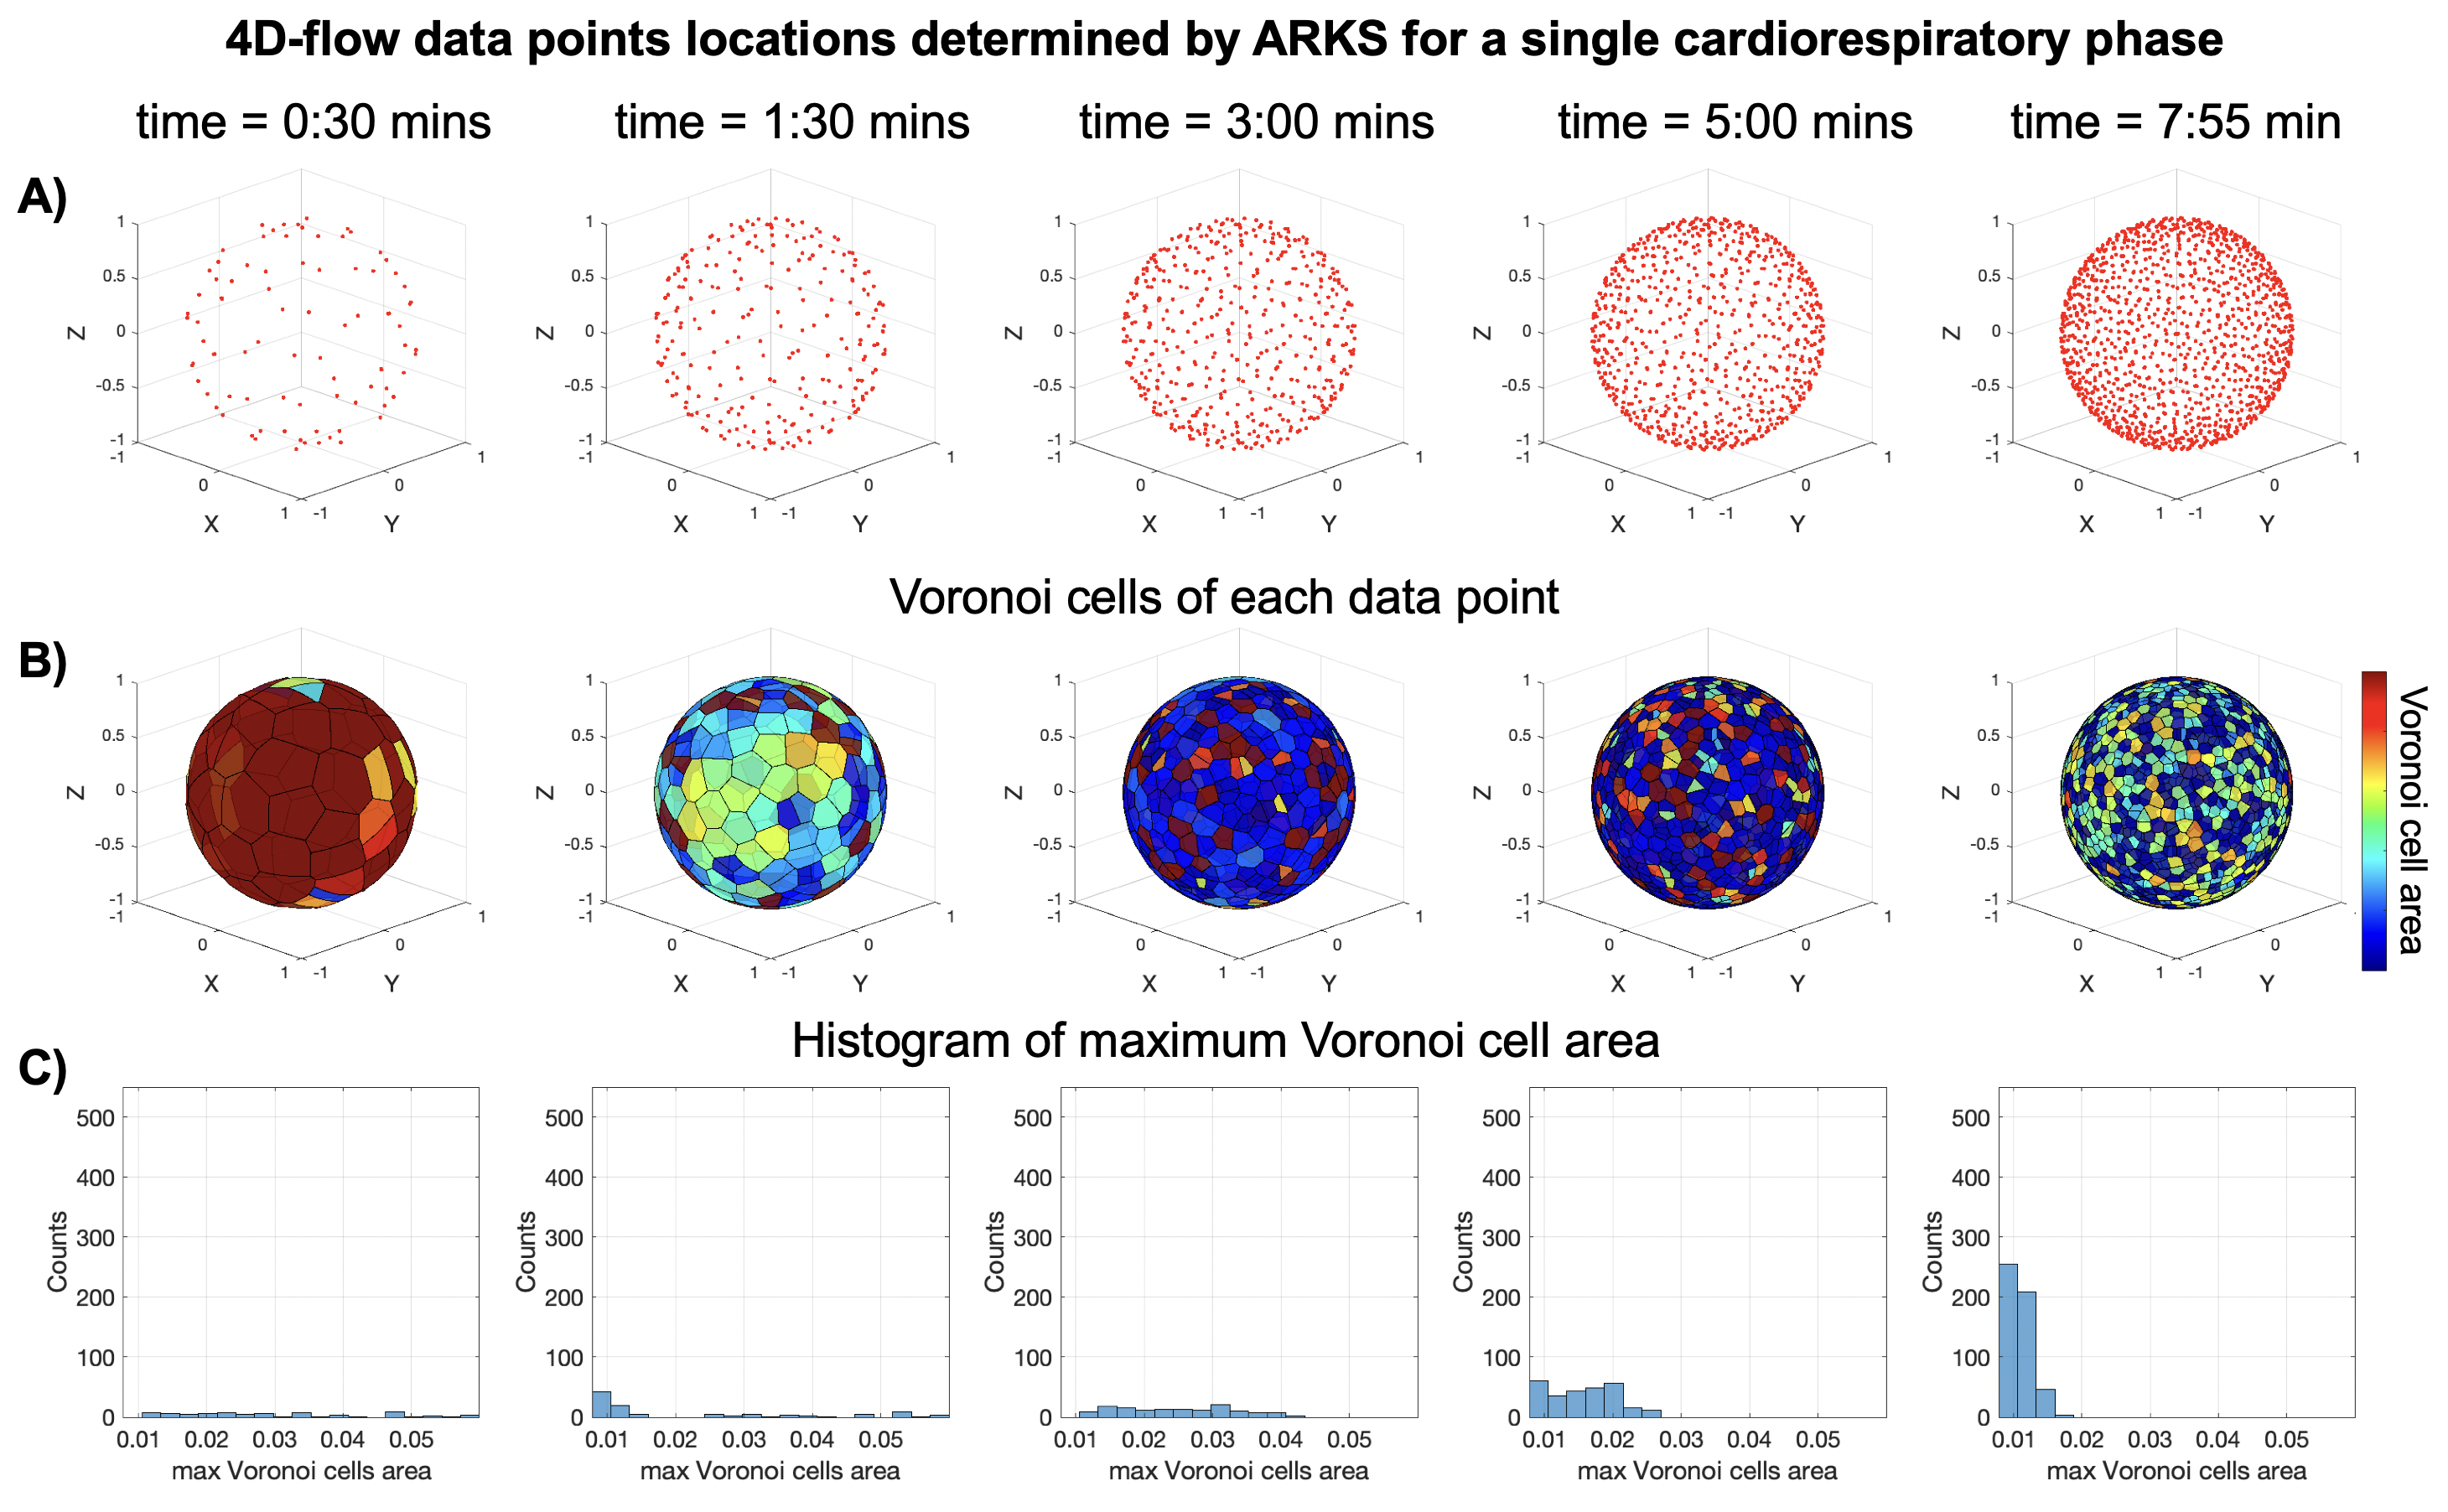
Figure 3. Location of data points in k-space of a 4D-flow sequence, as determined by 3D ARKS with cardiac and respiratory binning. A) 3D plot of the data-points in a sphere of radius one at 5 times during the scan simulation. B) Voronoi cells of the data-points from the top row. C) Histogram of the distribution of Voronoi cell areas at each time point.