0925
Estimation of Aortic Pressure Difference in Fontan Patients by 4D Flow MRI1Department of Biomedical Engineering and Environmental Sciences, National Tsing Hua University, Hsinchu, Taiwan, 2Department of Radiology, Kaohsiung Veterans General Hospital, Kaohsiung, Taiwan, 3Department of Pediatrics, Kaohsiung Veterans General Hospital, Kaohsiung, Taiwan, 4Department of Pediatrics, National Yang Ming Chiao Tung University, Taipei, Taiwan
Synopsis
Keywords: Heart, Cardiovascular
We aimed to evaluate the aortic blood pressure characteristics and cardiac function in patients after the Fontan operation. The Fontan group exhibited significantly increased peak diameter index and decreased peak velocity and peak flow rate in some of planes in the aorta. The Fontan group also presented decreased pressure difference (PD) in aortic arch and descending aorta. The aortic PD might be more sensitive than cardiac index in detection of cardiovascular alteration in Fontan patients. The aortic PD measured by 4D flow MRI can be a noninvasive alternative to characterize aortic remodeling.Introduction
Fontan procedure is the final stage of palliative surgery for patients with severe congenital heart diseases that lead to functional univentricular physiology1,2. Previous studies reported Fontan patients’ cardiac dysfunction and hemodynamics by arrhythmias by using noninvasive ECG and postoperative right atrial pressure measured by invasive catheterization3,4. In addition to the function of the single ventricle, the aorta is also vital to withstand the blood from the single ventricle in Fontan patients5.Noninvasive 4D flow MRI now enables comprehensive analysis of the aortic anatomy and function. Riesenkampff et al reported comparable pressure measured by 4D flow and catheterization in patients with aortic coarctation6. Vecchi et al assessed the advective pressure difference by 4D flow in pre-Fontan hypoplastic left heart syndrome patients to predict the vascular remodeling and stiffening seen at later stages7. However, the interaction of aortic pressure difference (PD) and cardiac function in post-Fontan patients is unclear. We aimed to evaluate the aortic blood pressure characteristics and cardiac function in patients after the Fontan operation.
Methods
This study recruited 25 Fontan patients (16.5±4.2 y/o, males/females=13/12) and 30 age-appropriate normal controls (21.7±1.0 y/o, males/females=18/12). All MR images were acquired on a 3.0-Tesla MR scanner (Trio with Tim or Skyra, Siemens, Erlangen, Germany). Steady-state free precession imaging with prospective ECG-gating and breath-hold technique was performed with scanning parameters as follows: TR=3.2 ms, TE=1.7 ms, flip angle=50°, voxel size=1.25x1.25x8 mm3, gap=2 mm. 4D flow MRI was performed with prospective ECG trigging, navigator-guided free-breathing technique, and the scanning parameters of TR=5.5 ms, TE=2.6 ms, flip angle=7°, voxel size=2.2x1.5x3.5 mm3, Venc=150 cm/s. Denoising, anti-aliasing, and phase correction were applied to 4D flow data. Fourteen 2D planes were inserted into the aorta for flow analysis, as shown in Figure 1a. The regions-of-interest (ROI) of the aortic lumen were manually determined in magnitude images and transferred to phase images for computation of aortic flow-related indices (Figure 1b). The simplified Bernoulli equation states that the PD across a stenotic orifice is four times the square of the velocity of the high-velocity jet (Vmax) (Figure 1c), as described in 8:PD=4Vmax2In this study, the reference plane (PD = 0) is determined in the plane 1 in the sinuses of valsalva (Figure 1a). The cardiac phase was normalized to the end-diastolic time and indicated as percentage of end-systole (%ES). Student t test and Pearson correlation coefficient were employed when appropriate. p < 0.05 was considered as statistical significancResult
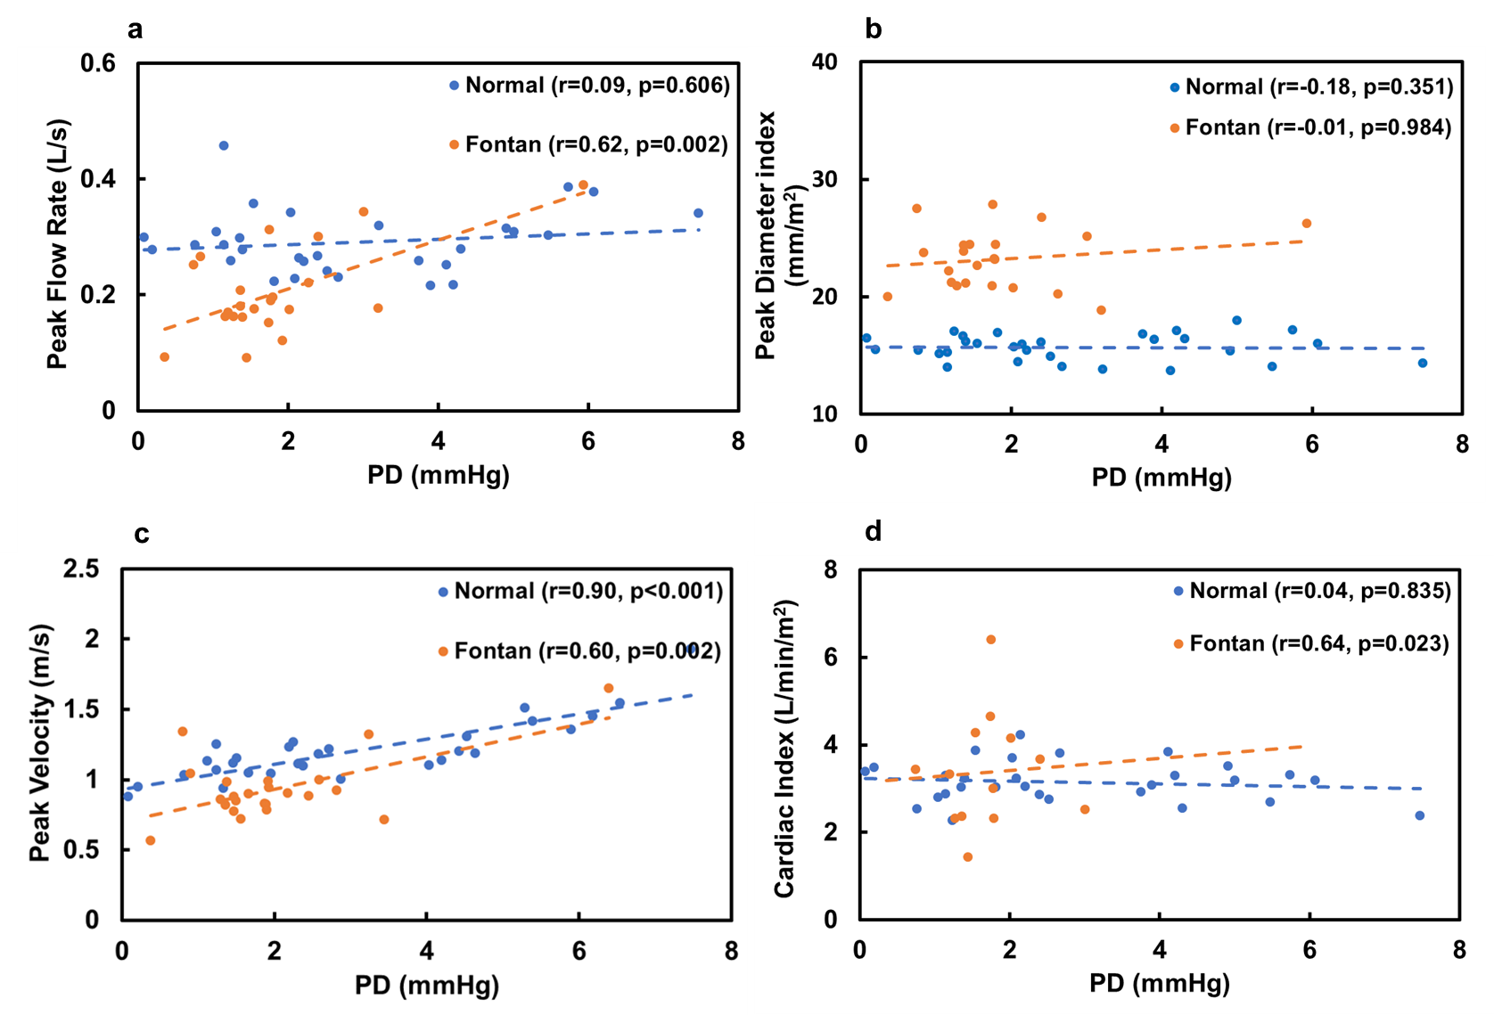
Table 1 illustrates the demographics and cardiac MRI volumetric parameters in normal and Fontan groups. In Figure 2a, Fontan group exhibited a significantly increased peak diameter index in comparison with normal group in plane 1-8 (p<0.05~0.001). In Figure 2b, compared to normal group, the Fontan group presented significantly lower peak velocity in 12 of 14 planes (p<0.05~0.001). The PD in Fontan group were significantly lower than that in normal group in plane 8-10 and 13 (p<0.05~0.01, Figure 2c). The peak flow rate in plane 1 (aortic root) was significantly lower in Fontan group (p<0.01, Figure 2d). In spatiotemporal PD maps (Figure 3b), Fontan group performed decreased PD and prolonged time-to-peak compared to normal group. In Figure 4, PD was not correlated with peak diameter index in normal (p=0.351) or Fontan (p=0.984) groups. PD presented positive correlation with peak velocity in normal (r=0.9, p<0.001) and Fontan (r=0.6, p=0.002) groups. PD exhibited moderate correlations with peak flow rate (r=0.62, p=0.002) and cardiac index (r=0.64, p=0.023) only in Fontan group.Discussion and Conclusions
In this study, the Fontan group exhibited significantly increased peak diameter index and decreased peak velocity and peak flow rate in some of planes in the aorta. The Fontan group also presented decreased PD in aortic arch and descending aorta.In this study, the cardiac output and cardiac index in Fontan group were comparable with that in control group. A previous study reported decreased cardiac index in Fontan patients [9]. The inconsistency might root in the fact that our Fontan patients had sufficient intrinsic preload reserve [10] and a trend of increasing heart rate and consequently exhibited preserved cardiac index. Ohuchi et al demonstrated the association between a drop in aortic pressure and decreased cardiac output and impaired cardiac function in Fontan patients [11]. In this study, Fontan patients presented a correlation between decreased aortic PD and preserved cardiac index, implying that aortic PD alteration might be more sensitive than cardiac index.
A previous study described that the decreased PD might induce higher risk of vascular remodeling and stiffening [7]. In the Fontan group of this study, PD correlated with peak flow rate and peak velocity but had no correlation with peak diameter index, indicating that the functional alterations in PD and peak flow velocity could be observed before substantial morphological alteration in the aorta. Therefore, estimation of aortic PD may be helpful in surveillance of potential aortic remodeling in Fontan patients.
In conclusion, the aortic PD might be more sensitive than cardiac index in detection of cardiovascular alteration in Fontan patients. The aortic PD measured by 4D flow MRI can be a noninvasive alternative to characterize aortic remodeling.
Acknowledgements
No acknowledgement found.References
Fontan, F., and E. Baudet. "Surgical repair of tricuspid atresia." Thorax 26.3 (1971): 240-248.
Puricelli, Filippo, et al. "Performance of Cardiac MRI in Pediatric and Adult Patients with Fontan Circulation." Radiology: Cardiothoracic Imaging 4.3 (2022): e210235.
Khairy, Paul, Nancy Poirier, and Lise-Andrée Mercier. "Univentricular heart." Circulation 115.6 (2007): 800-812.
Khairy, Paul, et al. "Long-term survival, modes of death, and predictors of mortality in patients with Fontan surgery." Circulation 117.1 (2008): 85-92.
Cardis, Brian M., Derek A. Fyfe, and William T. Mahle. "Elastic properties of the reconstructed aorta in hypoplastic left heart syndrome." The Annals of thoracic surgery 81.3 (2006): 988-991.
Riesenkampff, Eugénie, et al. "Pressure fields by flow-sensitive, 4D, velocity-encoded CMR in patients with aortic coarctation." JACC: Cardiovascular Imaging 7.9 (2014): 920-926.
De Vecchi, Adelaide, et al. "Unlocking the Non-invasive Assessment of Conduit and Reservoir Function in the Aorta." Journal of cardiovascular translational research (2022): 1-11.
Bock, Jelena, et al. "In vivo noninvasive 4D pressure difference mapping in the human aorta: phantom comparison and application in healthy volunteers and patients." Magnetic resonance in medicine 66.4 (2011): 1079-1088.
Senzaki, Hideaki, et al. "Cardiac rest and reserve function in patients with Fontan circulation." Journal of the American College of Cardiology 47.12 (2006): 2528-2535..
Gewillig, Marc, et al. "The Fontan circulation: who controls cardiac output?." Interactive cardiovascular and thoracic surgery 10.3 (2010): 428-433.
Ohuchi, Hideo, et al. "Hemodynamic determinants of mortality after Fontan operation." American heart journal 189 (2017): 9-18.
Hill, Ethan C et al. “The Contributions of Arterial Cross-Sectional Area and Time-Averaged Flow Velocity to Arterial Blood Flow.” Journal of medical ultrasound vol. 26,4 (2018): 186-193.
Figures
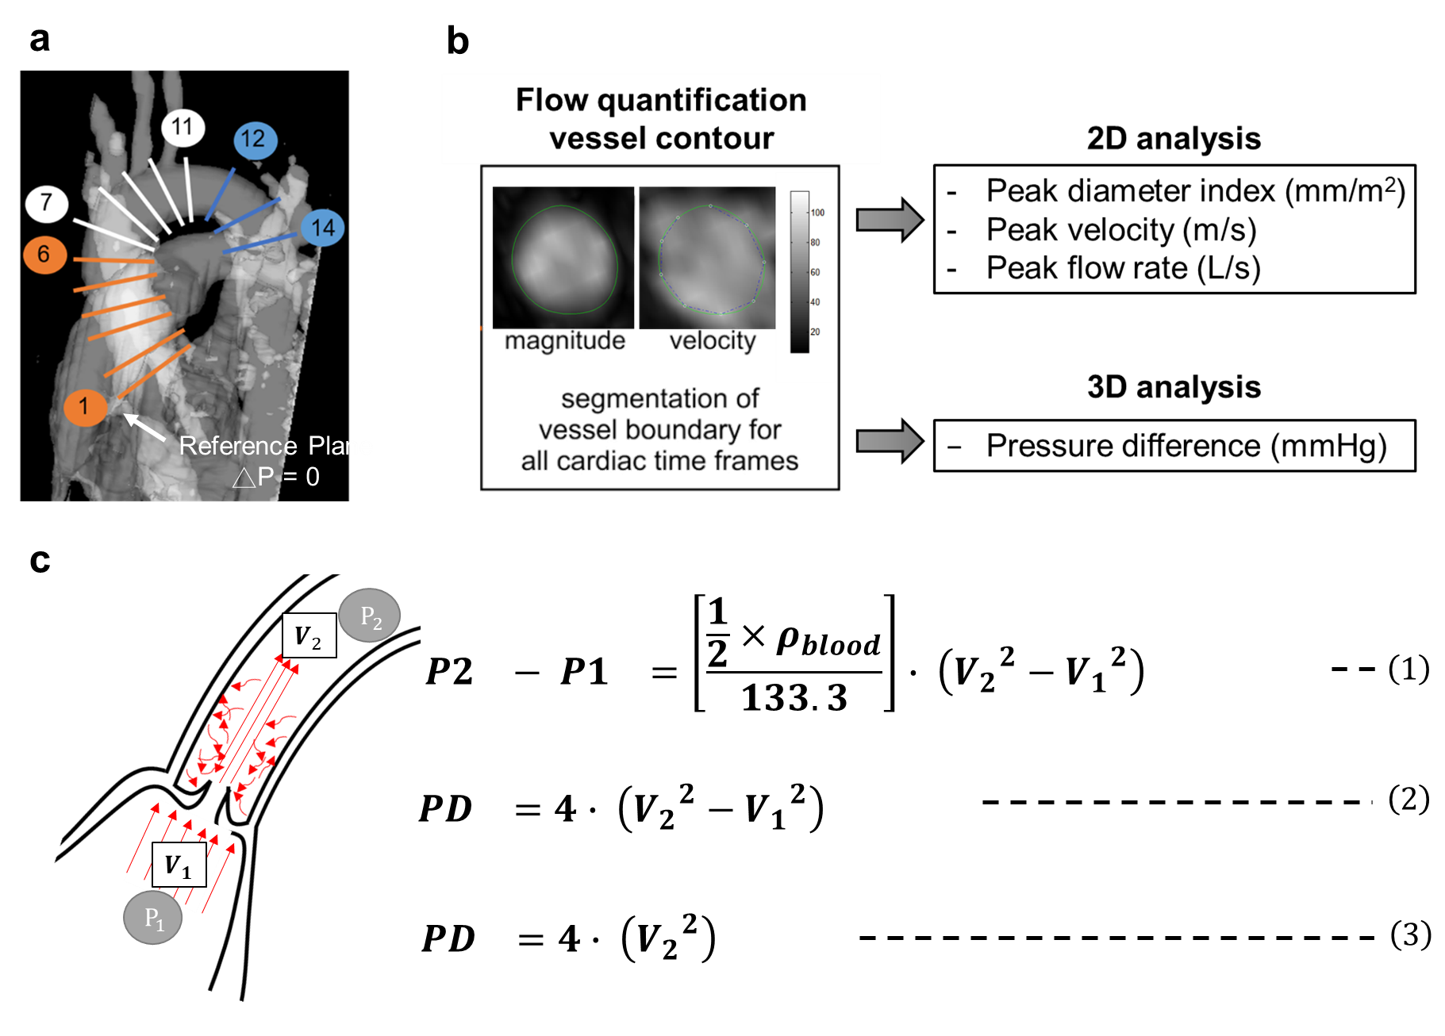

Table 1. Demographics and cardiac function in normal and Fontan groups.
Ventricular measurements are indexed to body surface area (BSA). SBP: systolic blood pressure, DBP: diastolic blood pressure, EDVi and ESVi: indexed end diastolic and systolic volume, Massi: indexed mass, SVi: indexed stroke volume, EF: ejection fraction, CO: cardiac output, CI: cardiac index.
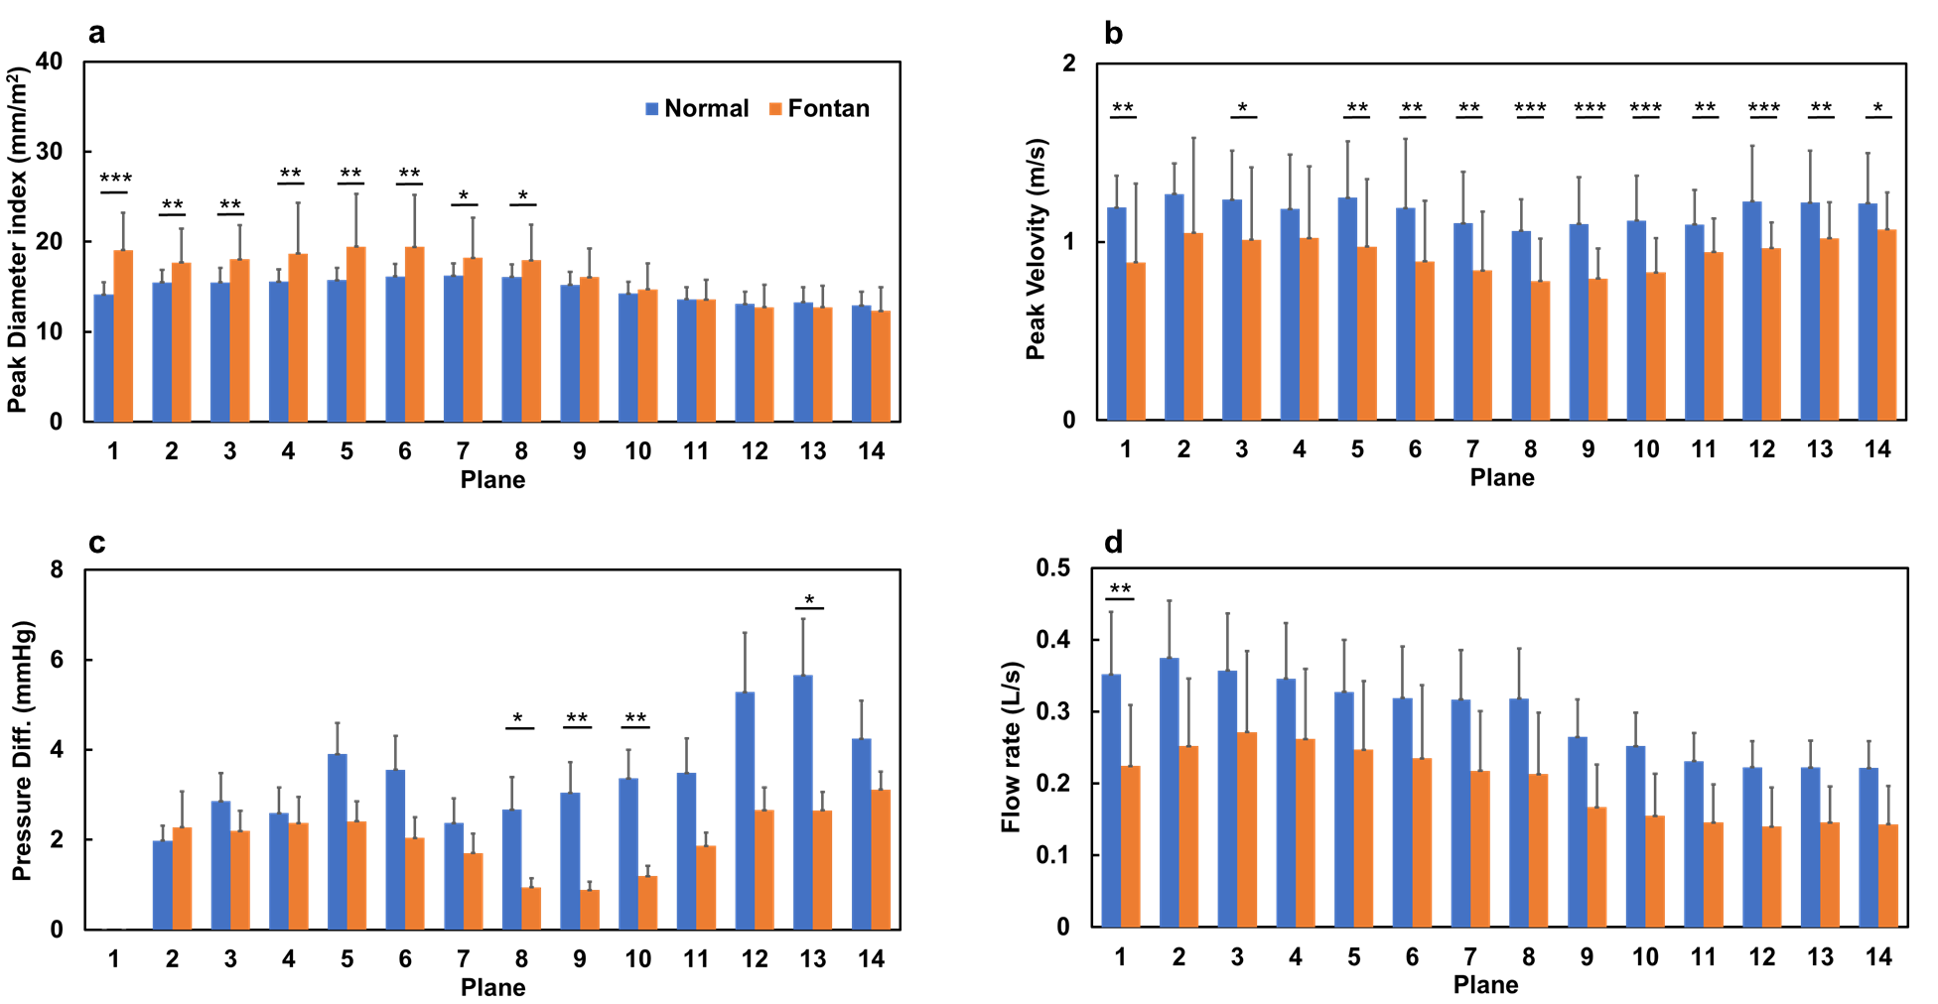
Figure 2. The indexed peak diameter (a), peak velocity index (b), pressure difference (c) and peak flow rate at 14 planes along the aorta in normal and Fontan groups. *p<0.05, **p<0.01, ***p<0.001.
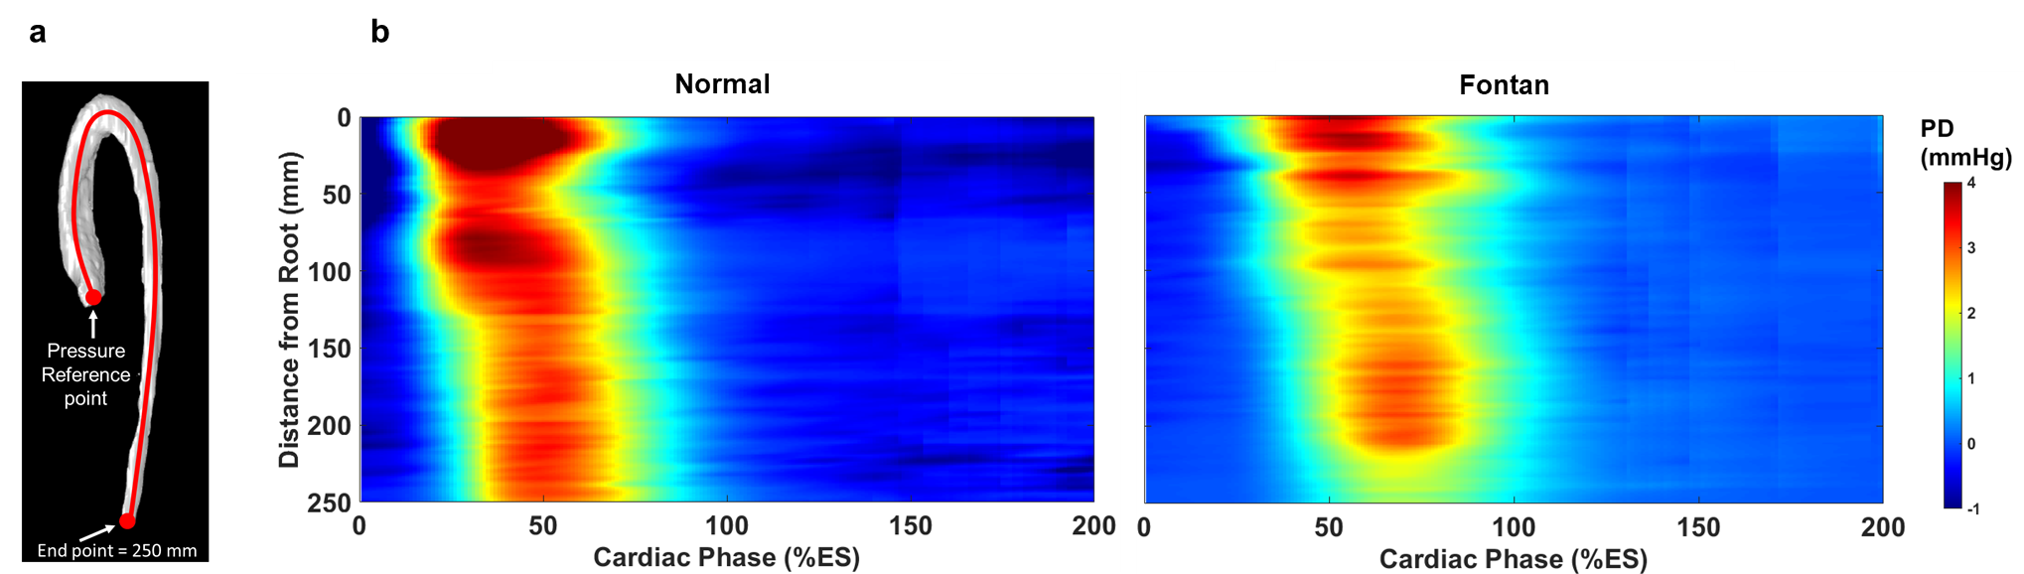
Figure 3. (a) The illustration of central line along the aorta. (b,c) The spatiotemporal pressure difference maps along the central line starting from the aortic root (pressure reference point in (a)) in normal and Fontan groups. %ES: All cardiac frames were normalized to the end systolic time.