0924
4D flow MRI to evaluate flow and future liver remnant growth after portal vein embolization1Department of Radiology, University of Wisconsin-Madison, Madison, USA, WI, United States, 2Department of Radiology, Universität zu Lübeck, Lübeck, Germany, 3Department of Neuroradiology, Zurich University Hospital, Zurich, Switzerland, 4Department of Biostatistics and Medical Informatics, University of Wisconsin-Madison, Madison, WI, United States, 5Department of Medical Physics, University of Wisconsin-Madison, Madison, WI, United States, 6Department of Electrical and Computer Engineering, University of Wisconsin-Madison, Madison, WI, United States, 7Department of Radiology, University of Wisconsin-Madison, Madison, WI, United States, 8Department of Mechanical Engineering, University of Wisconsin-Madison, Madison, WI, United States, 9Department of Biomedical Engineering, University of Wisconsin-Madison, Madison, WI, United States, 10Department of Emergency Medicine, University of Wisconsin-Madison, Madison, WI, United States
Synopsis
Keywords: Liver, Velocity & Flow
Early prediction of remnant liver growth after portal vein embolization (PVE) would enable earlier surgery in patients with liver malignancies and thus decrease the risk of tumor progression. Portal blood flow after PVE holds the potential to be an important predictor for hypertrophy of the non-embolized segments. We demonstrated the feasibility of 4D flow MRI quantification of portal blood flow before and after PVE in a porcine model. Flow changes immediately after PVE were predictive of the change in liver volume 2 weeks post PVE in both the embolized and non-embolized liver lobes.
Introduction
Only 10-30% of patients with liver malignancies are eligible for curative resection1,2. A major contraindication to partial hepatectomy is insufficient residual volume to maintain liver function after surgery1,3. Presurgical portal vein embolization (PVE) induces hypertrophy of the non-embolized lobe, i.e., future remnant liver, to make patients eligible for surgery4. Unfortunately, 7-14% of patients experience tumor progression before sufficient hypertrophy is achieved2,5. Early prediction of hypertrophy would facilitate earlier surgery. Portal blood flow is a major driver of hypertrophy6 that can be measured with 4D flow MRI7. We aimed to demonstrate the feasibility of 4D flow MRI to detect changes in portal blood flow before and after PVE. Moreover, the goal was to determine whether 4D flow MRI can predict the hypertrophy of non-embolized liver segments.Methods
Study protocol:Thirteen juvenile white pigs were included after institutional animal care and use committee approval. Eleven pigs underwent bland embolization of two of the four portal vein branches using polyvinyl alcohol (PVA) particles via percutaneous catheterization of the portal vein. Two untreated control pigs served as a reference. Pigs were imaged immediately before and after PVE and at 1- and 2-week time points (Figure 1). After the final MRI, the pigs were medically euthanized during anesthesia.
MRI:
Imaging was performed at 3T after 12 hours of fasting. Radial 4D flow MRI (PCVIPR8,9) was acquired to quantify portal hemodynamics. T1-weighted 3D spoiled gradient echo images were acquired for volumetric measurements (Figure 2).
Analysis:
4D flow data were reconstructed offline. Background phase correction8 was performed with a custom MATLAB (MathWorks, USA) tool. Flow measurements were performed in EnSight (CEI Inc., USA) at 5 manually delineated vessel cross-sections (Figure 2). Hemodynamics were visualized with GTFlow (Gyrotools, Switzerland). Volumetric measurements of the liver were performed manually using Osirix (Pixmeo, Switzerland).
Blood flow in lobar portal veins was normalized to the blood flow in the main portal vein to adjust for potential global flow variations due to external factors and pig growth. Using SAS (SAS Institute Inc., USA), we performed a linear mixed effect model analysis to examine the predictive value of flow change between visits 1 and 2 for liver lobe volume change at visit 4, using individual pig as random effect. Moreover, we fit a linear mixed model with lobe volume as outcome, and with treatment and time as fixed effects, while adjusting for repeated measures using individual pig lobe as random effect.
Results
12/13 animals, including all controls, survived all procedures. One animal died from complications of anesthesia.We successfully measured portal venous flow and liver lobe volume without significant differences between embolized, non-embolized, and reference liver lobes at visit 1 (Figure 3). Immediately after PVE, flow decreased in the embolized vessels from 17.0±7.4% to 3.4±4.1% of total portal flow while it increased to 32.6±20.5% in the non-embolized vessels (Figure 4). The volume of the embolized lobes decreased 1 and 2 weeks after embolization while the non-embolized lobes grew significantly (p<0.0001, Figure 5).
Each 1% increase in relative blood flow to non-embolized lobes immediately after the procedure predicted a 4.8±0.7cm³ increase of lobe volume at 2 weeks (estimate±standard error, p<0.0001). For the embolized liver lobes, each 1% decrease of blood flow immediately after the procedure was correlated with a 3.7±1.1 cm³ decrease of lobe volume at 2 weeks (estimate±standard error, p=0.002). There was no significant difference in the lobe volume between non-embolized and reference lobes at any visit (p=1.00).
Discussion
In this study, we successfully demonstrated the feasibility of 4D flow MRI to quantify portal blood flow before, immediately after, and longitudinally in a porcine model of PVE. We also demonstrated that changes in blood flow predicted the change in liver volume at 2 weeks in both the embolized and non-embolized lobes.Portal blood flow has been identified as a parameter that drives liver hypertrophy in adult patients after resection and PVE6. Doppler sonography proved increased velocity in the embolized lobes to correlate with lobe hypertrophy10,11. Given the high compliance of the portal venous system, velocity may not correlate linearly with flow volumes. Therefore, accurate flow measurements as provided by 4D flow MRI are necessary to characterize changes in portal hemodynamics.
Early prediction of hypertrophy can guide treatment to either repeated PVE or timely partial hepatectomy. This may improve patient outcome as 24% of patients fail to undergo surgery after PVE because of insufficient hypertrophy, local or extrahepatic tumor progression, or other complications12.
Limitations include failure to induce hypertrophy that exceeded normal liver growth within 2 weeks after PVE. We hypothesize that residual liver volume in healthy, growing pigs was sufficient to maintain liver function. Future PVE animal models should include full-grown pigs. Nonetheless, we demonstrated the technical feasibility of 4D flow MRI to predict liver growth. Future studies will evaluate the value of 4D flow MRI after PVE in humans.
Conclusion
4D flow MRI can quantify changes in portal blood flow after PVE in a porcine model. Changes in blood flow immediately after the procedure predicted liver volume changes at 2 weeks. Interestingly, we found that growing pigs do not respond to PVE with hypertrophy of the non-embolized liver lobes beyond normal growth.Acknowledgements
The authors wish to acknowledge support from the NIH (R01 DK096169, UL1TR00427, K24 DK102595, R01 DK125783), as well as GE Healthcare which provides research support to the University of Wisconsin and Bracco Diagnostics. Dr. Oechtering receives funding from the German Research Foundation (OE 746/1-1). Dr. Reeder is a Fred Lee Sr. Endowed Chair of Radiology.
References
1. Memeo R, Conticchio M, Deshayes E, et al. Optimization of the future remnant liver: review of the current strategies in Europe. Hepatobiliary Surg Nutr 2021;10:350-63.
2. van Lienden KP, van den Esschert JW, de Graaf W, et al. Portal vein embolization before liver resection: a systematic review. Cardiovascular and interventional radiology 2013;36:25-34.
3. Espersen C, Borgwardt L, Larsen PN, Andersen TB, Stenholt L, Petersen LJ. Comparison of nuclear imaging techniques and volumetric imaging for the prediction of postoperative mortality and liver failure in patients undergoing localized liver-directed treatments: a systematic review. EJNMMI Res 2021;11:80.
4. Heil J, Schiesser M, Schadde E. Current trends in regenerative liver surgery: Novel clinical strategies and experimental approaches. Front Surg 2022;9:903825.
5. Abulkhir A, Limongelli P, Healey AJ, et al. Preoperative portal vein embolization for major liver resection: a meta-analysis. Annals of surgery 2008;247:49-57.
6. Hadjittofi C, Feretis M, Martin J, Harper S, Huguet E. Liver regeneration biology: Implications for liver tumour therapies. World J Clin Oncol 2021;12:1101-56.
7. Oechtering TH, Roberts GS, Panagiotopoulos N, Wieben O, Reeder SB, Roldan-Alzate A. Clinical Applications of 4D Flow MRI in the Portal Venous System. Magn Reson Med Sci 2022.
8. Gu T, Korosec FR, Block WF, et al. PC VIPR: a high-speed 3D phase-contrast method for flow quantification and high-resolution angiography. AJNR American journal of neuroradiology 2005;26:743-9.
9. Johnson KM, Markl M. Improved SNR in phase contrast velocimetry with five-point balanced flow encoding. Magnetic resonance in medicine : official journal of the Society of Magnetic Resonance in Medicine / Society of Magnetic Resonance in Medicine 2010;63:349-55.
10. Kito Y, Nagino M, Nimura Y. Doppler sonography of hepatic arterial blood flow velocity after percutaneous transhepatic portal vein embolization. AJR American journal of roentgenology 2001;176:909-12.
11. Kin Y, Nimura Y, Hayakawa N, et al. Doppler analysis of hepatic blood flow predicts liver dysfunction after major hepatectomy. World journal of surgery 1994;18:143-9.
12. Huang Y, Ge W, Kong Y, et al. Preoperative Portal Vein Embolization for Liver Resection: An updated meta-analysis. J Cancer 2021;12:1770-8.
Figures
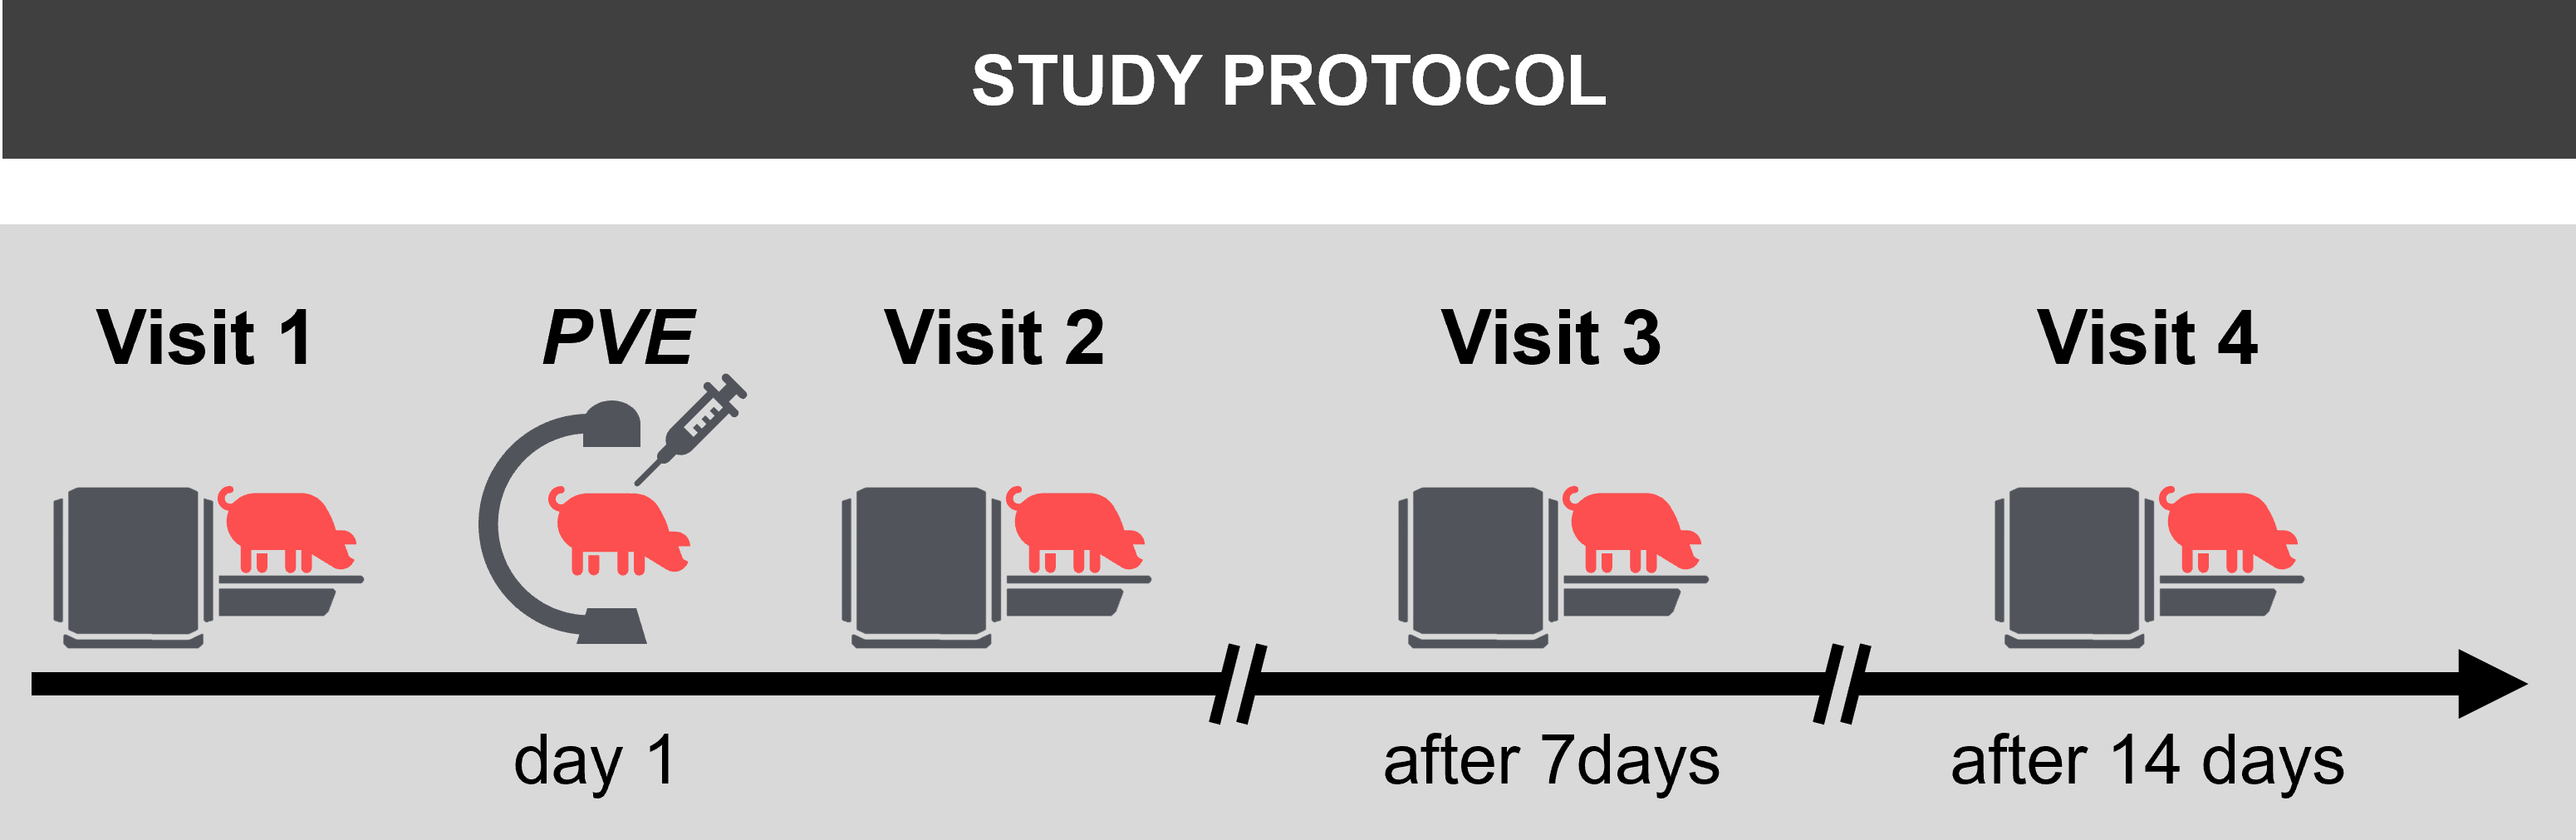
Figure 1: Pigs (14-16 weeks, 45-60kg) were examined directly before and after portal vein embolization (PVE) as well as 1 and 2 weeks after PVE. PVE was performed after percutaneous access to the right lateral portal vein branch under ultrasound guidance. Two of the 4 main portal vein branches were embolized under fluoroscopy guidance until stasis of flow was achieved. Embolic agent were 150-355 microns polyvinyl-alcohol-particles (Merit Medical, UT, USA) in 40% iodine contrast agent (Iopamiron 300, Bracco; Milano, Italy) and 60% normal saline.
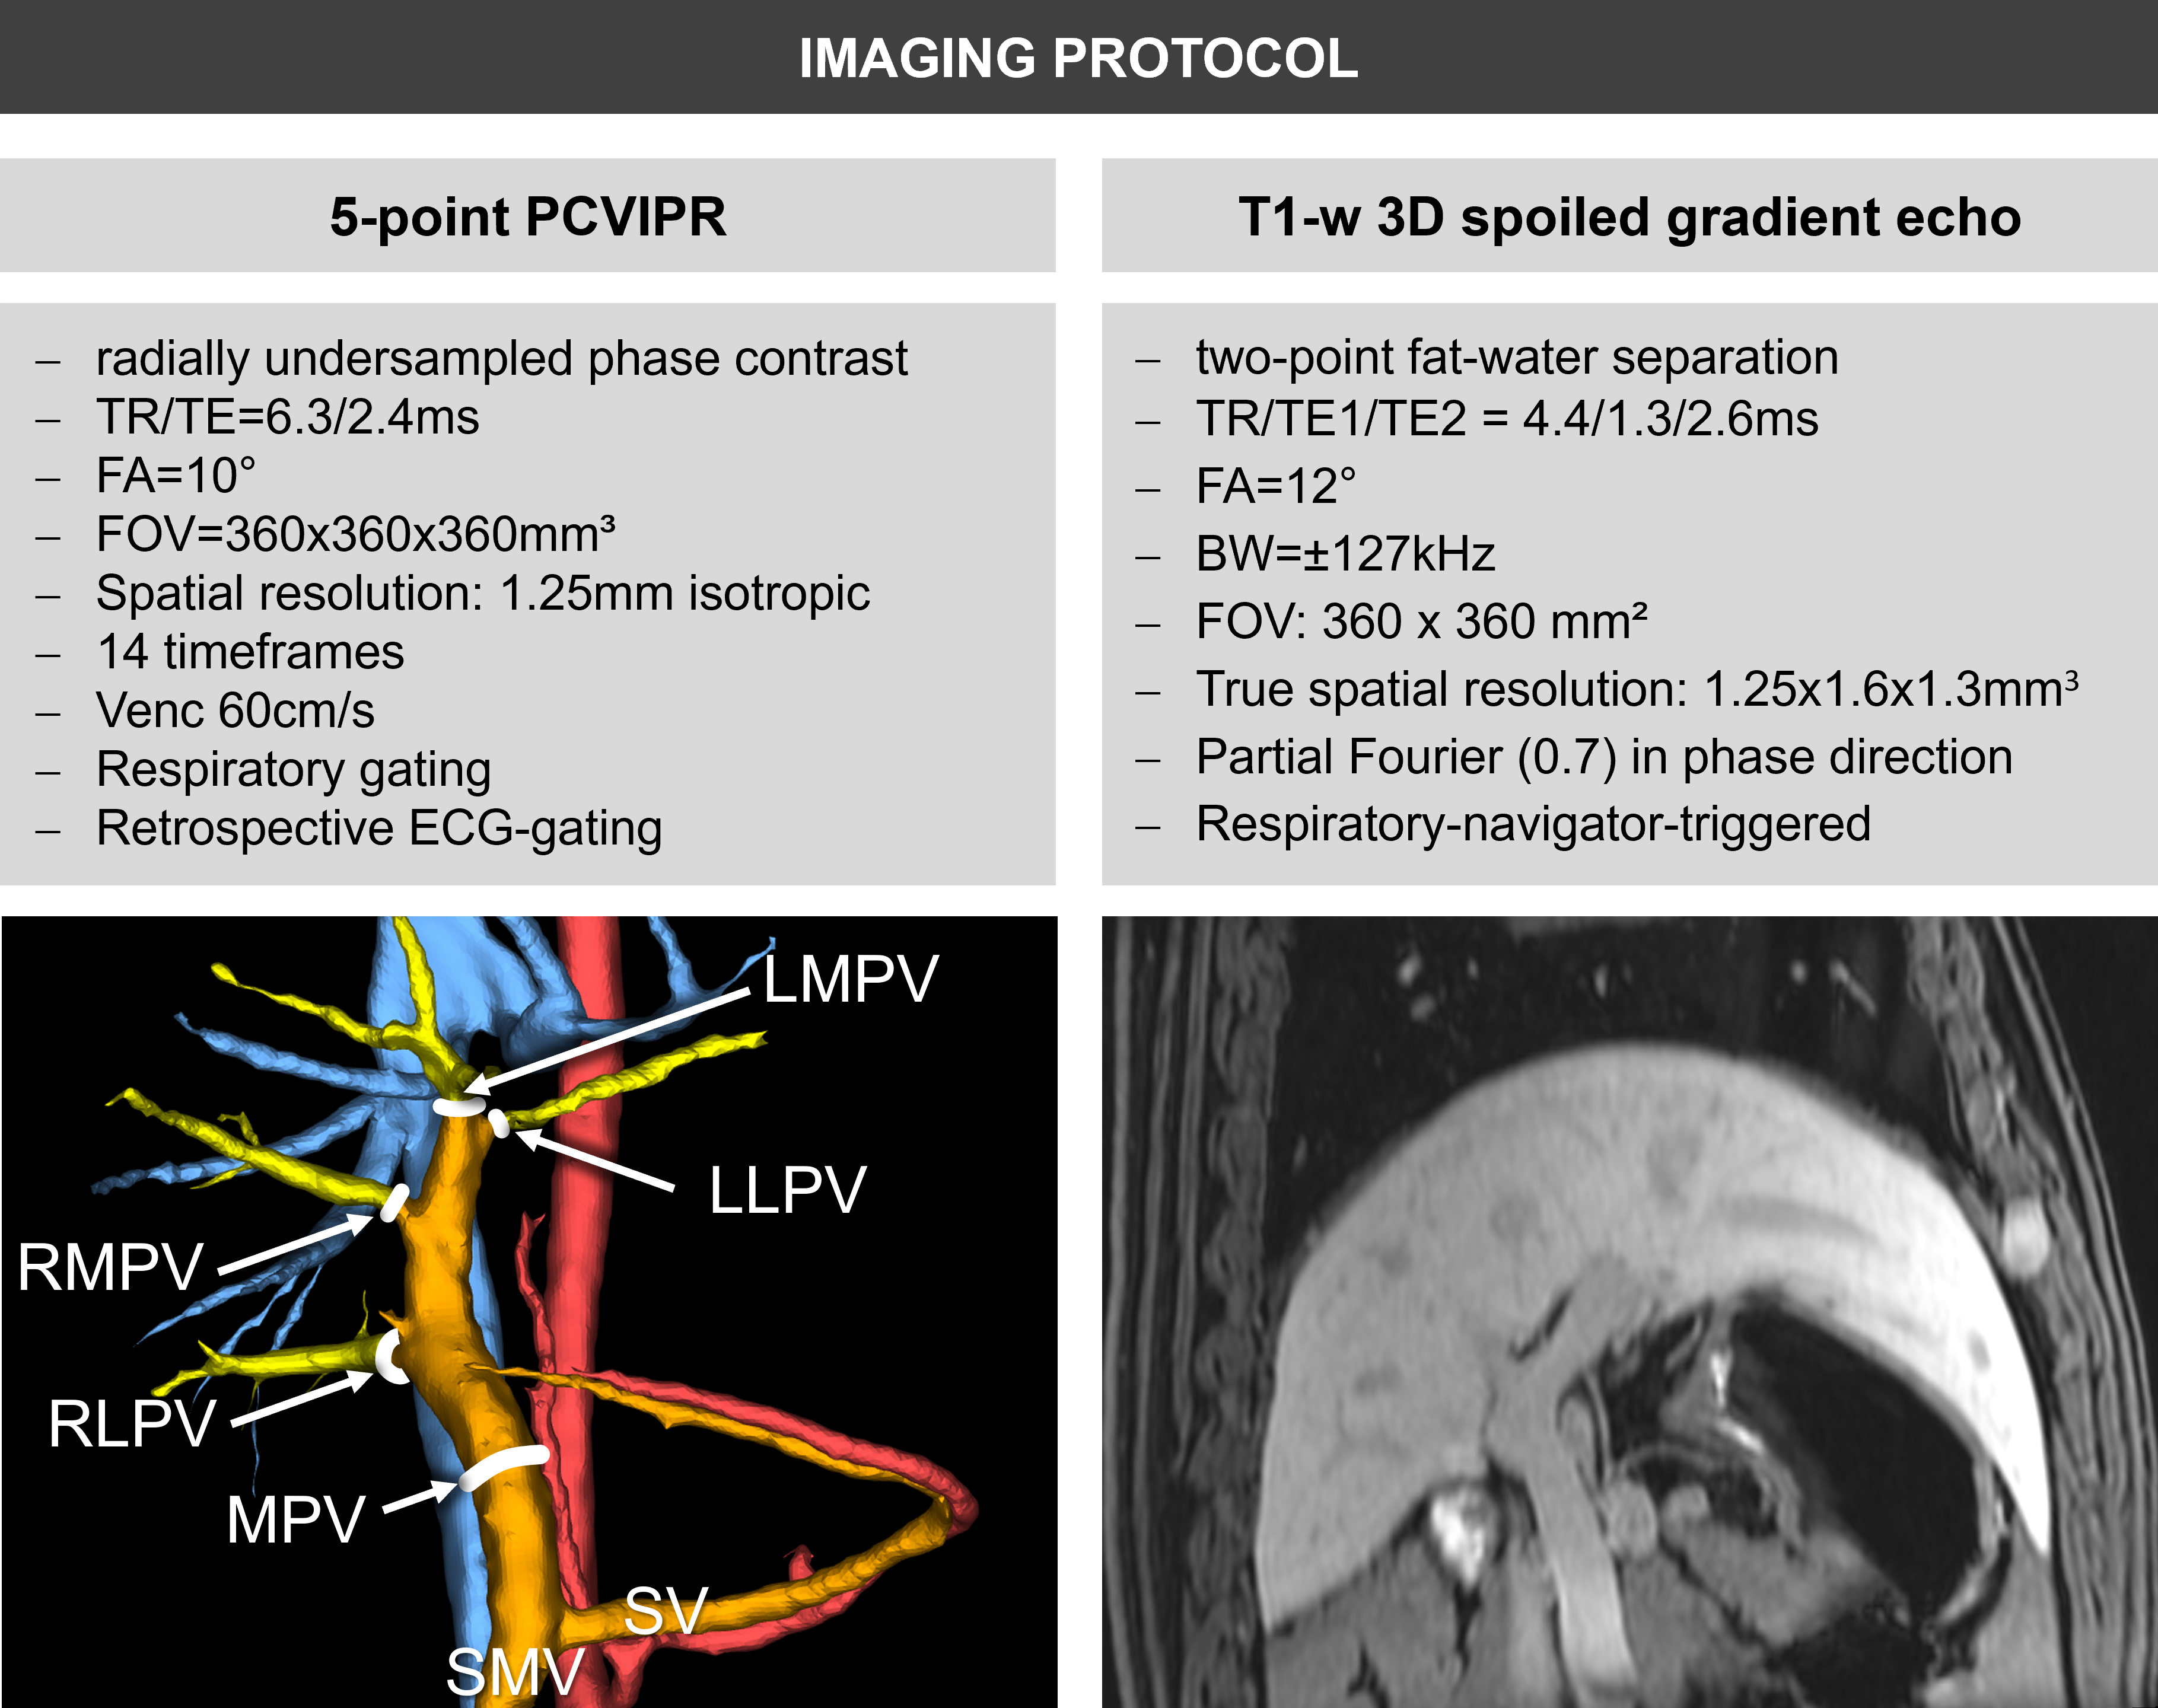
Figure 2: Imaging was performed at a clinical 3T MRI (Discovery750w, GE Healthcare, WI, USA) with a 32-channel phased-array coil and after i.v. contrast (0.05 mmol/kg Gadofosveset trisodium, Ablavar, MA, USA). PCVIPR was acquired to measure main and lobar portal flow (MPV: main portal vein; RLPV: right lateral portal vein; RMPV: right medial portal vein; LMPV: left medial portal vein; LLPV: left lateral portal vein; volume rendering of complex difference angiogram visualizes analysis plane positions). T1-w 3D spoiled gradient echo images were acquired to measure liver lobe volume.
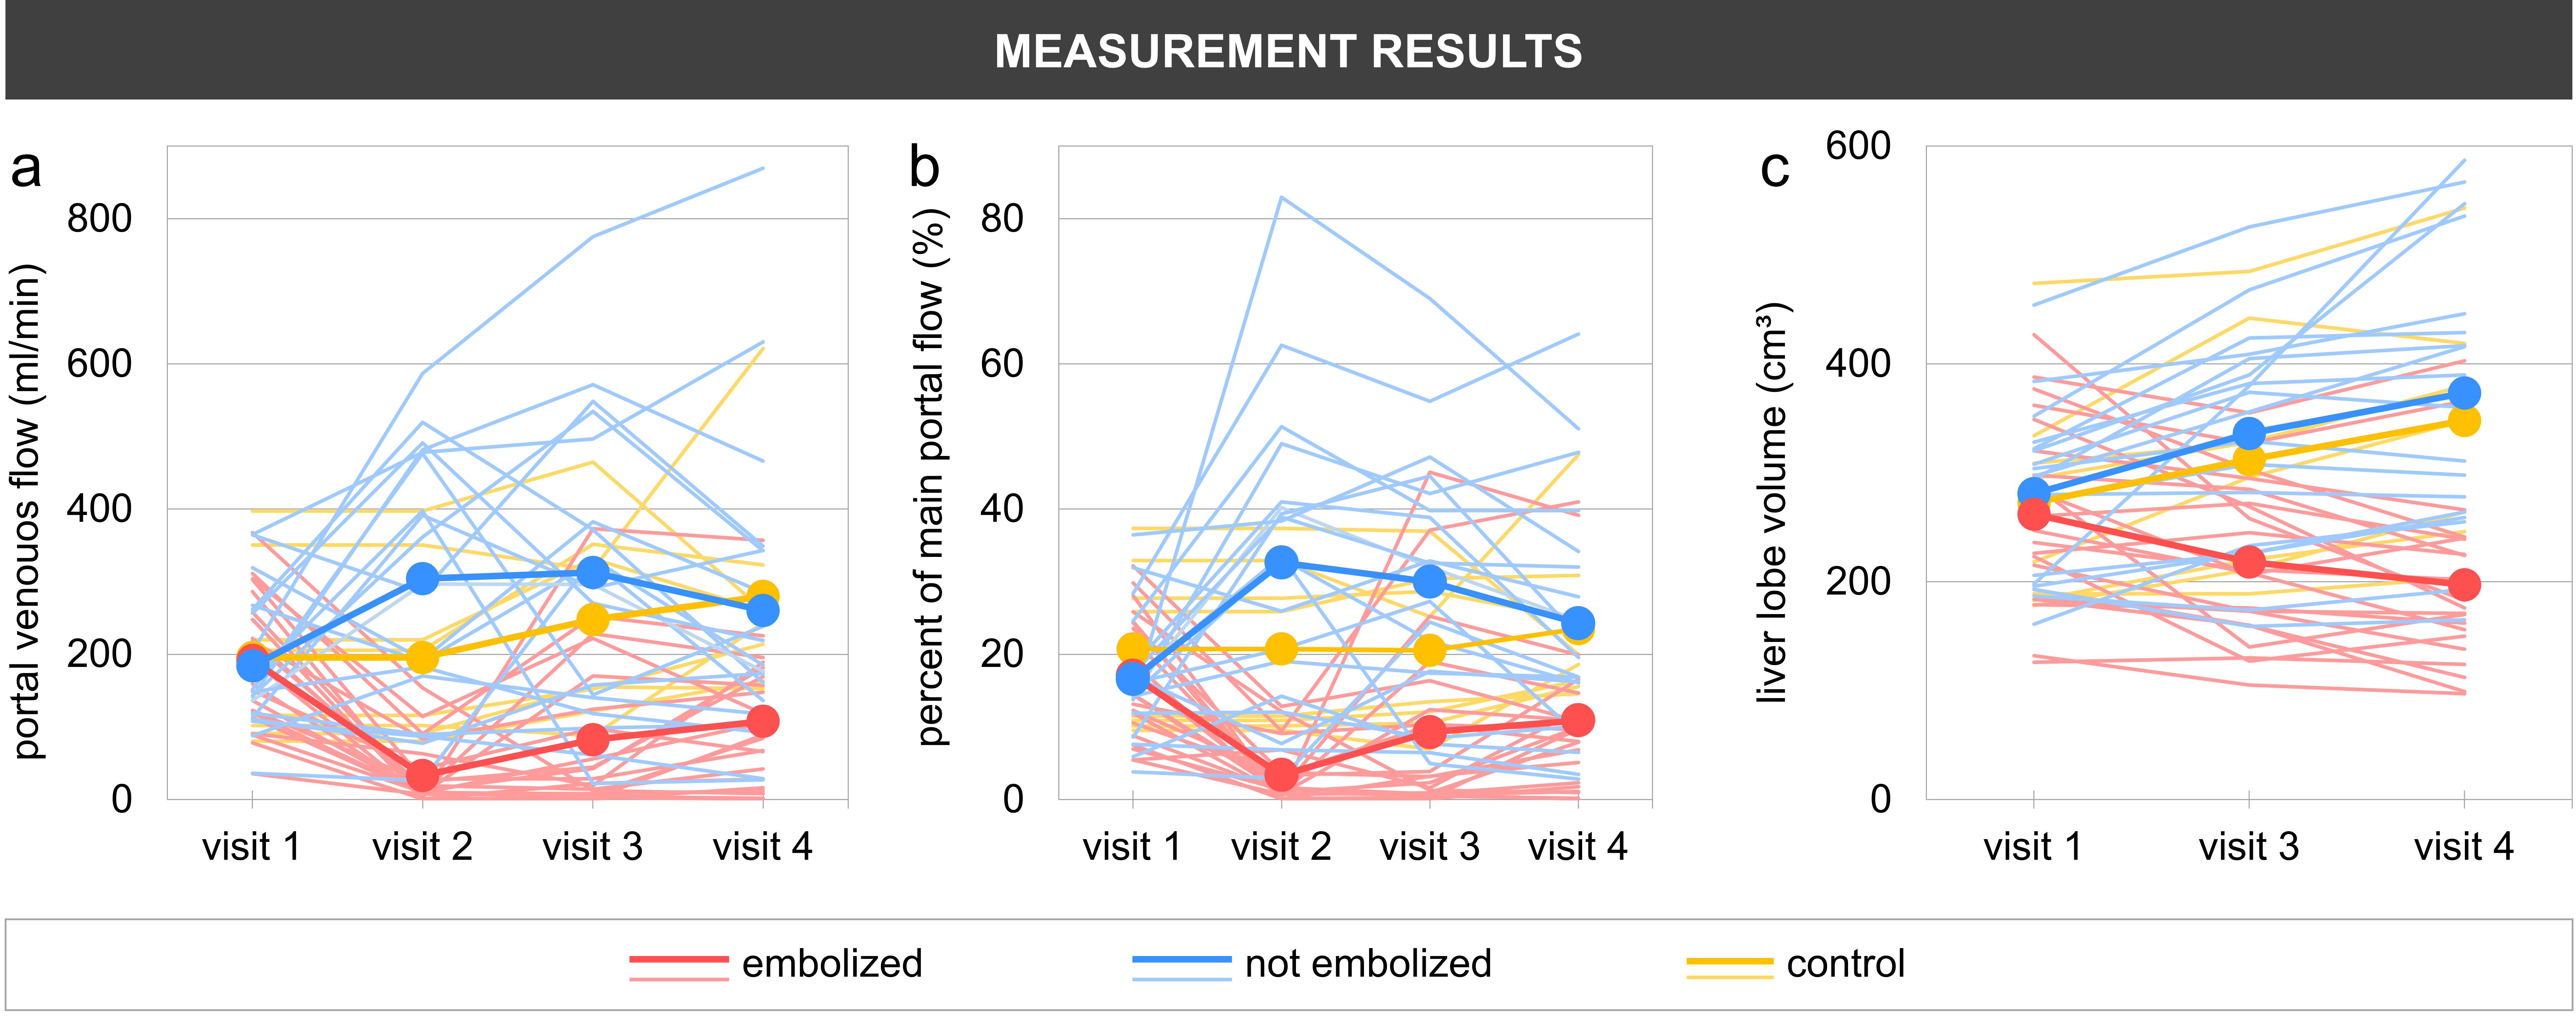
Figure 3: a) Absolute flow and b) percentage of total portal flow to the embolized lobes decreased significantly after portal vein embolization between visits 1 and 2 proving successful intervention. Conversely, absolute and relative flow to the non-embolized lobes increased after the procedure and slowly decreased in the following weeks. Absolute flow in the control animals increased with aging while relative flow in the portal vein branches remained relatively constant. c) Volumes of the embolized lobes decreased while they increased in non-embolized and reference lobes.
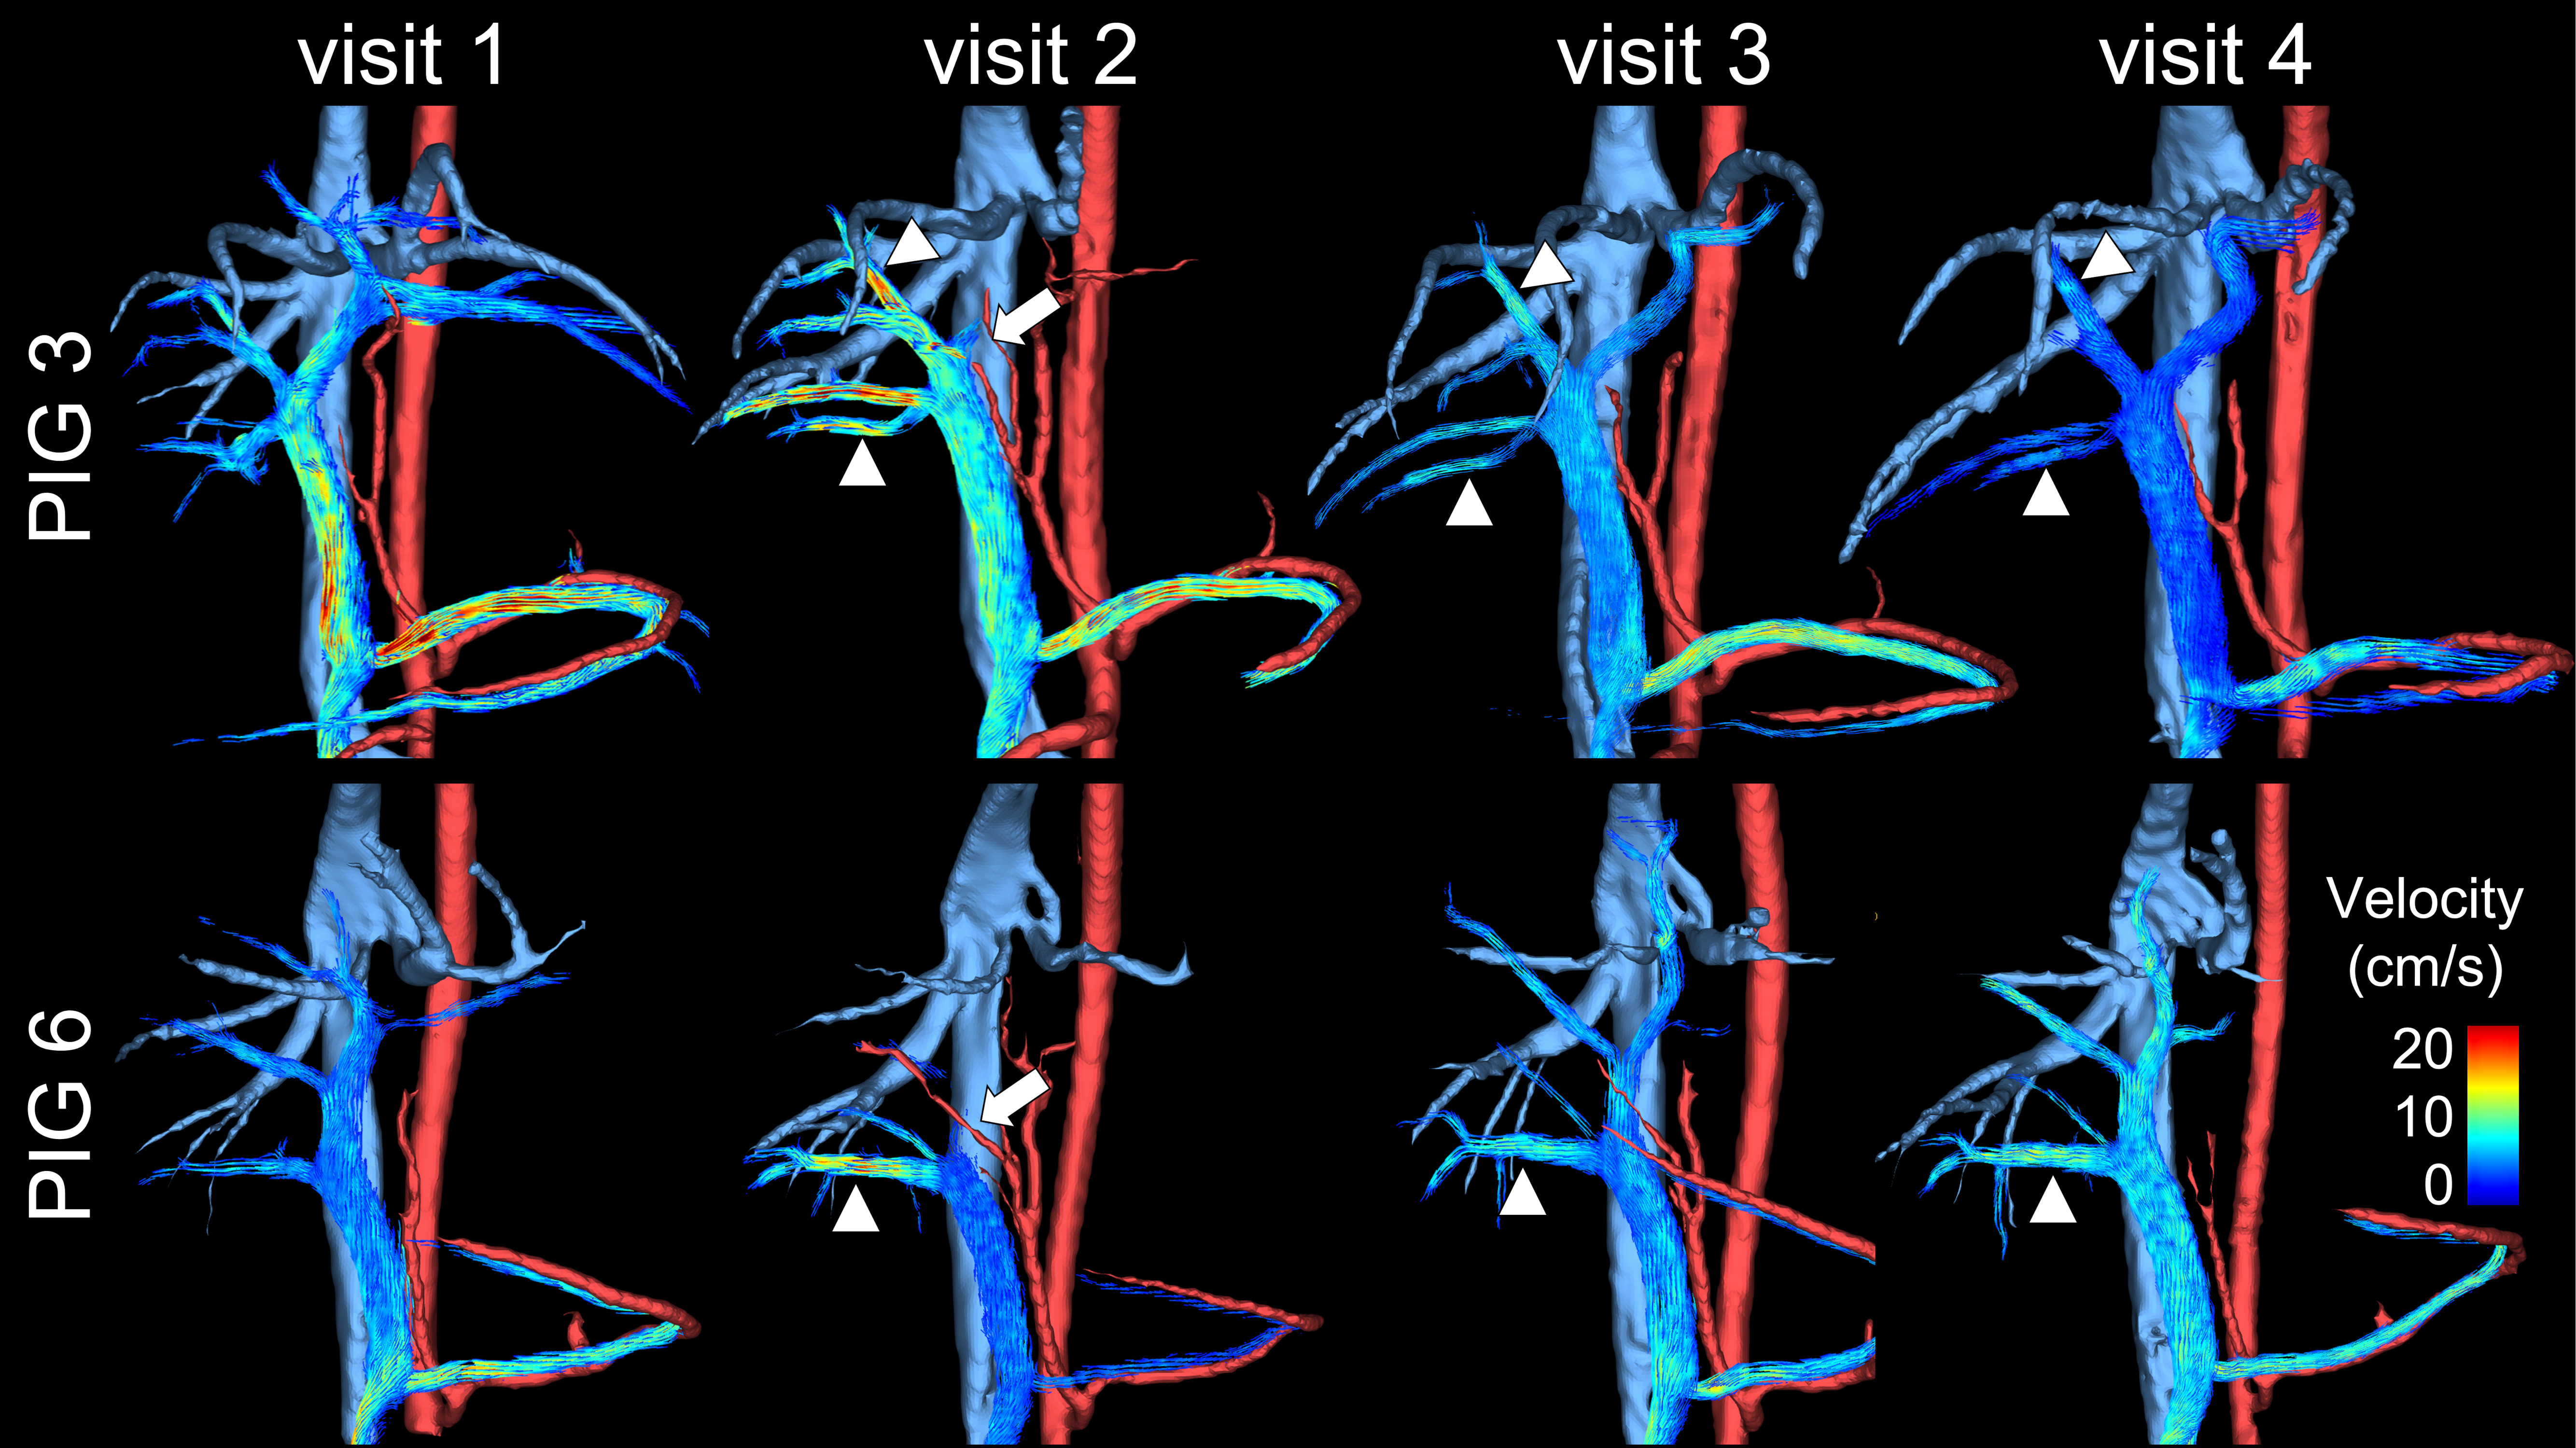
Figure 4: Streamline visualization of portal venous flow in two pigs shows the absent flow of both left portal veins immediately after portal vein embolization (PVE) (arrow, visit 2). There was a compensatory velocity increase in the non-embolized portal veins (arrowheads). Note that there was no flow in the right medial portal vein of pig 6, presumably due to backflow of particles. One week (Visit 3) and two weeks (Visit 4) after embolization, the embolized vessels are again patent. Velocity in the right portal veins remained slightly higher relative to the previously embolized veins.
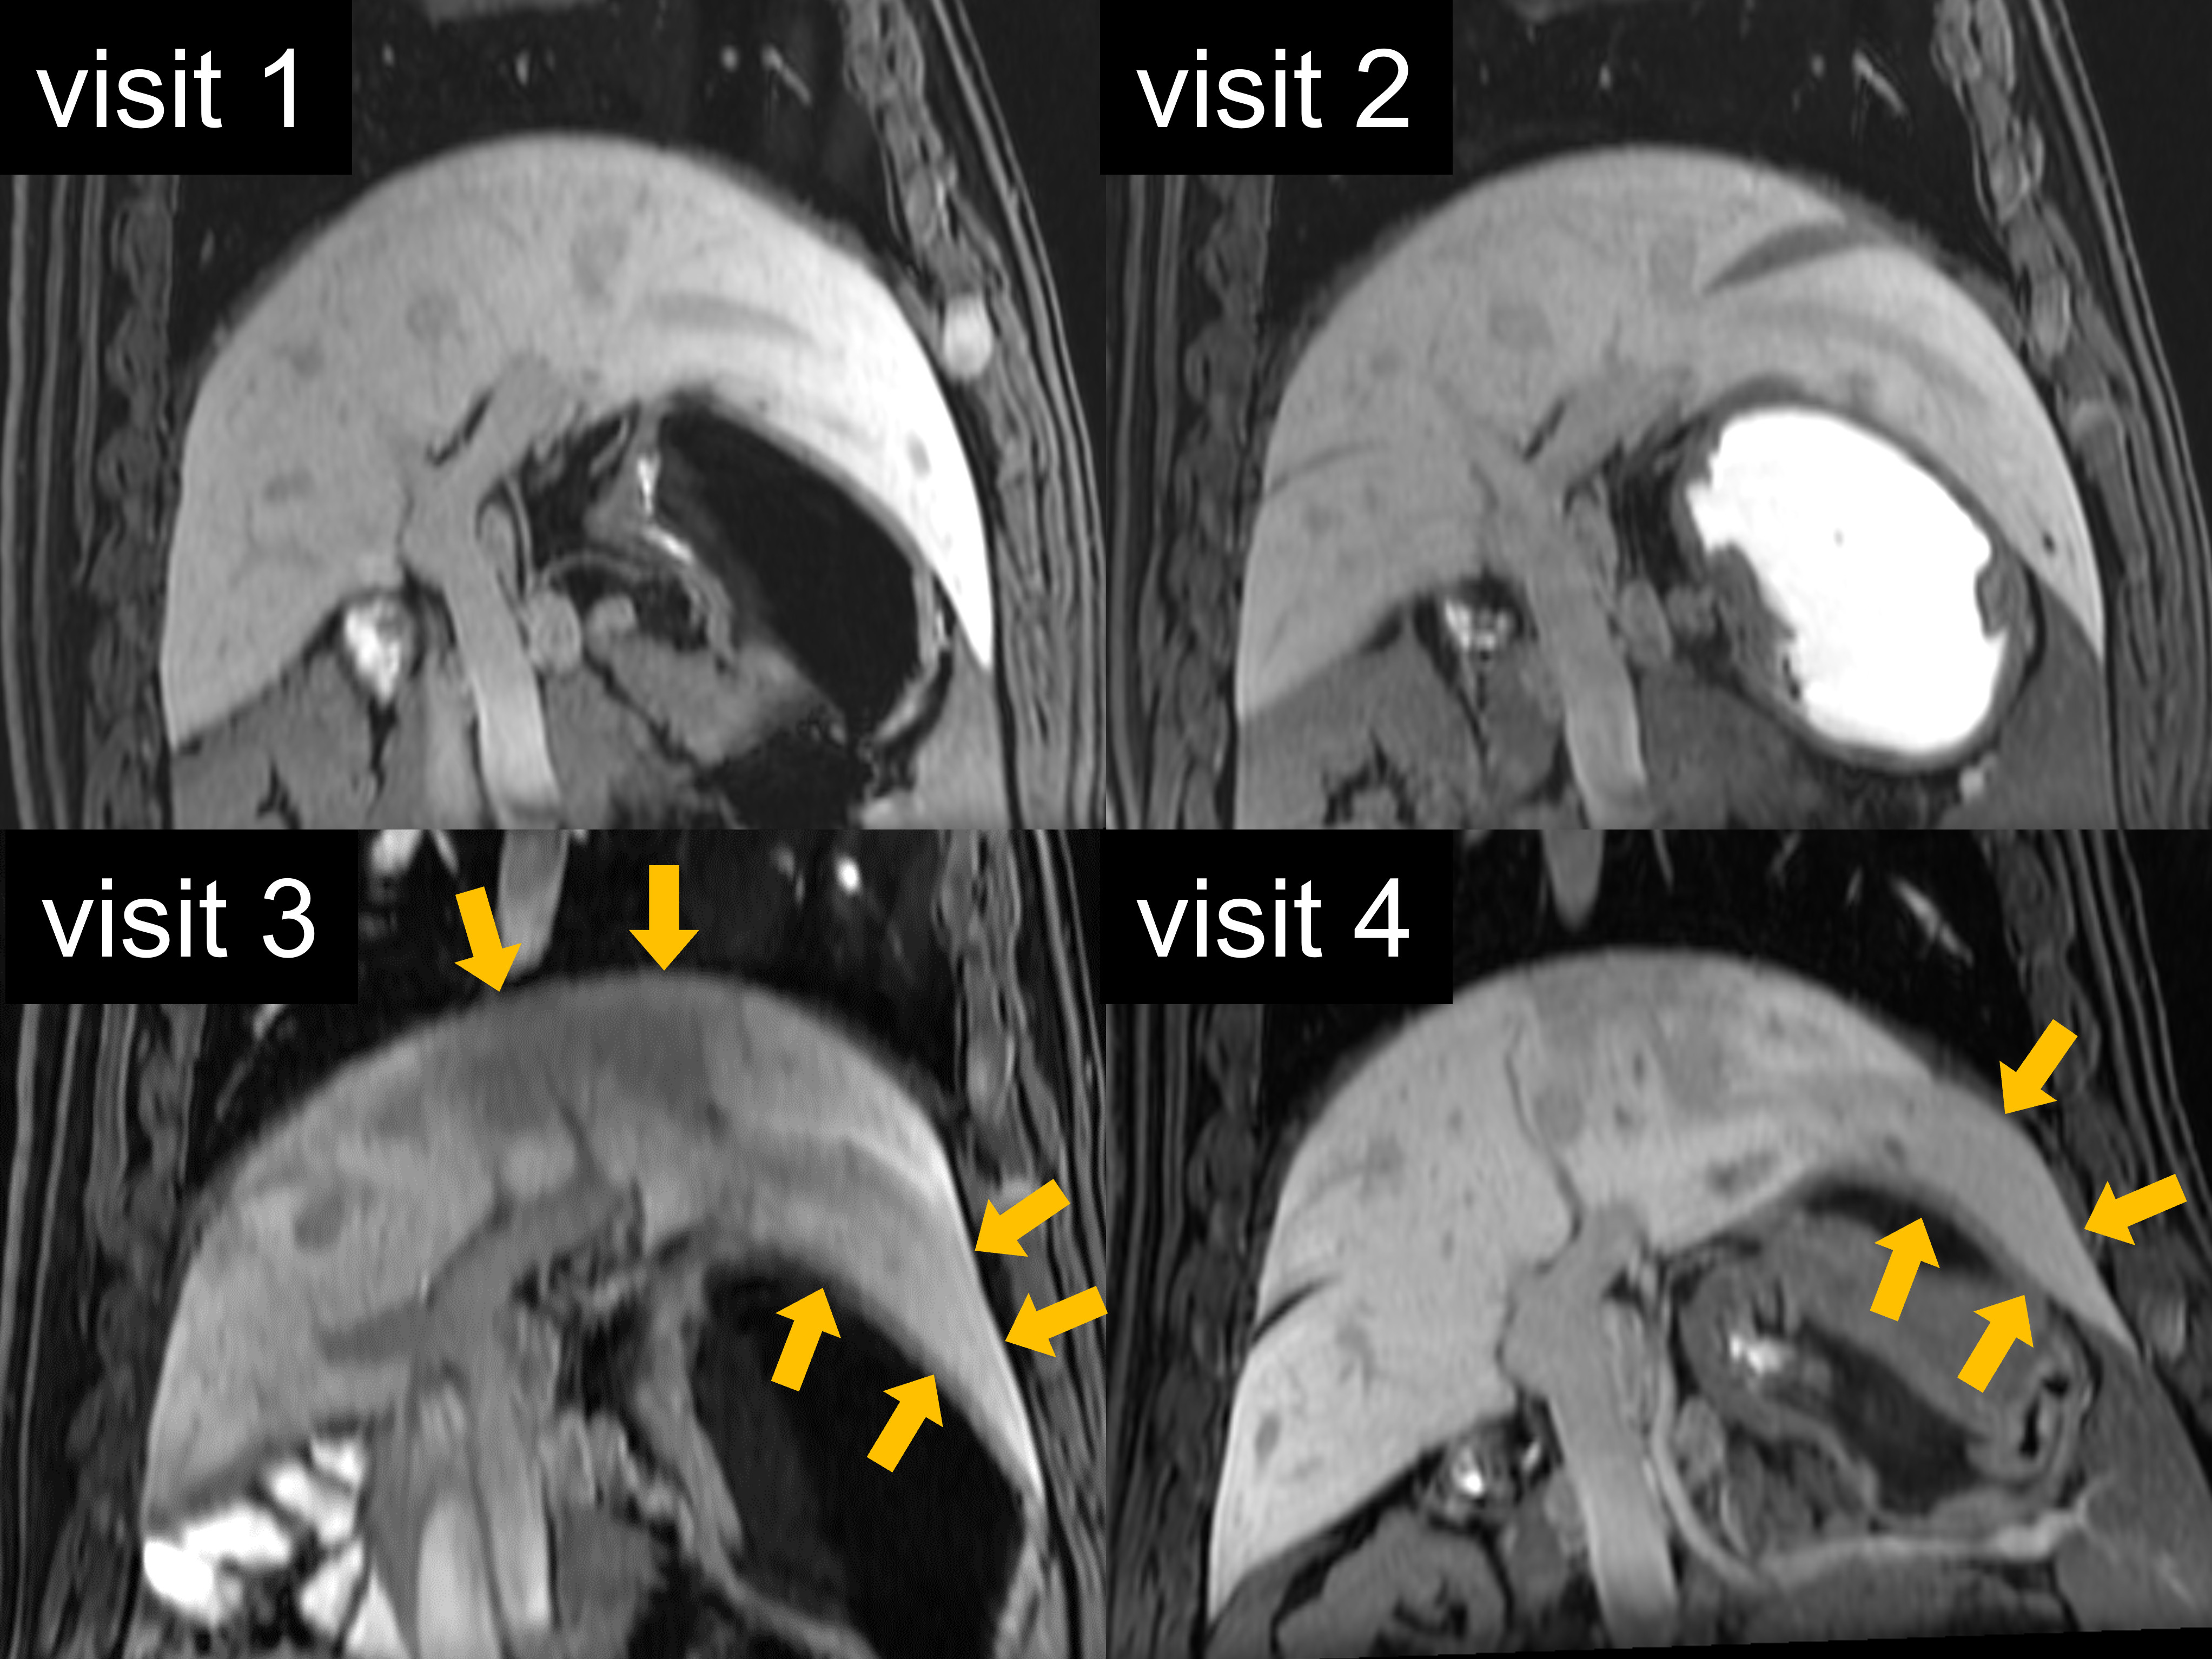
Figure 5: Post-contrast T1-w images demonstrate the treatment effect from the portal vein embolization with reduced contrast enhancement and atrophy of the left liver lobes one and two weeks after embolization (visits 3 and 4, yellow arrows).