0923
High-frequency Conductivity Signal Changes Measured with Functional MREPT during Visual Stimulation
Geon-Ho Jahng1, Jeonin Jeong2, Mun Bae Lee3, Jiyoon Lee2, and Oh In Kwon3
1Radiology, Kyung Hee University Hospital at Gangdong, Seoul, Korea, Republic of, 2Biomedical Engineering, Kyung Hee University, Yongin-si, Korea, Republic of, 3Mathematics, Konkuk University, Seoul, Korea, Republic of
1Radiology, Kyung Hee University Hospital at Gangdong, Seoul, Korea, Republic of, 2Biomedical Engineering, Kyung Hee University, Yongin-si, Korea, Republic of, 3Mathematics, Konkuk University, Seoul, Korea, Republic of
Synopsis
Keywords: Electromagnetic Tissue Properties, fMRI
To investigate the neuronal response of conductivity during visual stimulation and compare that with BOLD, 30 young healthy volunteers were recruited from the local community. We performed two independent experiments of functional magnetic resonance electrical properties tomography (MREPT) MRI. We found that the conductivity value was increased during visual stimulation to some brain areas, indicating that functional MREPT MRI can be used to measure neuronal activity; therefore, conductivity-based fMRI signals may be helpful for measuring neuronal activation during stimulation.Introduction
Because blood oxygen level-dependent (BOLD) functional MRI (fMRI) signals depend on cerebral blood flow (CBF), cerebral blood volume (CBV), and oxygen consumption rate (CMRO2) altered by local electric synaptic activity (1,2), magnetic resonance electrical properties tomography (MREPT)-based fMRI signals may provide additional information about electric activity caused by alteration of ion concentrations and mobilities (3-5). The objective of this study was to investigate the neuronal response of conductivity during visual stimulation and compare that with BOLD.Methods
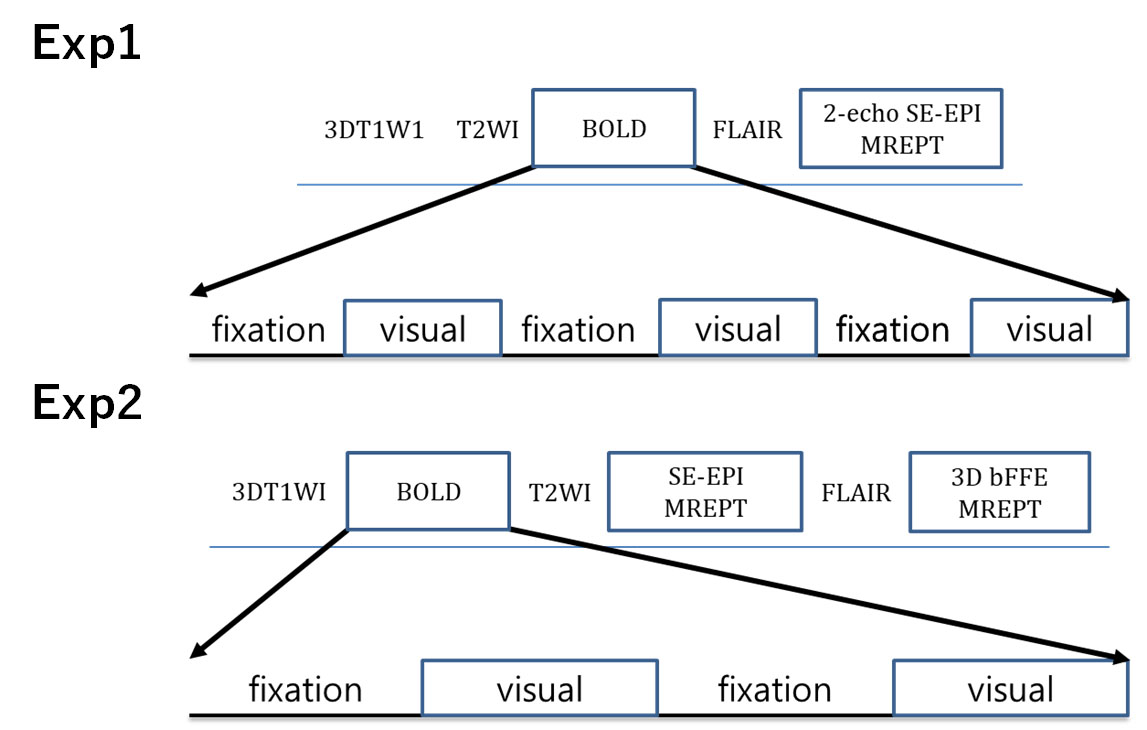
Participants: In total, 30 young healthy volunteers were recruited from the local community. In this study, we performed two independent experiments. The first experiment was performed in 14 young participants. The second experiment was performed on 16 young participants.Functional MRI paradigm: Two sets of independent experiments were performed in this study with different imaging sequences for MREPT data. Figure 1 shows the paradigms for both experiments for the three different sequences of 3D bFFE, BOLD, and SE-EPI. In the first experiment, both the BOLD and two-echo SE-EPI MREPT fMRI sequences were run with three fixation and three stimulation blocks. For MREPT, the multi-echo (me) SE-EPI sequence was used. The me-SE-EPI fMRI was run with 60 s per block, 10 scans per block, and 60 volume scans. The running time was 6 min 0 s. The detailed stimulation paradigms are summarized in Table 1. In the second experiment, we added a single-echo 3D bFFE sequence for MREPT. All three fMRI sequences were run with two fixation and two-stimulation blocks. For MREPT, the single-echo SE-EPI and single-echo 3D bFFE sequences were used. The single-echo SE-EPI fMRI was run with 60 s per block, 30 scans per block, and 120 volume scans. The running time was 4 min 0 s. The 3D bFFE fMRI was run with 90 s per block, 15 scans per block, and 60 volume scans. The running time was 6 min 0 s. Table 1 also summarizes the detailed information.
MRI acquisition: The fMRI study was performed on a 3 T MRI System (Ingenia, Philips Medical System, Best, the Netherlands). First, the GE-EPI sequence was run to obtain BOLD signals for both experiments. Second, the SE-EPI sequence was run to obtain both magnitude and phase to then calculate the high-frequency conductivity for a dynamic scan point. The numbers of echoes were two for the first experiment and one for the second experiment. Third, the sagittal 3D bFFE sequence was run to obtain both magnitude and phase to then calculate the high-frequency conductivity. For image registration, sagittal structural 3D T1-weighted (3D T1W) images were acquired.
Conductivity mapping for both spin-echo and 3D bFFE MREPT scans: A homemade software was used to map the HFC at the Larmor frequency of 128 MHz at 3T (6). The MREPT formula based on a convection reaction equation was derived by adding the regularization coefficient (4). To solve the convection reaction partial differential equation, we used the 2-dimensional finite-difference method. The MREPT formula based on a convection reaction equation can be derived by adding the regularization coefficient c. MREPT depends upon the relatively weak phase signal by a secondary RF magnetic field from the induced electrical current by the time-varying RF field.
fMRI data processing: Because visual stimulation may produce changes in both magnitude through BOLD effect and conductivity through the phase change, we analyzed both magnitude and conductivity data. Statistical parametric mapping version 12 software (SPM12; Wellcome Department of Imaging Neuroscience, University College, London, UK) was used for data preprocessing and voxel-based statistical analysis.
Results
In the voxel-based individual-level analysis, the conductivity values in the multi-echo SE-EPI sequence were slightly increased during visual stimulation. However, the conductivity values in the 3D bFFE sequence fluctuated inconsistently. The mean conductivity values over all subjects were significantly different between the fixation and visual stimulations at the primary visual cortex, secondary visual cortex, and cuneus for both experiments.Conclusion
Conductivity-based fMRI would not be based on measuring changes in BOLD effect, but rather on the direct detection of neural activity, which is expected to have the potential for imaging electrical activity in the brain and would potentially be useful in several neurophysiological studies. Because the BOLD signal does not correlate perfectly with action potentials, the conductivity-based fMRI signal may be helpful for measuring the action potential or membrane potential in the future. Although the conductivity-based fMRI signal was not stronger than BOLD, the conductivity value was increased during the visual stimulation at some brain areas, thus indicating that functional MREPT can be used to measure neuronal activity. It is unclear whether the slight changes of conductivity in the brain during the functional activity were due to true physiological mechanisms. Therefore, further studies are recommended with further optimization of signal acquisitions of an MREPT technique.Acknowledgements
The research was supported by the National Research Foundation of Korea (NRF) grants funded by the Ministry of Science and ICT (2020R1A2C1004749, G.H.J.; 2019R1A2C1004660, O.I.K.; 2020R1F1A1A01074353, M.B.L.), Republic of Korea.References
1.Kwong KK, et al. Proc Natl Acad Sci U S A 1992;89(12):5675-5679. 2.Ogawa S, et al. Proc Natl Acad Sci U S A 1992;89(13):5951-5955. 3.Gurler N and Ider YZ. Magn Reson Med 2017;77(1):137-150. 4. Katscher U, et al. IEEE Trans Med Imaging 2009;28(9):1365-1374. 5.Leijsen R, et al. Diagnostics (Basel) 2021;11(2). 6. Gabriel C, et al. Phys Med Biol 2009;54(16):4863-4878.Figures
Figure
1. Paradigms for the
functional MRI experiments of BOLD and MREPT with SE-EPI and/or 3D bFFE.
In the
first experiment (Exp1), both BOLD and two-echo SE-EPT sequences were run with
three fixation and three stimulation blocks. In the second experiment (Exp2), BOLD, SE-EPI, and 3D bFFE sequences were run with two fixation and two-stimulation blocks. The detailed stimulation paradigms are
summarized in Table 1.
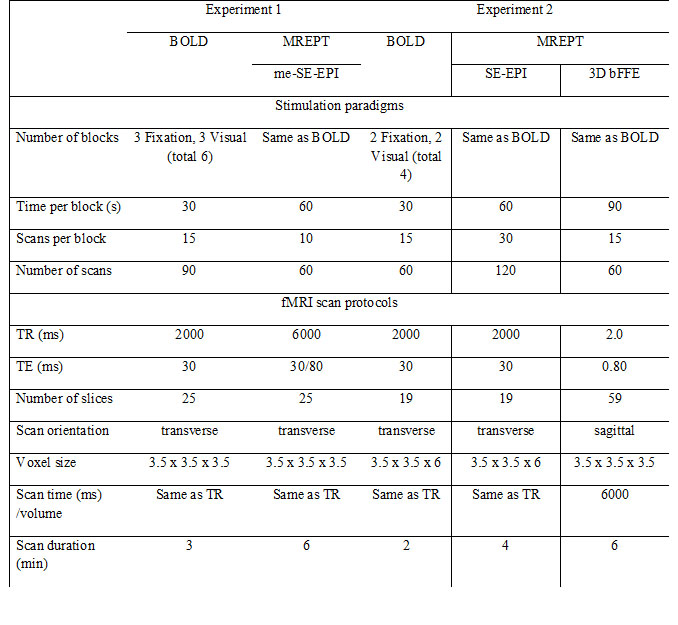
Table 1. Summary of the stimulation paradigms and the functional MRI scan protocols.
Abbreviations: functional magnetic resonance imaging (fMRI); blood oxygen level dependent (BOLD); Magnetic resonance electrical properties tomography (MREPT); multi-echo (me) spin-echo (SE) echo-planar-imaging (EPI); three-dimensional (3D) balanced fast-field-echo (bFFE);
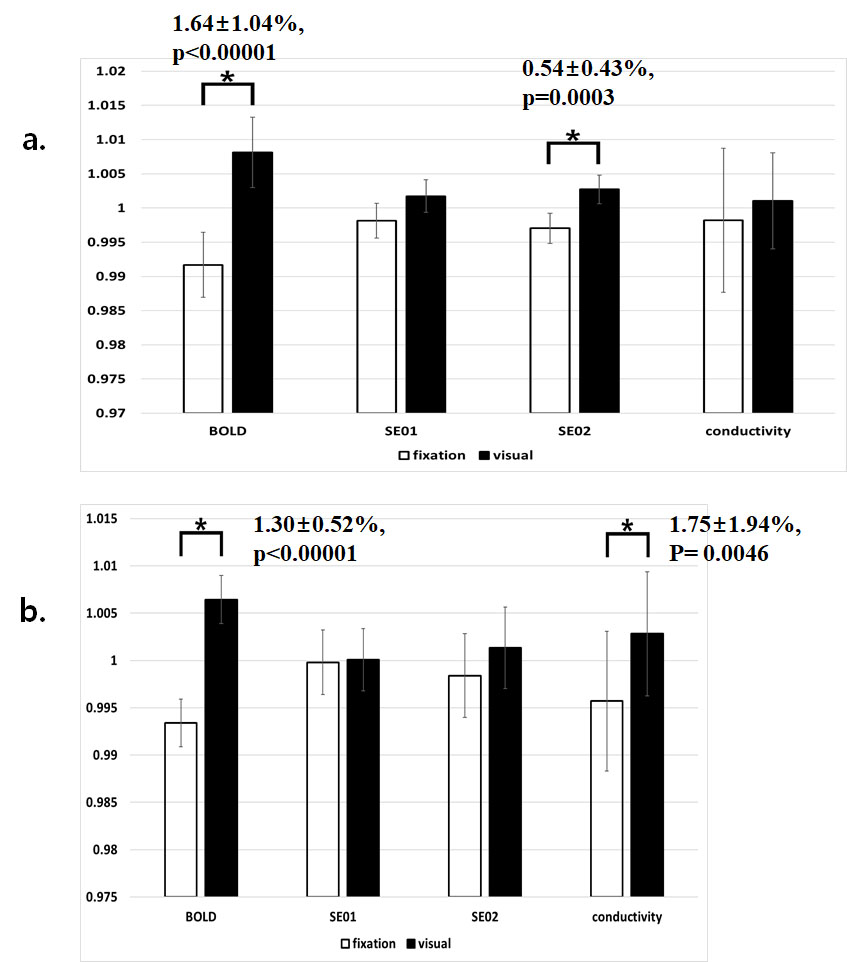
Figure 2. Average
signals or high-frequency conductivity values were obtained in cerebrospinal fluid
(CSF) at the primary visual cortex (PVC, a) or the secondary visual cortex
(SVC, b). SE01, SE02, and conductivity values were obtained from the two-echo
spin-echo (SE)-MREPT images.
DOI: https://doi.org/10.58530/2023/0923