0922
Investigation of electrical conductivity changes during functional activity of the brain via phase-based MR-EPT: Preliminary observation1Department of Electrical and Electronic Engineering, Yonsei University, Seoul, Korea, Republic of, 2Department of Radiology, Asan Medical Center, University of Ulsan College of Medicine, Seoul, Korea, Republic of, 3Department of Biomedical Engineering, Yonsei University, Wonju, Korea, Republic of
Synopsis
Keywords: Electromagnetic Tissue Properties, Electromagnetic Tissue Properties
BOLD-fMRI is measured from time-series of magnitude information, whereas the phase contrast information, which is related to the electrical properties, is excluded from process. In this study, we focus on the phase information and attempt to expose the relationship between BOLD signal and conductivity activation. In addition, we investigate the potential of functional EPT relative to standard BOLD fMRI.Introduction
Functional magnetic resonance imaging (fMRI) can visualize brain activation region via blood oxygenation level-dependent (BOLD) effect, which accompanies hemodynamic responses for adjusting the blood flow to stressed tissues1,2. While blood oxygen saturation has been demonstrated to affect changes in conductivity values3-5, the lack of investigation about relationship between brain activation and electrical properties6,7. Electrical conductivity can be estimated by phase-based electric properties tomography (EPT) techniques from transceive phase information with spin-echo or balanced steady-state free precession (bSSFP) sequences8. Thus, since bSSFP sequence allows to not only estimate BOLD effects from magnitude information9 but reconstruct the conductivity map from phase information, it can be advantageous for providing both observations.In this study, the experiment comprised block paradigms of rest and finger-tapping task states for both echo-planar imaging (EPI) and bSSFP sequences. Magnitude information from EPI and bSSFP was analyzed with a general linear model (GLM) for BOLD effect observation, and phase information from bSSFP was reconstructed to conductivity maps to demystify the relationship between BOLD effect and electrical conductivity. Based on the experimental setting, we observed phase and conductivity changes between activation and resting states.
Methods
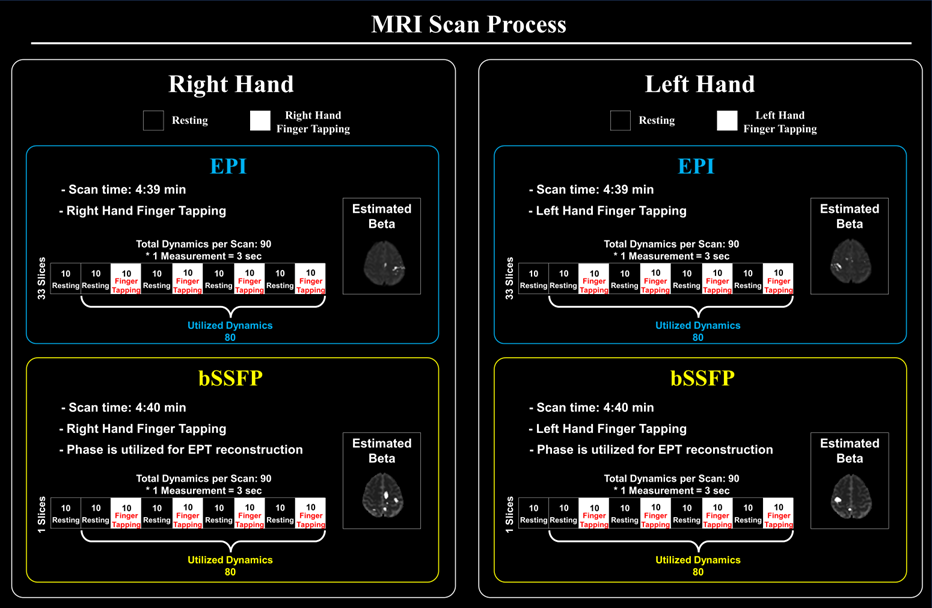
Three healthy volunteers were scanned on a 3T MRI system (MAGNETOM Vida, Siemens Healthineers) using 64ch-head coil. This study performed following tasks for each sequence to investigate the relationship between brain and conductivity activations; right and left finger-tapping. For each volunteer, 2D EPI and bSFFP sequences were used with following scan parameters; EPI: TR/TE=3000/30ms, flip-angle=90˚, resolution=1.9mmx1.9mm, slice thickness=5mm , the number of slice=33, acceleration factor=2, NSA=1; bSSFP: TR/TE=4/2ms, flip-angle=30˚, resolution=1.9mmx1.9mm , slice thickness=5mm, the number of slice=1, NSA=12. Each scan consists of 9 blocks with 8 alternating periods of resting (4 blocks) and tasking (4 blocks) states. Details of experiment procedure are shown in Fig. 1. For the magnitude information of both sequences, beta maps via GLM were estimated to observe BOLD characteristics (p<0.05), and additionally, phase information of bSSFP was used to reconstruct conductivity maps. In this study, to exclude of conductivity reconstruction errors caused by noise or boundary artifact (especially, overshooting for negative values), phase-based cr-EPT method10 was used to reconstruct conductivity maps:$$-c\triangledown^{2}\rho + (\triangledown \phi^{tr}\cdot\triangledown\rho) + \triangledown^{2}\phi^{tr}\rho - 2\omega \mu_{0}=0$$
where ρ=1/σ(resistivity), σ=conductivity, $$$\phi^{tr}$$$=transceive phase, ω=Larmor frequency, and $$$\mu_{0}$$$=vacuum permeability, $$$-c\triangledown^{2}\rho$$$=diffusion terms.
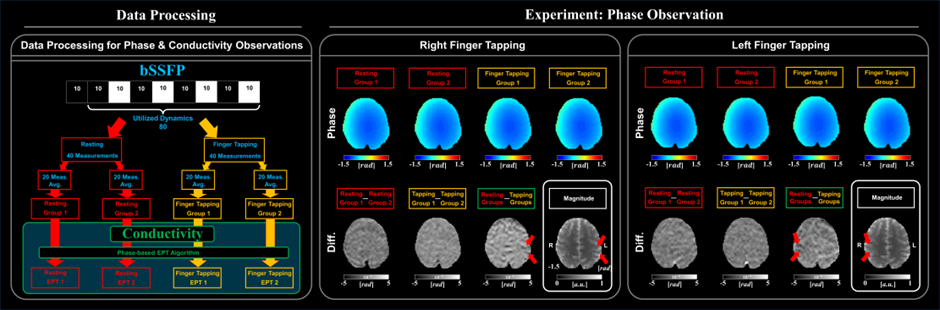
Firstly, phase information of bSSFP was divided into four groups: two resting and two tasking state groups (20 dynamics for each group). For each state, difference maps were computed and observed.
After then, whether characteristics observed in phase information are coincided with reconstructed conductivity maps was observed in the same pipeline and compared with beta maps of bSSFP magnitude information.
Secondly, based on intersection area among the beta maps and conductivity difference map, magnitude and reconstructed conductivity time-series were observed with Gaussian filtering and investigated to trends between BOLD signal and change of conductivity value.
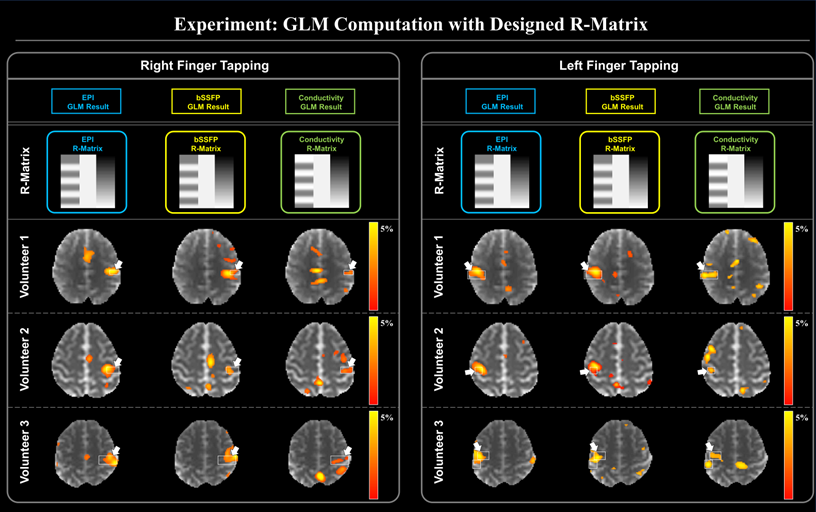
Lastly, based on our observation, we design the R-matrix for conductivity activations in the time of hemodynamic response, and compared with the beta maps of EPI and bSSFP magnitude information.
Results
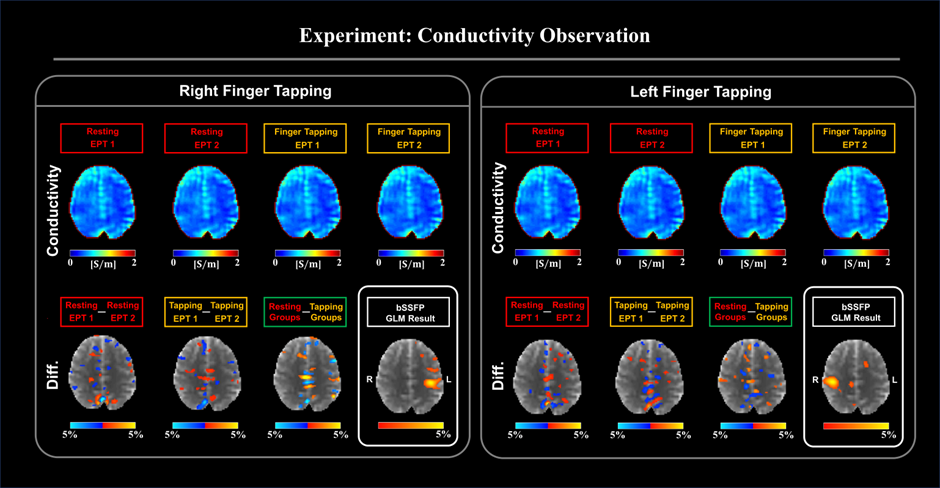
In Fig. 2, for each state, phase difference maps reveal that rapid phase change (red arrows), which indicate the change of conductivity during the resting and finger-tapping tasks.In Fig. 3, the conductivity maps were reconstructed from phase information for each state. The conductivity difference map was computed by given significance threshold (p<0.05). Conductivity changes were also observed near the phase change regions.
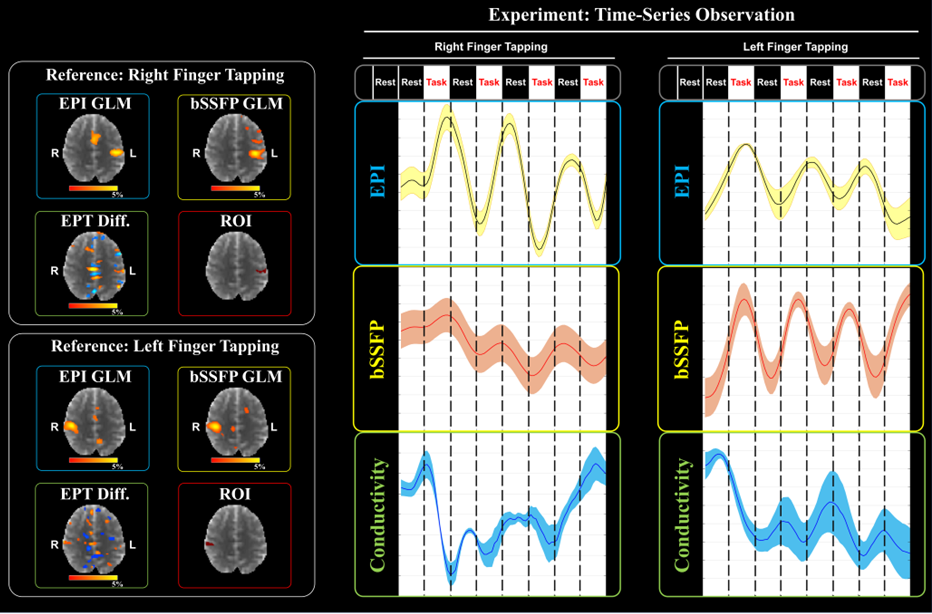
In Fig. 4, the time-series of each magnitude images for both EPI and bSSFP and conductivity maps for 80 dynamics were plotted from the intersection regions. Conductivity activations were observed close to opposite trends to the BOLD signals from EPI and bSSFP.
Based on the observation from Fig.4, the R-matrix was designed that conductivity activation opposite to BOLD signals, then convolved with hemodynamic response function in order to take account of conductivity activation in the timing of the hemodynamic response. Fig. 5 shows the results that there is an activation intersection region between GLM results for the functional response of EPT and the BOLD fMRI (white arrows and boxes). This indicates that the conductivity values have a potential functional activation relative to standard BOLD fMRI.
Discussion & Conclusion
We investigated phase and conductivity changes during resting and activation states. It is expected that changes in electrical conductivity upon brain activation may be affected by ion-concentration and blood-oxygenation. While, in general, ion concentration and mobility are known to effect on the measured conductivity8, blood-oxygenation has reported to decrease conductivity values3-5. Brain activation may be expected at odds with these two interactions for conductivity activations, so this study may provide heuristic insight of which one is more dominant factor on conductivity changes. In the phase observation experiment, the phase contrast has similar tendency as in the previous report7. In addition, in our observations, conductivity activation was further investigated and observed that the conductivity response tends to decrease during brain activations for both finger-tapping tasks. Although the observations suggest the potential of functional EPT, since this study is a preliminary observation, it should be further investigated for 2nd level analysis.Acknowledgements
This research was supported by the MSIT(Ministry of Science and ICT), Korea, under the ITRC(Information Technology Research Center) support program(IITP-2020-2020-0-01461) supervised by the IITP(Institute for Information & communications Technology Planning & Evaluation).References
[1] Ogawa S, Tank DW, Menon R, Ellermann JM, Merkle H, Ugurbil K. Intrinsic signal changes accompanying sensory stimulation: functional brain mapping with magnetic resonance imaging. In proceedings of the National Academy of Sciences. 1992; 89(13): 5951-5955.
[2] Chow MSM, Wu SL, Webb SE, Gluskin K, Yew DT. Functional magnetic resonance imaging and the brain: A bried review. World J. Radiol. 2017; 28: 5-9.
[3] Hirsch FG, Texter EC, Wood LA, Ballard WC, Horan FE, Wright IS. The electrical conductivity of blood: 1. Relationship to erythrocyte concentration. Blood. 1950; 5(11): 1017-1035.
[4] Gho SM, Shin J, Kim MO, Kim DH. Simultaneous quantitative mapping of conductivity and susceptibility using a double-echo ultrashort echo time sequence: Example using a hematoma evolution study. Magnetic Resonance in Medicine. 2016; 76(1): 214-221.
[5] Altaf IM & Ahmad A. Dielectric properties of human blood of patients Suffering from iron deficiency anemia. International Journal of Science, Environment and Technology. 2017; 6(1): 916-922.
[6] Helle M & Katscher U. Electrical Properties Tomography based Functional Magnetic Resonance Imaging (EPT-fMRI). In proceedings of ISMRM 27th Annual Meeting & Exhibition, 11-16 May 2019.
[7] Schmidt R. Electrical conductivity as a potential mean to decouple the hemodynamic reponse from fMRI. In proceedings of ISMRM 27th Annual Meeting & Exhibition, 11-16 May 2019.
[8] Katscher U & van den Berg CAT. Electric properties tomography: Biochemical, physical and technical background, evaluation and clinical applications. NMR Biomed. 2017; 30: 3729.
[9] Miller KL. FMRI using balanced steady-state free precession (SSFP). Neuroimage. 2012; 62(2): 713-719.
[10] Gurler N & Ider YZ. Gradient-based electrical conductivity imaging using MR phase. Magnetic Resonance in Medicine. 2017; 77(1): 137-150.
Figures