0918
Correlation of zero echo time MB-SWIFT fMRI with neuronal activity during sensory stimulation in anesthetized and awake rats1A. I. Virtanen Institute for Molecular Sciences, University of Eastern Finland, Kuopio, Finland, 2Center for Magnetic Resonance Research, University of Minnesota, Minneapolis, MN, United States
Synopsis
Keywords: fMRI, Brain, Zero echo time
Zero echo time (ZTE) fMRI with MB-SWIFT poses an artefact free alternative to traditional EPI-based BOLD fMRI approaches. However, the exact origin of the fMRI signal captured with ZTE is unknown. In this work, we investigated the correlation between electrical brain activity and the ZTE fMRI signal during sensory stimulation in anesthetized and awake rats. It is shown that a linear model explains the relationship between the fMRI signal and electrical activity in anesthetized but not in awake rats. We conclude that MB-SWIFT fMRI provides a good proxy for neuronal activity under conventional experimental conditions.
Introduction
Echo planar imaging (EPI) has been the gold standard for functional MRI (fMRI) for three decades. EPI-based fMRI approaches, however, have shortcomings, such as high acoustic noise and sensitivity to susceptibility artefacts and subject motion. To overcome these limitations, zero echo time fMRI modalities have been introduced, including the novel method Multi-Band Sweep Imaging with Fourier Transformation (MB-SWIFT)1,2. MB-SWIFT has high excitation and acquisition bandwidths, practically zero echo time, it is quiet, insensitive to image distortions and motion artefacts, and produces a functional contrast comparable to EPI. Accordingly, this approach enables study designs which are extremely challenging with EPI, such as deep brain stimulation fMRI1, spinal cord fMRI3, and behavioral studies in head-fixed rats4.However, fundamental questions need to be addressed regarding the use of MB-SWIFT for functional imaging. At zero echo time, BOLD contrast disappears, so other functional contrast mechanisms need to be considered. Therefore, although the relationship between the BOLD fMRI signal and electrical brain activity has been studied extensively5, the findings of these studies can not necessarily be extrapolated to MB-SWIFT fMRI. The aim of this work was to study the correlation of electrical brain activity with the MB-SWIFT fMRI signal. For this purpose, we conducted simultaneous electrocorticography (ECoG)-fMRI studies in anesthetized and awake rats during electrical or mechanical whisker stimulation at a wide range of stimulation frequencies.
Methods
Animal procedures were approved by the Animal Experiment Board in Finland. Under isoflurane anesthesia, 7 male and 4 female Sprague-Dawley rats (n=11) underwent surgery for the placement of a head-fixation implant2,4, four intracranial tungsten wire electrodes, and 4–5 skull screws over the cerebellum and olfactory bulb to serve as reference/ground electrodes and anchors for the implant (Fig. 1A, 1B). After 1–3 weeks of recovery time, the rats were habituated to awake fMRI4,6.fMRI was performed as previously described4. fMRI data were acquired at 9.4T Agilent MRI system with transceiver surface RF coil using 3D MB-SWIFT (2047 spokes, TR 0.97 ms, temporal resolution 2 s, 192/384 kHz excitation/acquisition bandwidths, 5-6° flip angle, and 643 matrix size with 625 µm isotropic resolution). Simultaneous electrical recordings were performed with an MRI-compatible BrainAmp system. Data were processed and analyzed as described earlier2,4. Each rat underwent 2–5 sessions of imaging in either the awake state or under isoflurane (0.5%) + medetomidine (0.03 mg/kg/h, sc) anesthesia.
The stimulation paradigm consisted of 16-s blocks of unilateral whisker stimulation at frequencies of 1, 3, 5, 7, 9, 13, and 17 Hz. Four blocks were delivered per frequency, with all blocks randomized by order and interposed with 44-s breaks. In separate experiments, both mechanical and electrical stimulation was used. Mechanical whisker stimulation was performed with puffs of air directed at a piece of adhesive tape on the whiskers (Fig. 1B). Electrical stimuli were delivered via two subcutaneous needles placed in the whisker pad between rows A–B and C–D (Fig. 1B, 1C). In awake rats, only mechanical whisker stimulation was used, and frequencies 3 and 7 were left out to shorten the imaging time. This resulted in three separate experimental conditions: electrical whisker pad stimulation in anesthetized rats (ISO+MED, electrical), and air puff-mediated whisker stimulation in anesthetized (ISO+MED, air puff) and awake rats (Awake, air puff).
Results
In anesthetized rats, the sum of somatosensory evoked potentials (SEP) and the area under the curve (AUC) of the fMRI response showed similar dependence on stimulation frequency, with response size typically peaking at 5–7 Hz and decreasing at higher frequencies. (Fig. 2, Fig. 3B, 3C). MB-SWIFT fMRI accurately illustrated the whole whisker-to-cortex sensory pathway, highlighting the large 3D-coverage and robustness of the approach (Fig. 3A). The relationship between electrical recordings and the MB-SWIFT fMRI signal under anesthesia was well explained by a linear model (Fig. 4). In the awake condition, the sum of SEPs typically peaked at 9 Hz, accompanied by a less dramatic drop for the higher frequencies than in anesthetized rats (Fig. 2B). Although the awake fMRI response seems to increase in the lower frequency range akin to the sum of SEPs, a clear deviation is seen at 13 and 17 Hz (Fig. 2B, 3C). Consequently, a linear model fails to explain the relationship between electrical activity and the MB-SWIFT fMRI signal in the awake condition (Fig. 4).Discussion
While the exact mechanism behind MB-SWIFT fMRI contrast is not known, it has been proposed that a significant part originates from cerebral blood flow (CBF) effects1. Therefore, our finding of a linear interrelationship between MB-SWIFT fMRI signal and electrical activity under anesthesia was expected and consistent with previous BOLD fMRI studies5. The discrepancy found with stimulation frequencies > 9Hz in awake rats is interesting and may point to the contribution of inhibitory activity to increased CBF through neurovascular coupling or mechanisms unexplained by hemodynamics.Conclusion
In conclusion, MB-SWIFT fMRI provides a good proxy for neuronal activity under conditions conventionally used in experimental fMRI. This together with robustness and quietness of the approach further corroborates the use of zero echo time fMRI as an artefact free alternative to BOLD fMRI.Acknowledgements
This work was supported by NIH grants P41 EB027061 and R01 MH127548-01.References
1. Lehto L, Idiyatullin D, Zhang J, et al. MB-SWIFT functional MRI during deep brain stimulation in rats. Neuroimage. 2017;159:443-48.
2. Paasonen J, Laakso H, Pirttimäki T, et al. Multi-band SWIFT enables quiet and artefact-free EEG-fMRI and awake fMRI studies in rat. Neuroimage. 2020;206:116338.
3. Laakso H, Lehto LJ, Paasonen J et al. Spinal cord fMRI with MB‐SWIFT for assessing epidural spinal cord stimulation in rats. Magnetic resonance in medicine. 2021;86(4):2137-45.
4. Paasonen J, Stenroos P, Laakso H, et al. Whole-brain studies of spontaneous behavior in head-fixed rats enabled by zero echo time MB-SWIFT fMRI. Neuroimage. 2022;250:118924.
5. Ekstrom A. How and when the fMRI BOLD signal relates to underlying neural activity: the danger in dissociation. Brain research reviews. 2010;62(2):233-44.
6. Stenroos P, Paasonen J, Salo RA, et al. Awake rat brain functional magnetic resonance imaging using standard radio frequency coils and a 3D printed restraint kit. Frontiers in neuroscience. 2018;12:548.
Figures
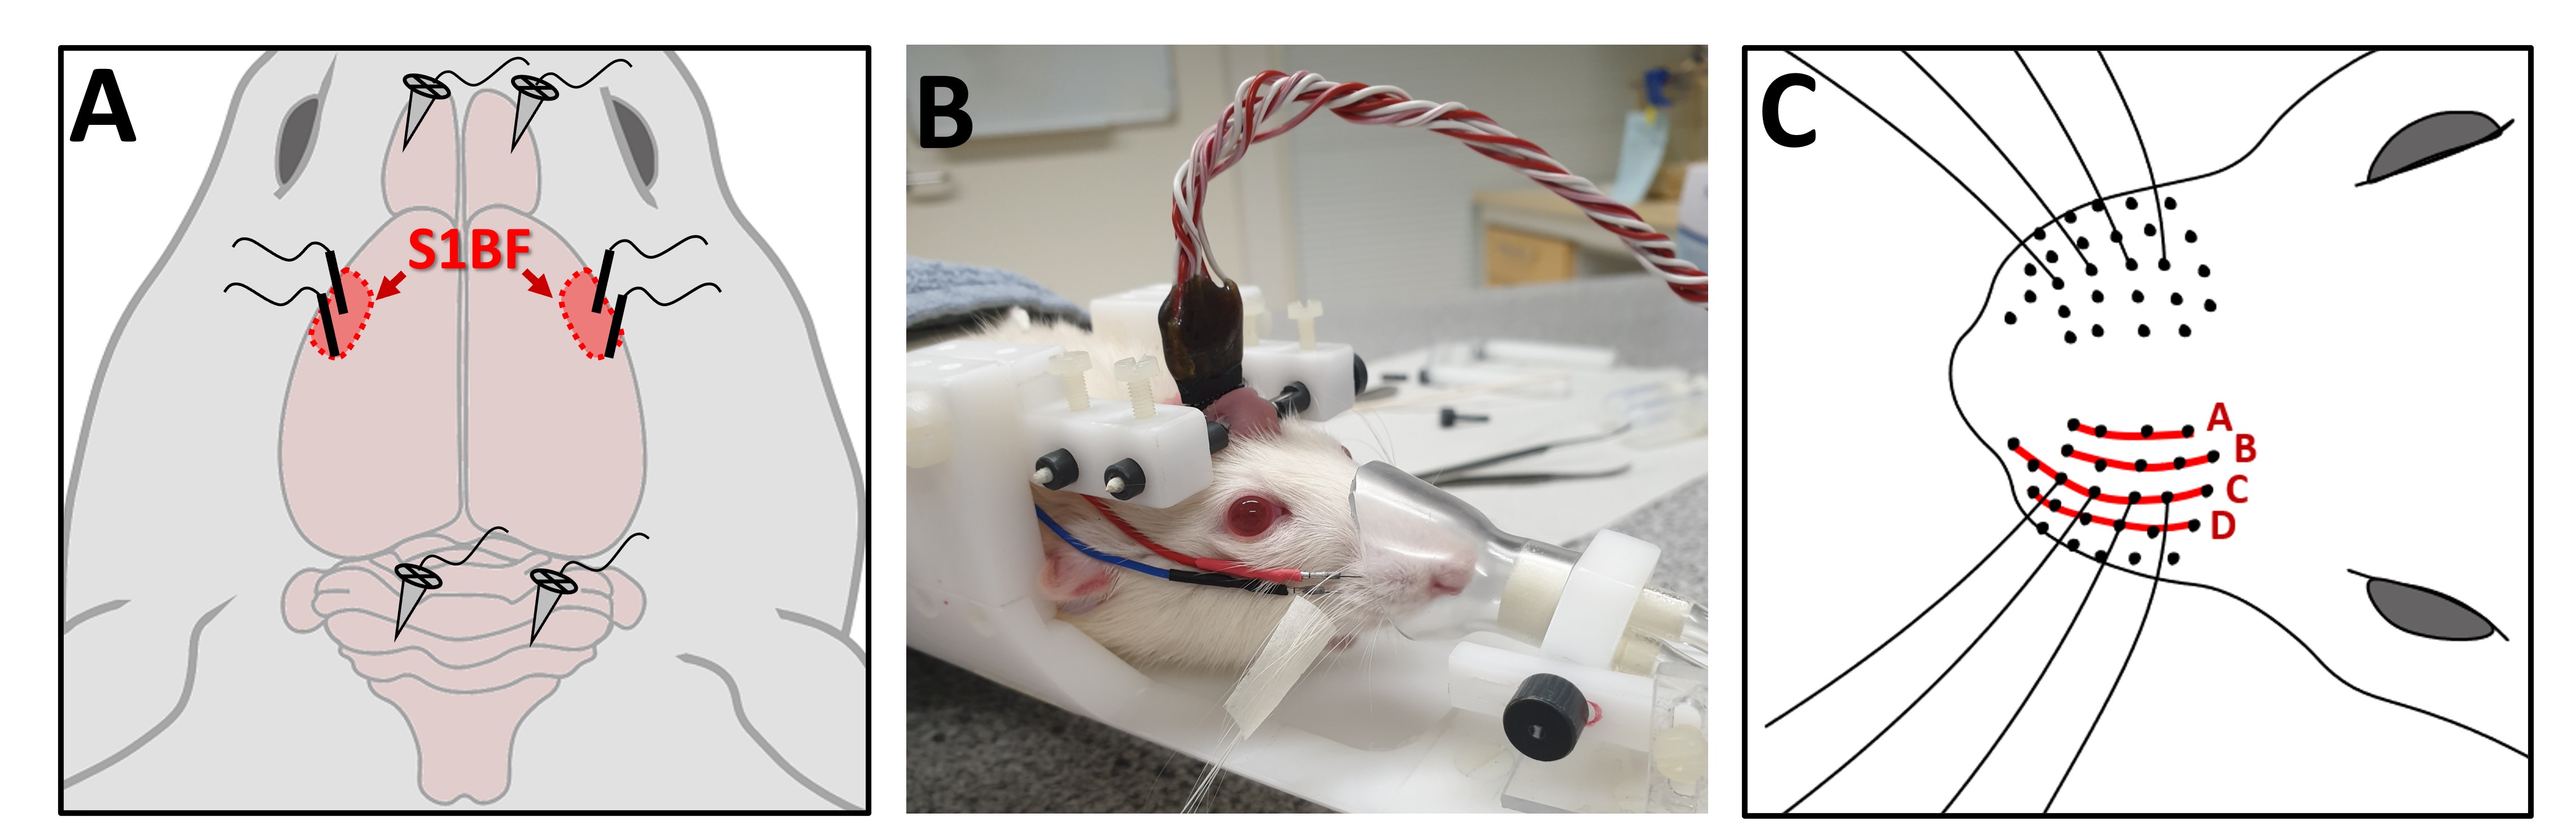
Figure 1. The experimental setup. (A) An illustration of the approximate locations of the skull screws and the tungsten wire electrodes on the surface of the barrel cortex (S1BF). (B) An anesthetized rat head-fixed in the MRI holder with needles in the whisker pad for electrical stimulation and a tape attached to the whiskers for mechanical stimulation with air puffs. Also visible in the picture is the cable that connects the electrodes to the recording equipment. (C) Whisker rows A–D.
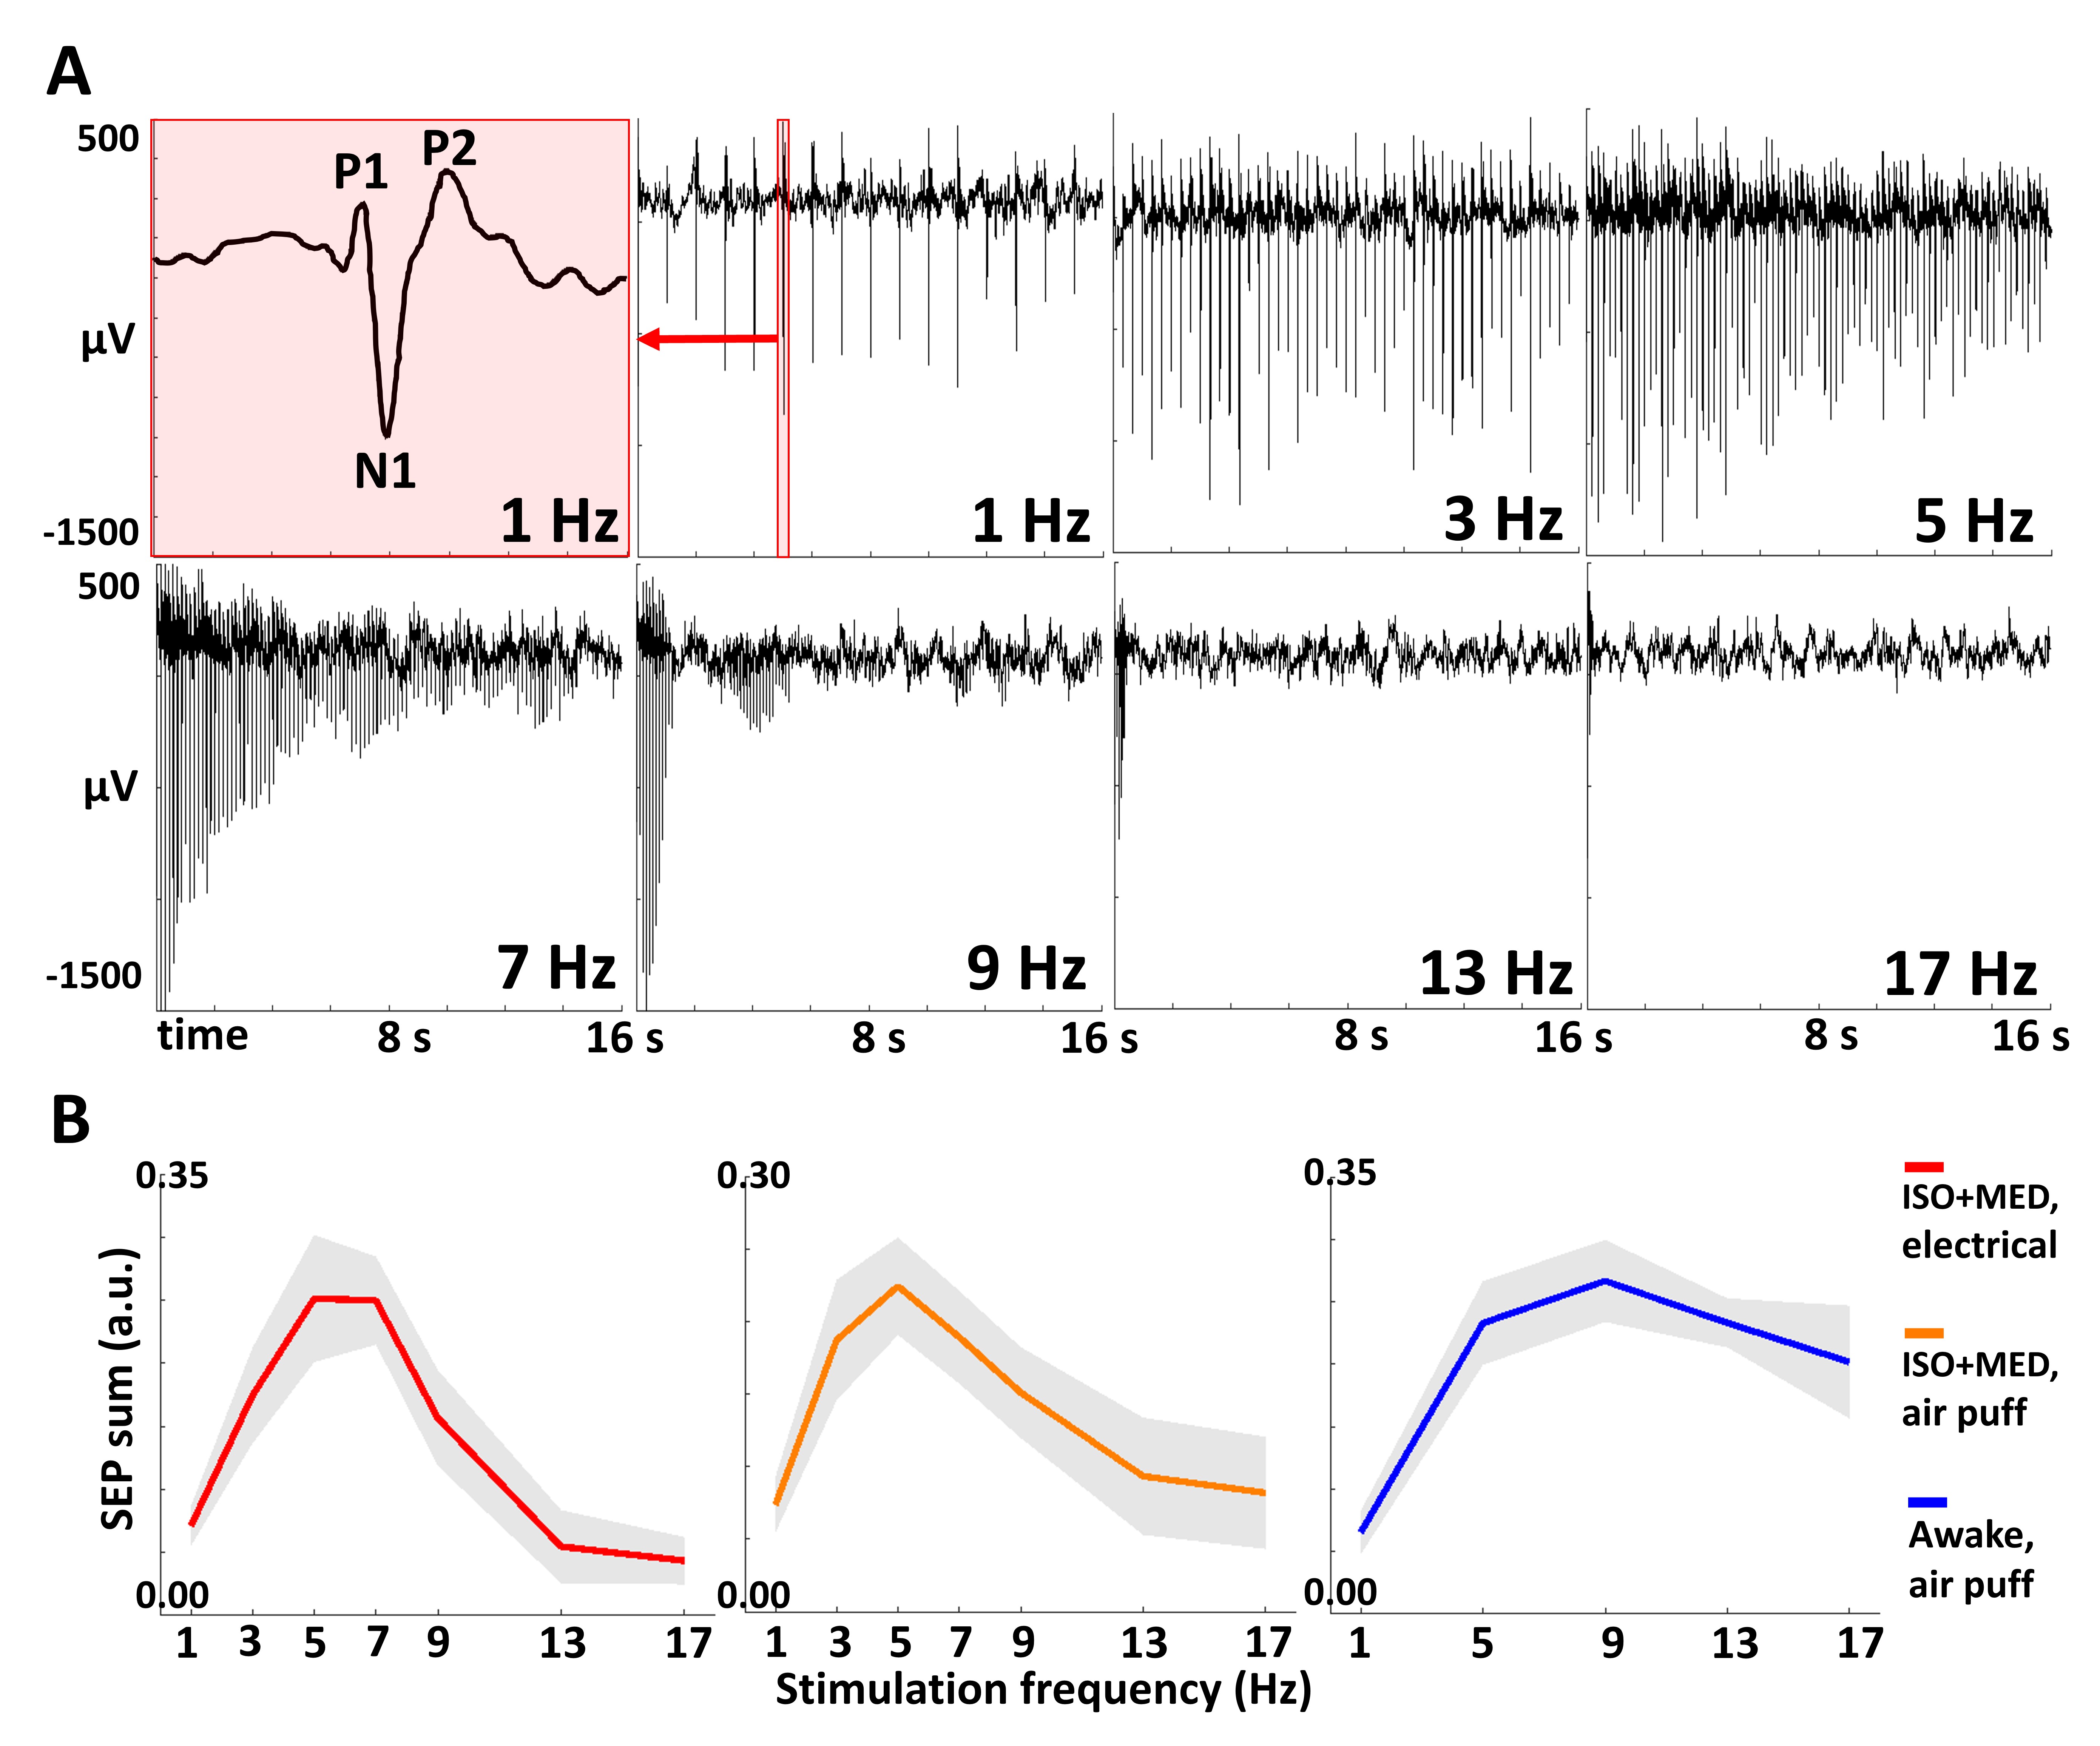
Figure 2. Electrical recordings during whisker stimulation. (A) Typical frequency-dependent SEP amplitude adaptation in one representative rat undergoing electrical whisker pad stimulation in anesthesia. The zoom-in on one SEP at 1 Hz illustrates the main components of a single stimulus response – the negative peak (N1), and the 1st and 2nd positive peak (P1 and P2). (B) Average frequency-dependence of total evoked neuronal activity, calculated as the mean of normalized sums of N1-to-P2 amplitudes. Mean (line) ± SD (shaded area). Data from 22 experiments per condition.
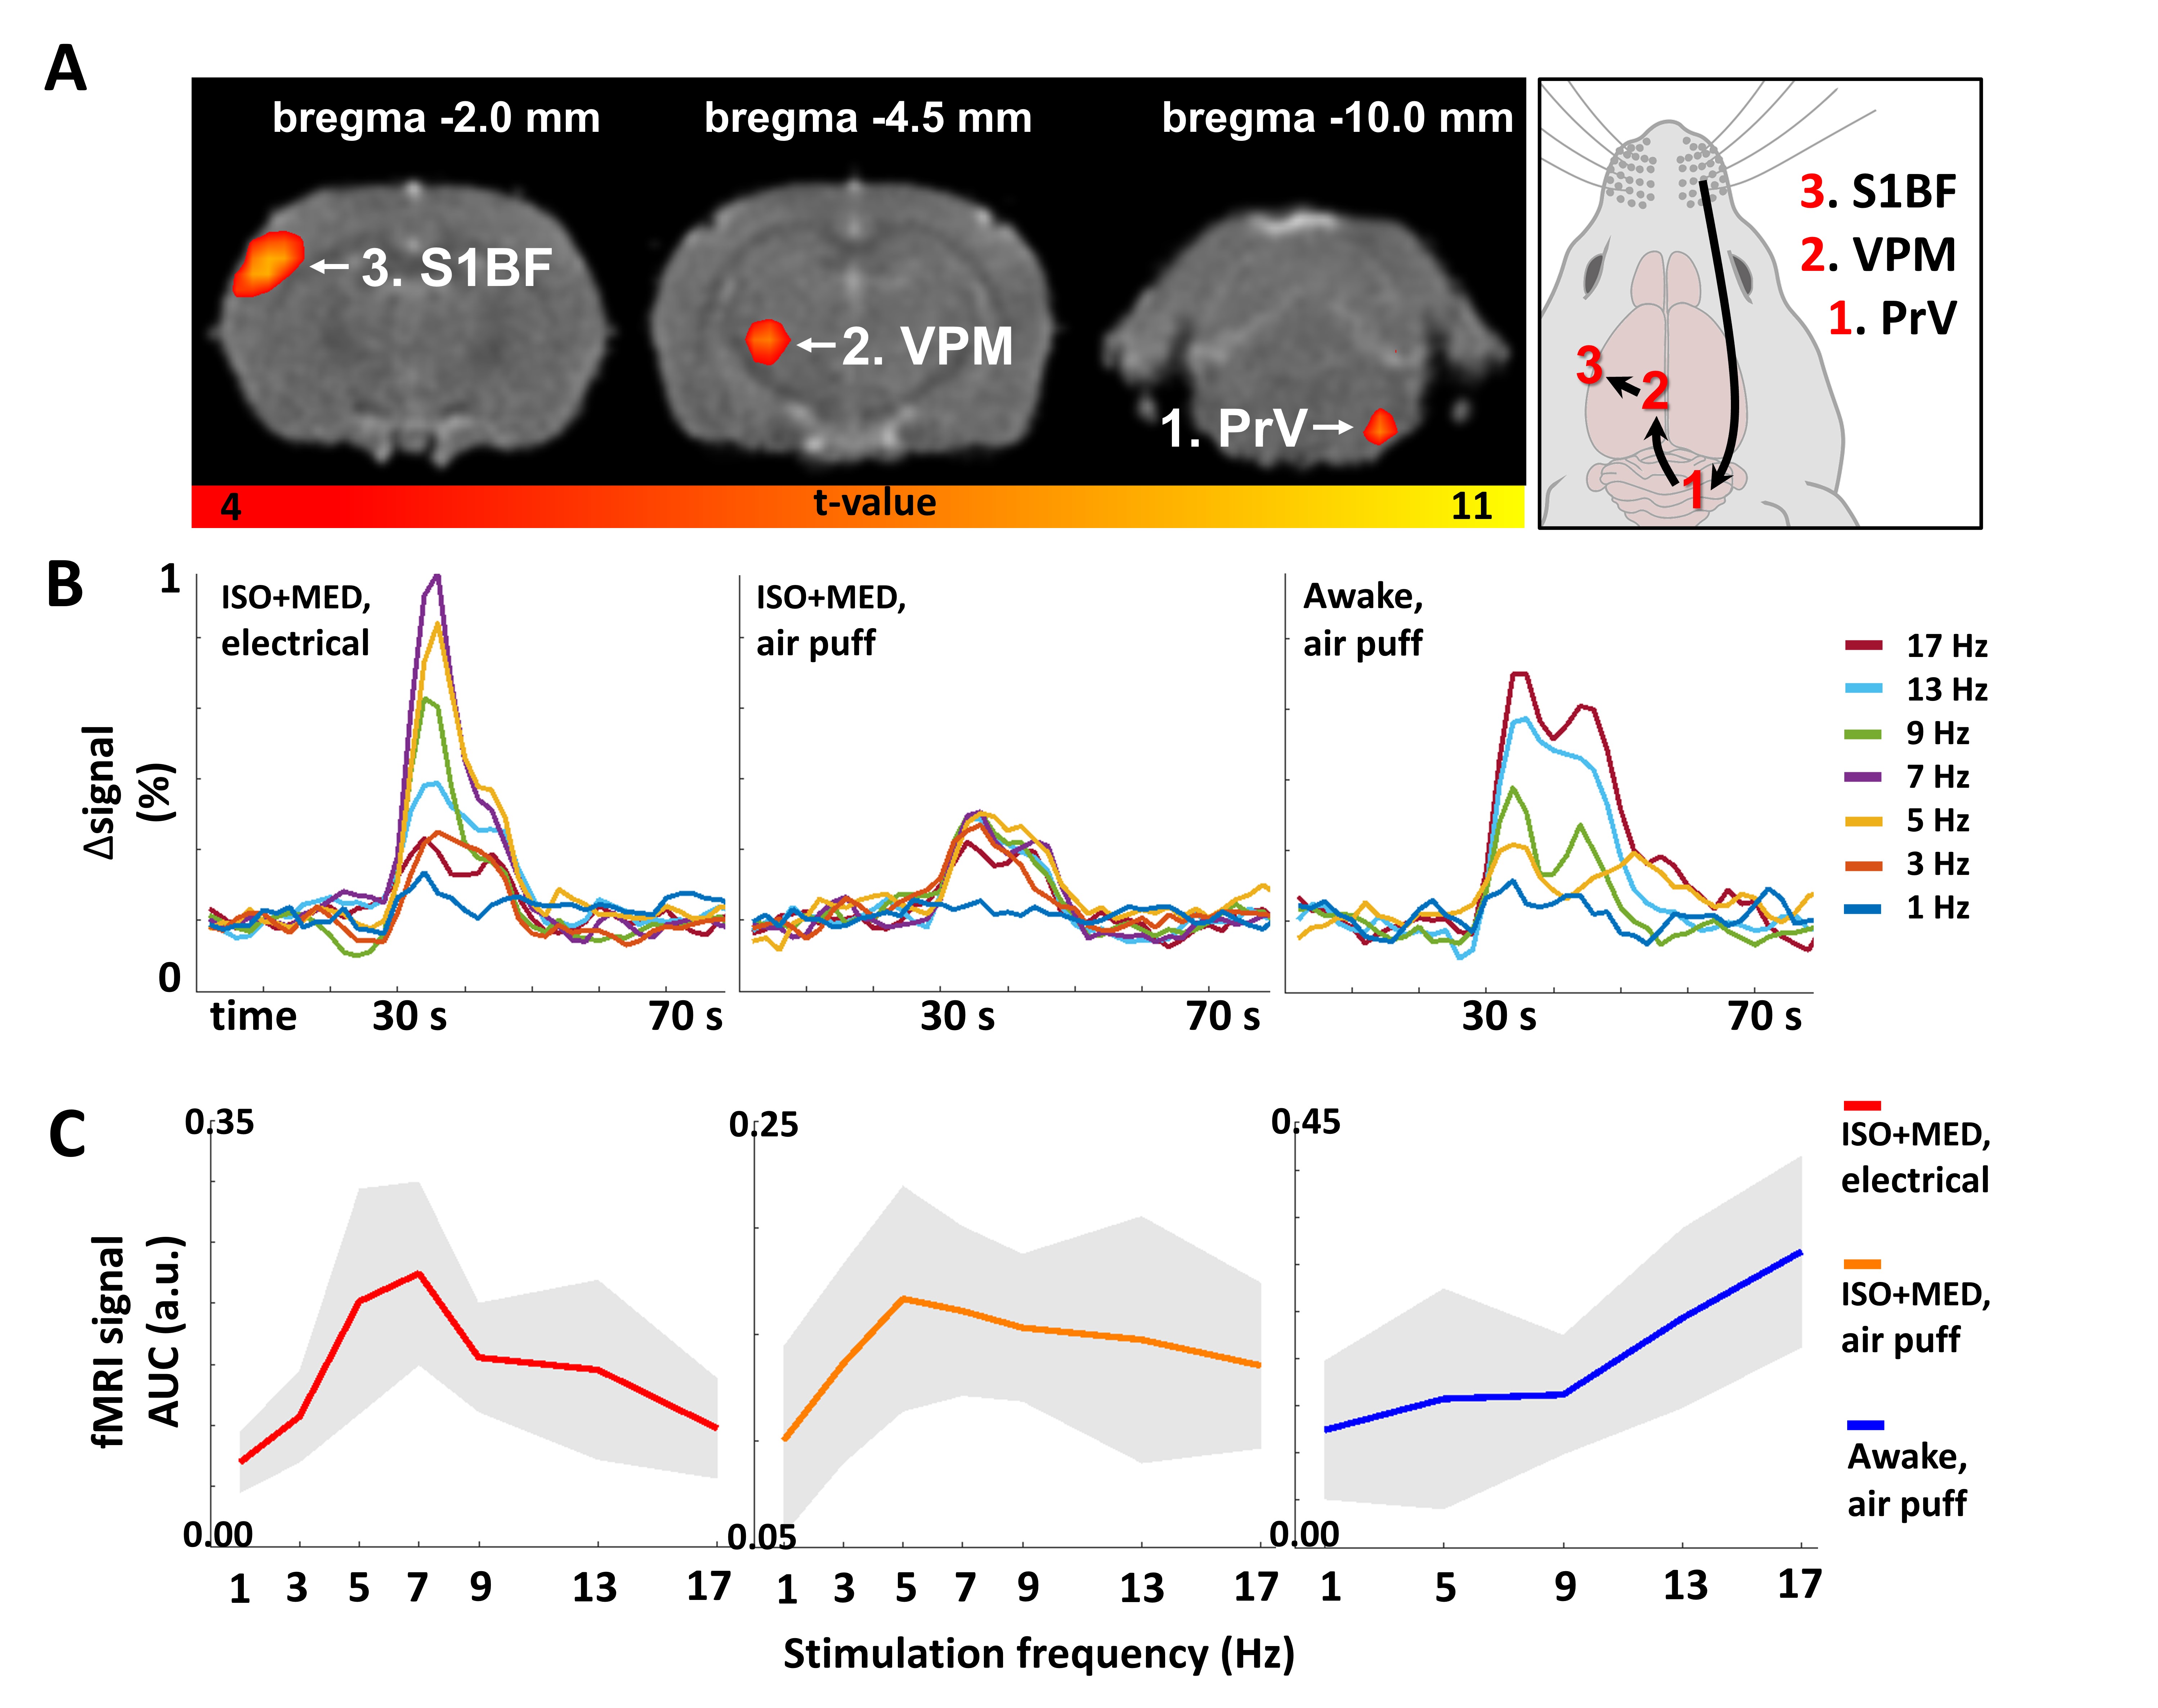
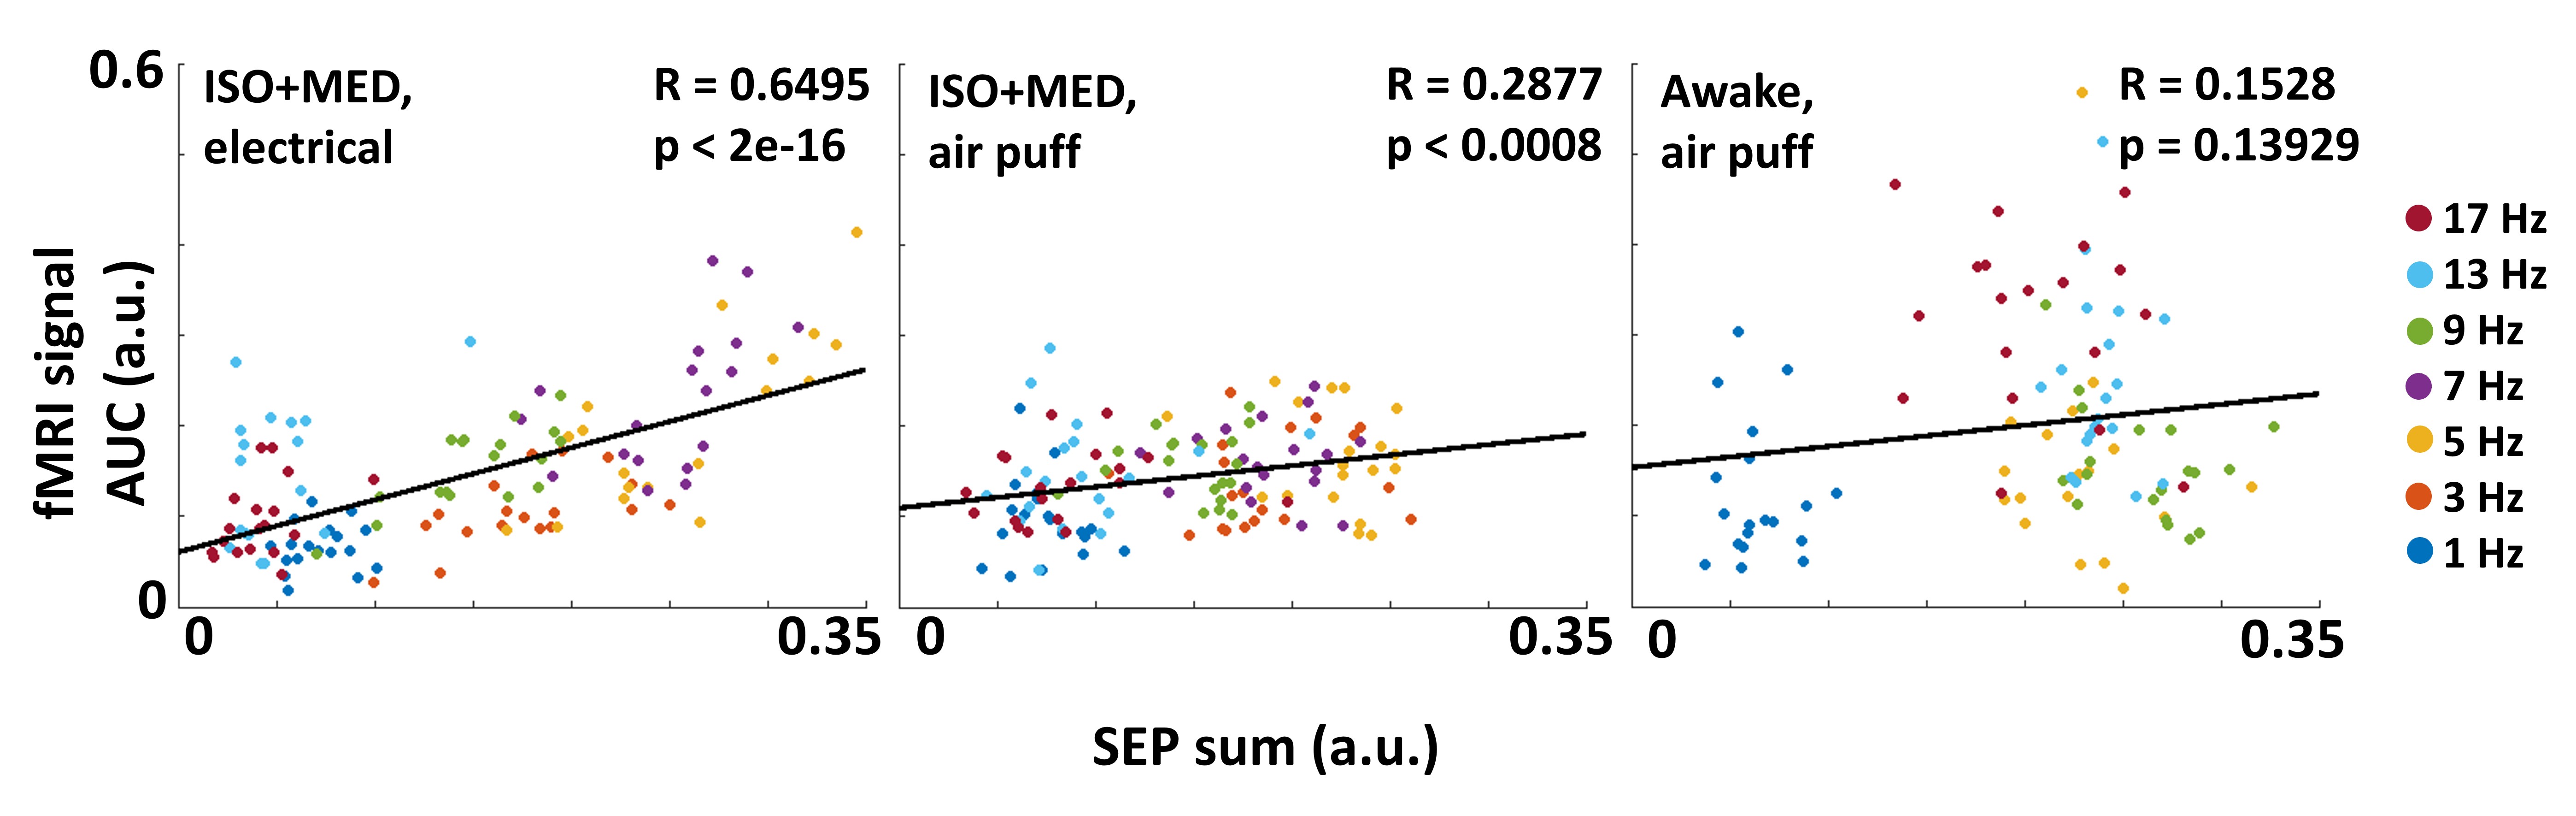
Figure 4. A linear regression model for the relationship between electrical activity and MB-SWIFT fMRI signal in the three experimental conditions. Data from 18–19 experiments per condition.