0917
In vivo Detection of Changes in Membrane Potential in Rat Cortex by T2 mapping1Department of Electrical and Computer Engineering, Seoul National University, Seoul, Korea, Republic of, 2Department of Physiology, Sungkyunkwan University School of Medicine, Suwon, Korea, Republic of, 3GE Global Research, Niskayuna, NY, United States, 4Department of Biomedical Engineering, Sungkyunkwan University, Suwon, Korea, Republic of, 5Department of Intelligent Precision Healthcare Convergence, Sungkyunkwan University, Suwon, Korea, Republic of, 6National Cancer Center, Goyang, Korea, Republic of
Synopsis
Keywords: fMRI, Contrast Mechanisms
Membrane potential is the crucial element of neuronal activation. We investigated the possibility of using MRI to detect the depolarization of membrane potential in rat cortex. To directly access brain cells, a craniotomy was performed to make a burr hole on the skull. T2 change in the exposed cortex was measured while depolarizing it by directly perfusing artificial cerebrospinal fluid of high potassium concentration. Our findings showed that T2 value of depolarized cortex increased by +2.7% at [K+] = 80 mM. This observation demonstrates that changes in membrane potential are detectable with MRI by T2 contrast in vivo.
Introduction
Membrane potential is essential to brain activation. In particular, electric communication between neurons is mediated by changes in membrane potential, including action potential and postsynaptic potential. There have been a variety of methods for detecting neuronal membrane potential, such as patch-clamp1 and optical measures2. However, these methods are often invasive and limited in a penetration depth3. Since MRI is a noninvasive imaging modality that provides good spatial resolution with a wide field-of-view covering the whole brain, there have been various studies to utilize MRI for detecting changes in neuronal membrane potential. For example, BOLD contrast arising from cerebral hemodynamic changes has been widely used as an indirect marker of neuronal activation4. Some other MRI studies5 aimed to directly detect neuronal activity with nanotesla magnetic fields generated from neuronal currents. Recently, direct imaging of neuronal activity at millisecond temporal resolution was reported, and its contrast source was hypothesized to be T2 change6. In this study, we directly depolarized the membrane potential of brain cells in the surgically exposed cortex and measured the difference in T2 value before and after the depolarization. Our results demonstrated that the T2 value exhibits measurable changes by depolarization of membrane potential.Methods
Surgery. 8-weeks-old male rats were used for MRI experiments after a craniotomy. The surgery was performed with reference to Mostany and Portera-Cailliau, 20087. A burr hole was opened above the left visual cortex, and the dura mater was removed. A cylindrical chamber was implanted upon the hole and filled with artificial cerebrospinal fluid (Fig. 1). All animal experiments were approved by the Institutional Animal Care and Use Committee at the National Cancer Center Korea (NCC-22-740).Manipulation of membrane potential. The membrane potential of brain cells was maintained at a resting potential by perfusing the surgically exposed cortex with normal aCSF, which was prepared with [K+] = 3 mM. The other components are detailed in Fig. 2. The depolarization of membrane potential was performed by perfusing high-K+ aCSF, which contained elevated [K+] = 20, 40, or 80 mM. Particularly, we added Nω-Nitro-L-arginine8, Nifedipine9, and EGTA9 as baseline components for both normal and high-K+ aCSF throughout the whole experiments to suppress the hemodynamic response.
MRI scan. Rats were placed in a 7 T MRI scanner. MR images were acquired in a 3 mm coronal slice passing through the center of the burr hole using a multi-echo spin-echo sequence (TR = 3000 ms, TE = 8.7 – 139.1 ms, 16 echoes) for T2 mapping. During MRI scan, rats were subjected to one of two experiments consisting of resting and depolarization conditions (Fig. 3). One experiment was Recovery Type (n = 5): it started from the resting condition, then to the depolarization condition with [K+] = 20 mM, and back to the resting condition (washout). The other experiment was Gradual Type (n = 3): it started from the resting condition, then to the depolarization condition with [K+] = 40 mM, and to further depolarization condition with [K+] = 80 mM.
Data analysis. For T2 mapping, MR signals acquired with a multi-echo spin-echo sequence were matched with a simulated dictionary of echo trains created with the stimulated and slice profile correction10. The cortical region positioned below the perfusion chamber (rectangle, cortical depth = 0.25 - 0.75 mm, width = 3 mm) was set as the region of interest (ROI), and T2 values in the ROI were averaged to produce a single data point.
Results
Recovery Type Experiment. In vivo manipulation of membrane potential showed T2 changes in the exposed cortex region. Compared to the resting condition, the depolarization condition with high-K+ aCSF ([K+] = 20 mM) increased T2 by +1.7% (p < 0.05). After a washout by perfusing the normal aCSF, the T2 value changed back to +0.4% (p > 0.05) compared to the initial resting condition (Fig. 4).Gradual Type Experiment. The change in T2 value while [K+] was gradually increased showed a similar trend to Recovery Type experiments. Compared to the resting condition, the depolarization condition with high-K+ aCSF ([K+] = 40 mM) increased T2 by +1.1±0.6%. The depolarization condition with high-K+ aCSF ([K+] = 80 mM) further increased T2 by +2.7±0.9% (Fig. 4). Since the sample number n was small, here we reported standard deviations instead of p-values.
Discussion
In this study, our observation demonstrated that T2 exhibits MR measurable changes during the depolarization of rat brain cells in vivo. While the mechanism for the dependence of T2 on membrane potential is still unclear, we suggest two possible mechanisms of T2 change. First, water molecules hydrating neuronal membranes decrease when neurons depolarize11. Since hydration water has much shorter T2 than free water12, decreases in the amount of hydration water will increase T2 on average. Second, depolarization accompanies cell swelling13, which decreases the density of cellular content and thus increases T2.Conclusion
In summary, it is shown that T2 reflects the depolarization of membrane potential in vivo. This observation suggests that T2 changes due to membrane potential could be a contrast mechanism for the direct detection of neuronal activation.Acknowledgements
This work was supported by the Brain Research Program through the National Research Foundation of Korea: NRF-2019M3C7A1031993 and NRF-2019M3C7A1031994.
This work was supported by the BK21 FOUR program of the Education and Research Program for Future ICT Pioneers, Seoul National University in 2022.
Animal molecular imaging facility at the National Cancer Center Korea contributed for supportive animal magnetic resonance imaging.
References
1. Neher, E., Sakmann, B., 1976. Single-channel currents recorded from membrane of denervated frog muscle fibres. Nature 260, 799-802.
2. Tasaki, I., Watanabe, A., Sandlin, R., Carnay, L.D., 1968. Changes in fluorescence, turbidity, and birefringence associated with nerve excitation. Proceedings of the National Academy of Sciences of the United States of America 61, 883-888.
3. Brette, R., Destexhe, A. (Eds.), 2012. Handbook of Neural Activity Measurement. Cambridge University Press, Cambridge.
4. Ogawa, S., Lee, T.-M., Kay, A.R., Tank, D.W., 1990. Brain magnetic resonance imaging with contrast dependent on blood oxygenation. Proceedings of the National Academy of Sciences of the United States of America 87, 9868-9872.
5. Bodurka, J., Bandettini, P.A., 2002. Toward direct mapping of neuronal activity: MRI detection of ultraweak, transient magnetic field changes. Magnetic Resonance in Medicine 47, 1052-1058.
6. Toi, P. T., Jang, H. J., Min, K., Kim, S.-P., Lee, S.-K., Lee, J., Kwag, J., Park, J.-Y., 2022. In vivo direct imaging of neuronal activity at high temporospatial resolution. Science 378, 160-168.
7. Mostany, R., Portera-Cailliau, C., 2008. A Craniotomy Surgery Procedure for Chronic Brain Imaging. Journal of Visualized Experiments, e680.
8. Dreier, J.P., Körner, K., Görner, A., Lindauer, U., Weih, M.K., Villringer, A., Dirnagl, U., 1995. Nitric Oxide Modulates the CBF Response to Increased Extracellular Potassium. Journal of Cerebral Blood Flow and Metabolism 15, 914-919.
9. Redmond, L., Kashani, A.H., Ghosh, A., 2002. Calcium Regulation of Dendritic Growth via CaM Kinase IV and CREB-Mediated Transcription. Neuron 34, 999-1010.
10. McPhee, K.C., Wilman, A.H., 2017. Transverse relaxation and flip angle mapping: evaluation of simultaneous and independent methods using multiple spin echoes. Magnetic Resonance in Medicine 77, 2057-2065.
11. Tarun, O.B., Hannesschläger, C., Pohl, P., Roke, S., 2018. Label-free and charge-sensitive dynamic imaging of lipid membrane hydration on millisecond time scales. Proceedings of the National Academy of Sciences of the United States of America 115, 4081-4086.
12. Edzes, H.T., Samulski, E.T., 1978. The measurement of cross-relaxation effects in the proton NMR spin-lattice relaxation of water in biological systems: hydrated collagen and muscle. Journal of Magnetic Resonance 31, 207-229.
13. Ballanyi, K., Grafe, P., Serve, G., Schlue, W.-R., 1990. Electrophysiological measurements of volume changes in leech neuropile glial cells. Glia 3, 151-158.
Figures
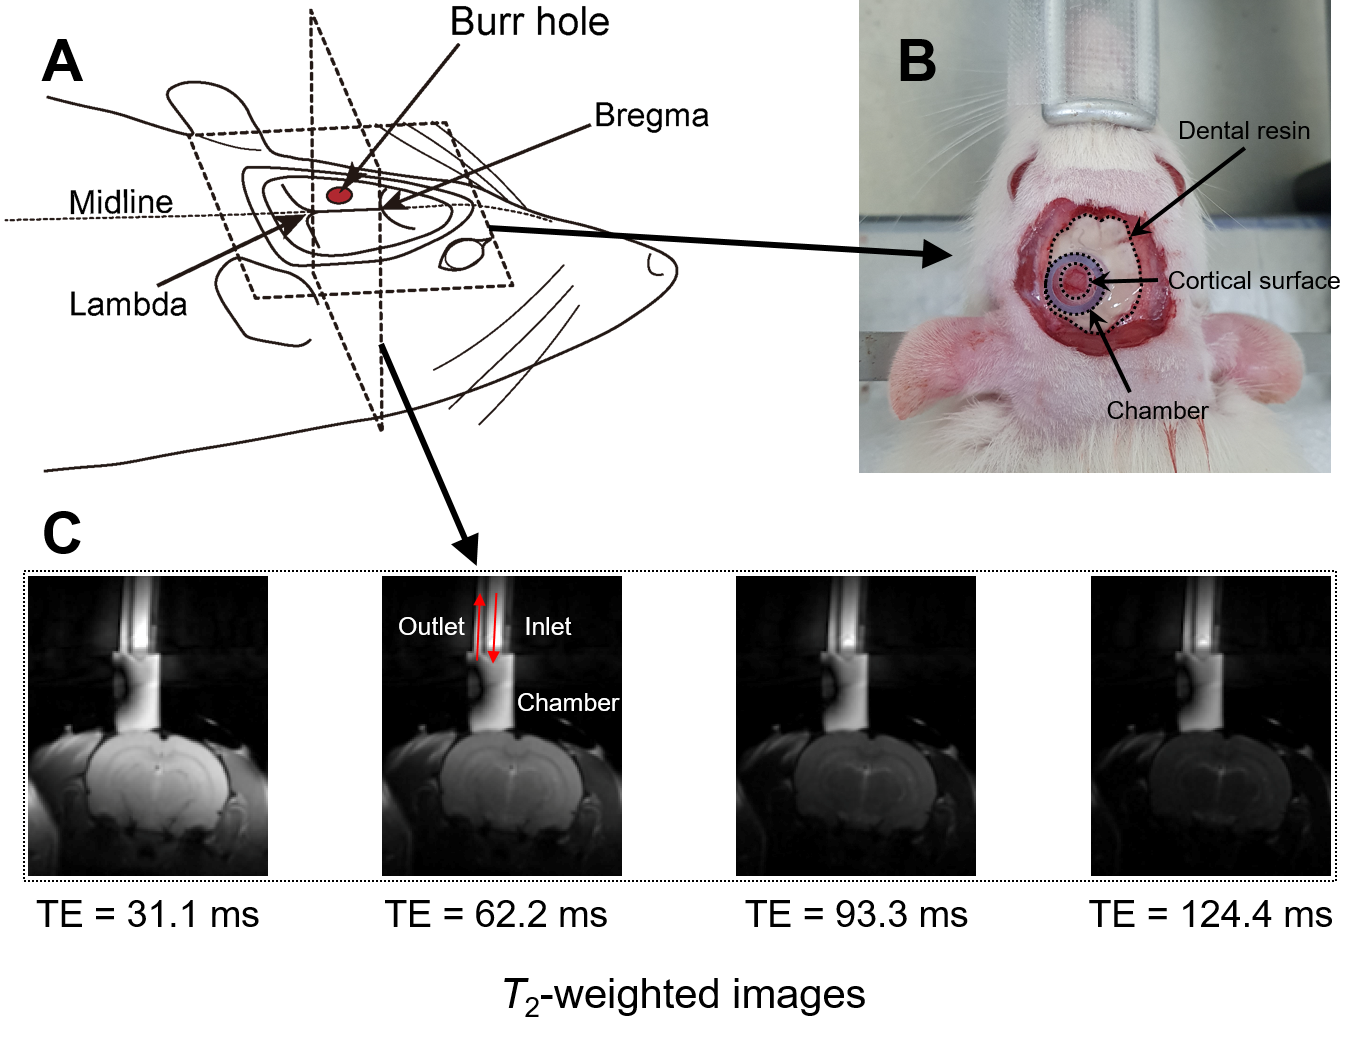
Fig. 1. The experimental setup for in vivo manipulation of membrane potential. (A) A schematic diagram of the rat head after a craniotomy. A burr hole was drilled on the skull covering the left visual cortex. (B) Photograph of the rat head after fixing a chamber on the burr hole. The chamber was filled with aCSF. (C) Representative series of T2-weighted MR images for T2 mapping.
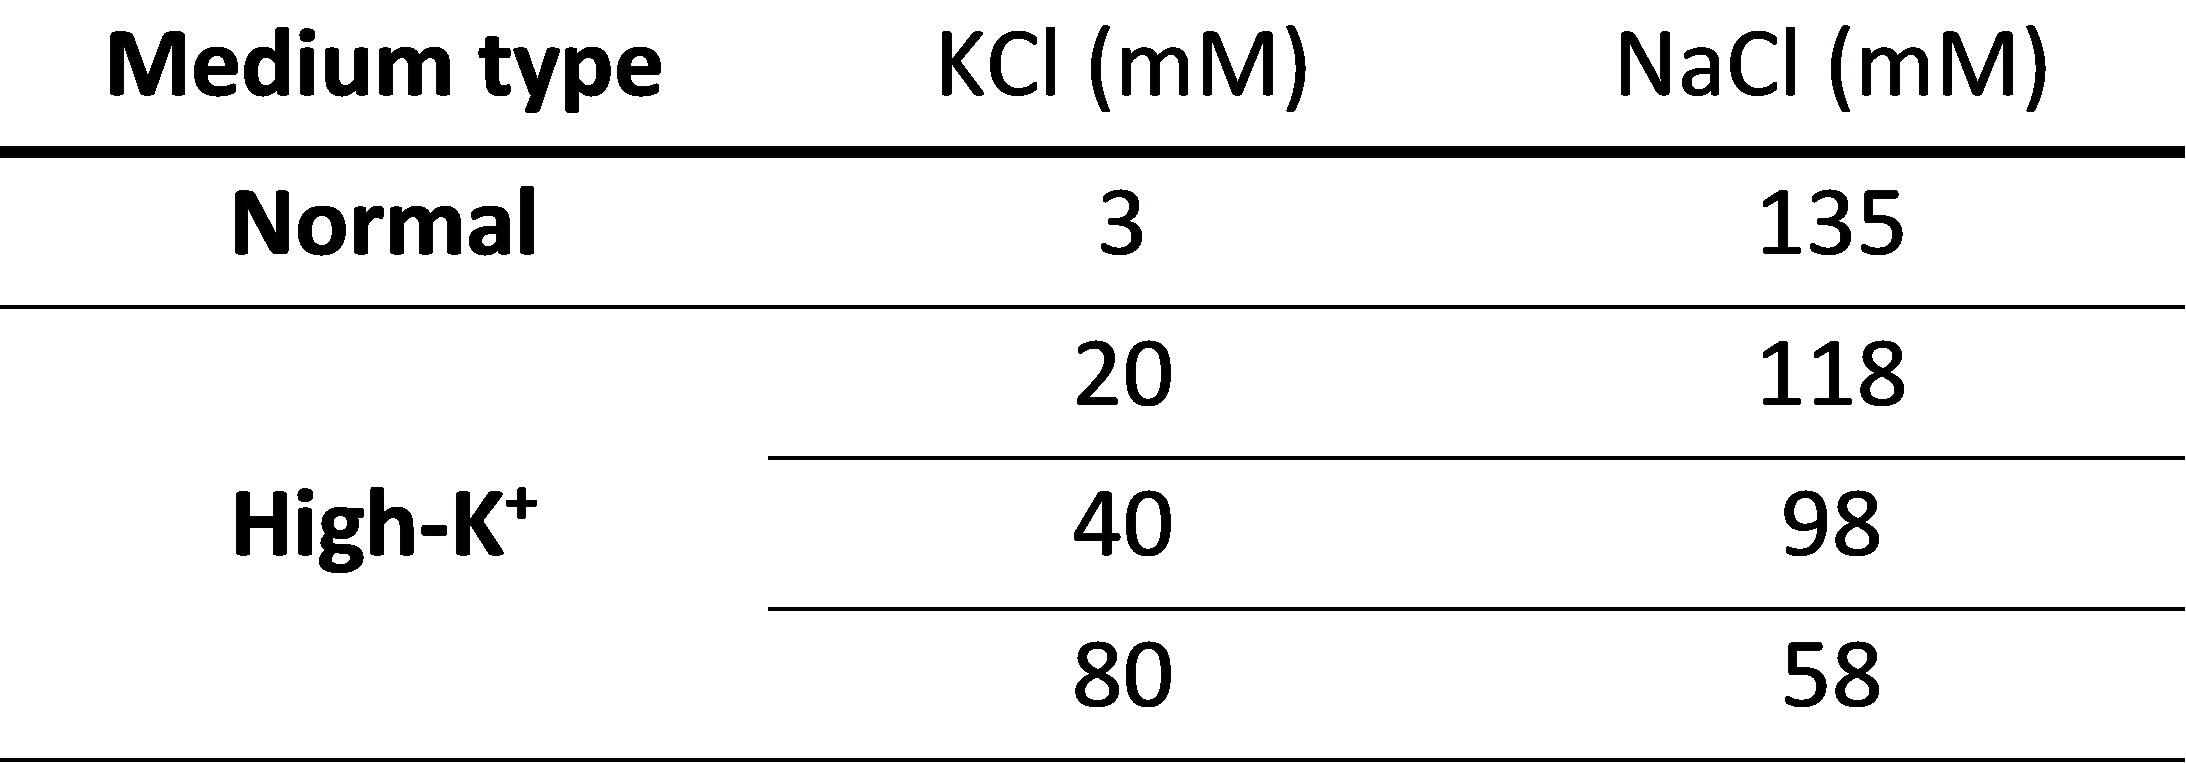
Fig. 2. The composition of aCSF used to adjust membrane potential. The sodium chloride concentrations were adjusted to maintain the same osmolarity across all buffers. Besides the inorganic salts listed in this table, all buffers commonly contained MgCl2 = 3 mM; HEPES = 20 mM; glucose = 4.5 g/l; EGTA = 2 mM; Nω-Nitro-L-arginine = 1 mM; Nifedipine = 0.1 mM; Dibucaine hydrochloride = 0.1 mM; pH = 7.4.
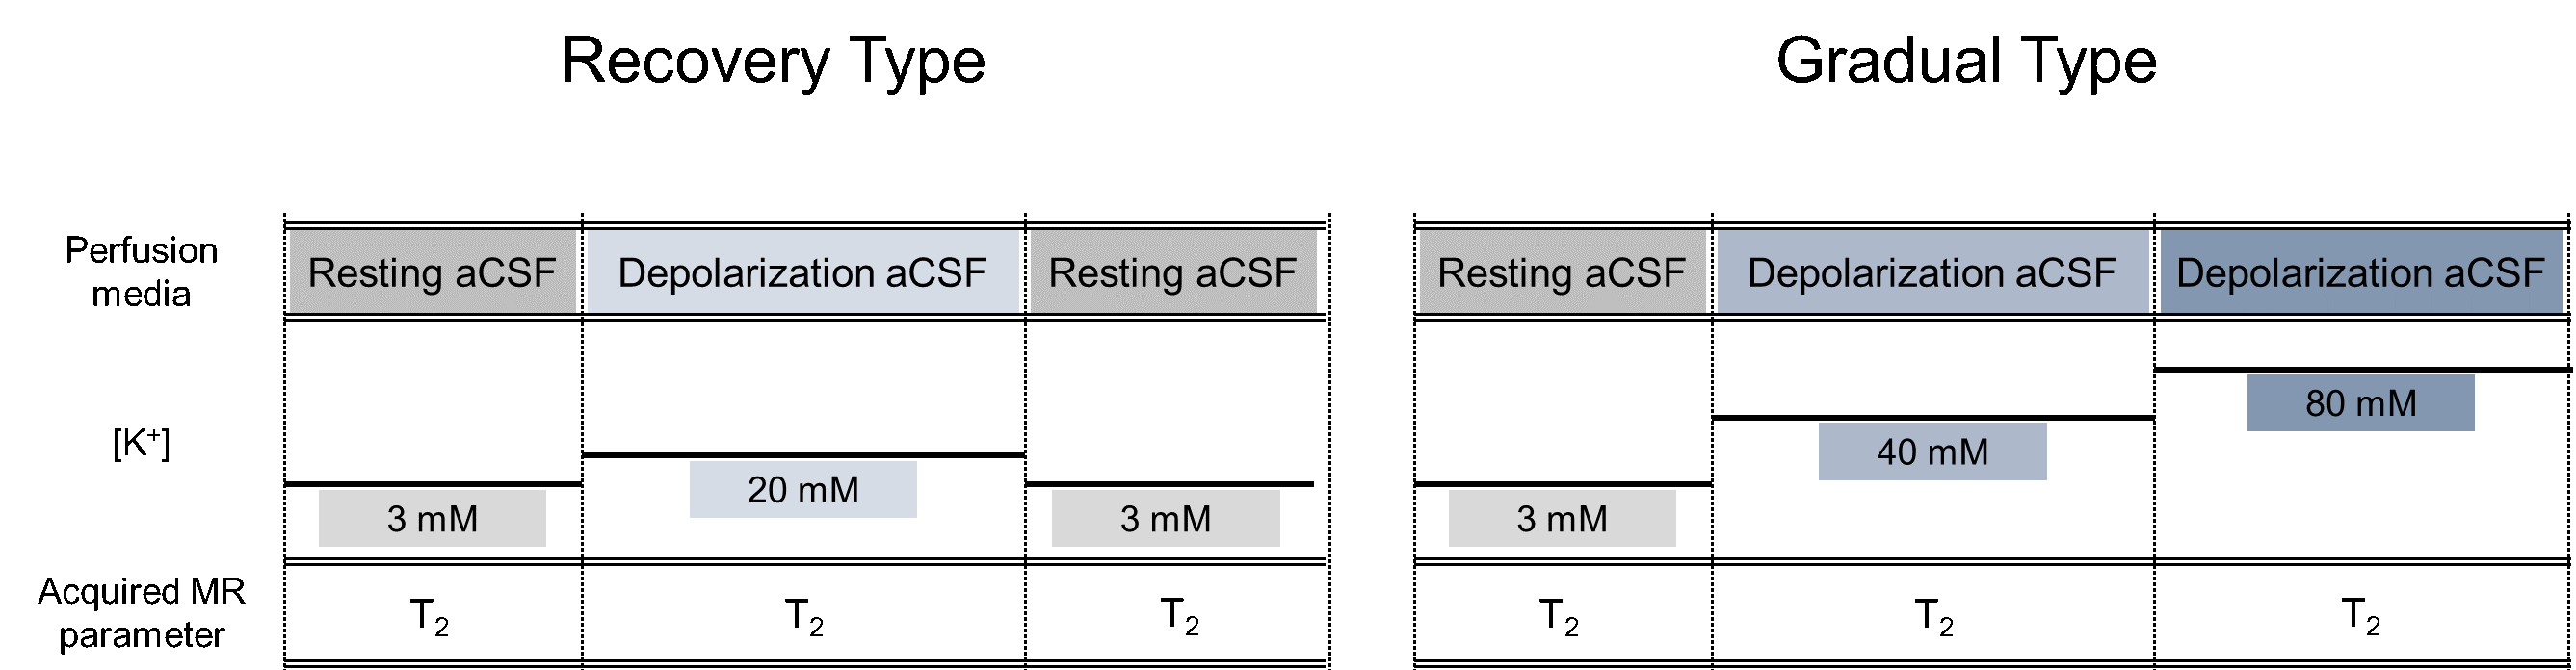
Fig. 3. The experimental paradigm of in vivo rat MR imaging. In the Recovery Type experiment, the potassium concentration of perfused aCSF changed from 3 to 20 mM, then 20 to 3 mM. In the Gradual Type experiment, the potassium concentration of perfused aCSF changed from 3 to 40 mM, then 40 to 80 mM.
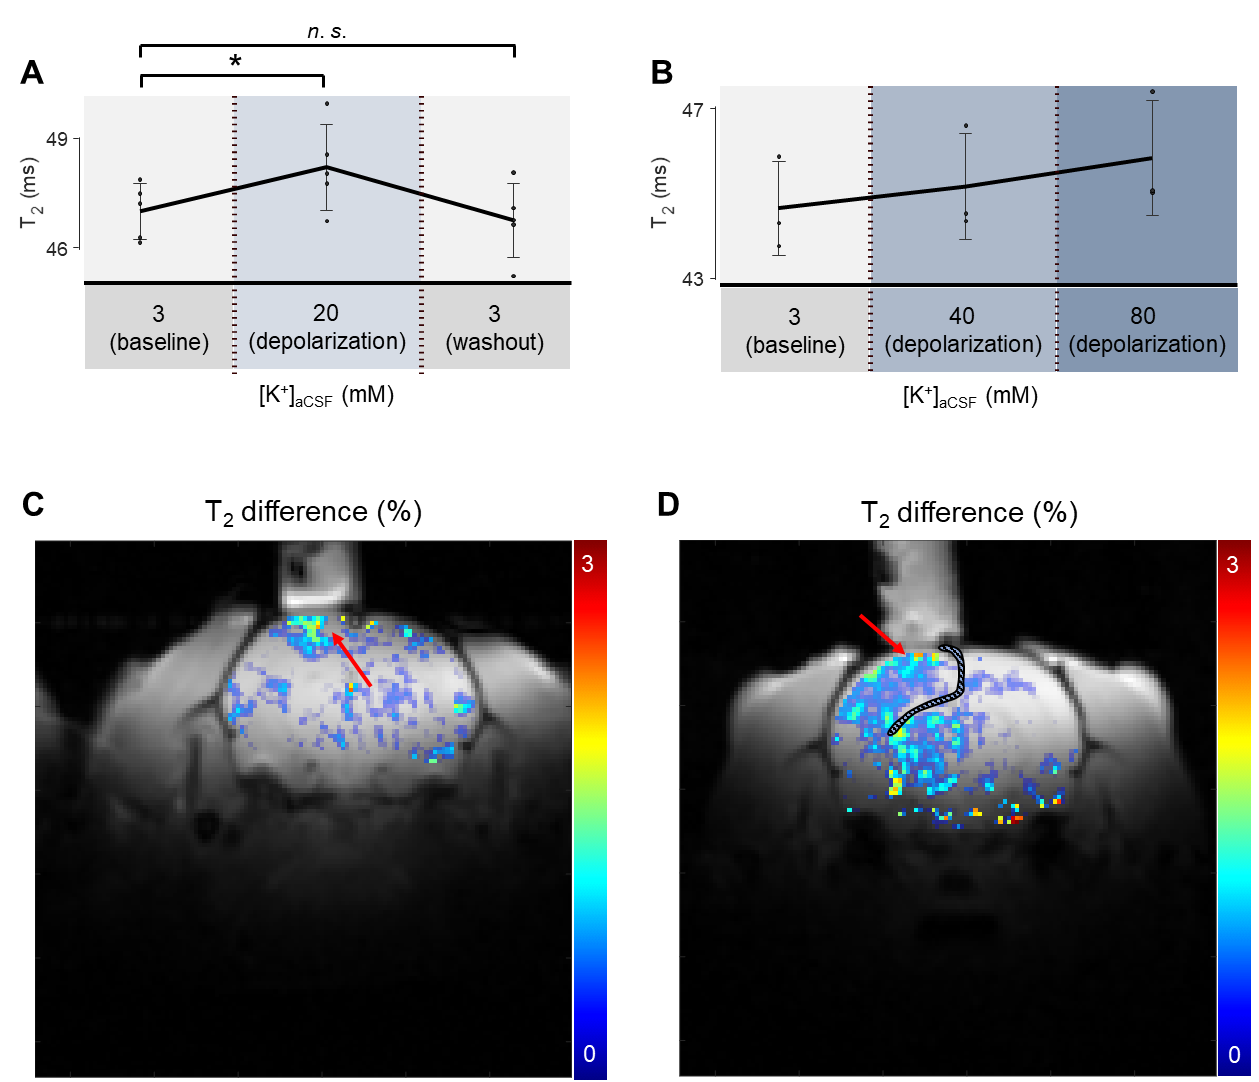
Fig. 4. The T2 changes induced by depolarization. T2 values were averaged over the ROI below the perfusion chamber. (A) Recovery Type experiments (n = 5). (B) Gradual Type experiments (n = 3). (C) An example of a T2 difference map. The averaged T2 map during [K+] = 3 and 40 mM was subtracted from the T2 map during [K+] = 80 mM. The red arrow indicates the increases in T2. (D) Another example of a T2 difference map. A craniotomy induced the expansion of subdural space (hashed). Therefore, high-K+ aCSF was not only confined below the perfusion chamber.