0916
Investigating the Direct Imaging of Neuronal Activity (DIANA) contrast mechanism using human brain organoids1Australian Institute for Bioengineering and Nanotechnology, University of Queensland, St Lucia, Australia, 2School of Information Technology and Electrical Engineering, University of Queensland, St Lucia, Australia, 3Centre for Advanced Imaging, University of Queensland, St Lucia, Australia
Synopsis
Keywords: Contrast Mechanisms, fMRI, DIANA
Here we describe our initial results investigating DIANA’s ability to capture neuronal activation in humans brain organoids. Following drug delivery a 3min long window with 0.5% increased signal was observed. Although tantalising, further experiments are needed to confirm these results.Introduction
The Direct Imaging of Neuronal Activity (DIANA) method aims to non-invasively capture neuronal activity using MRI1. In mice, DIANA correlates well with spiking density. However, the physical mechanism driving this signal change are not yet well understood. Here we describe our initial results investigating DIANA’s ability to capture chemically elicited neuronal activation in human brain organoids.Methods
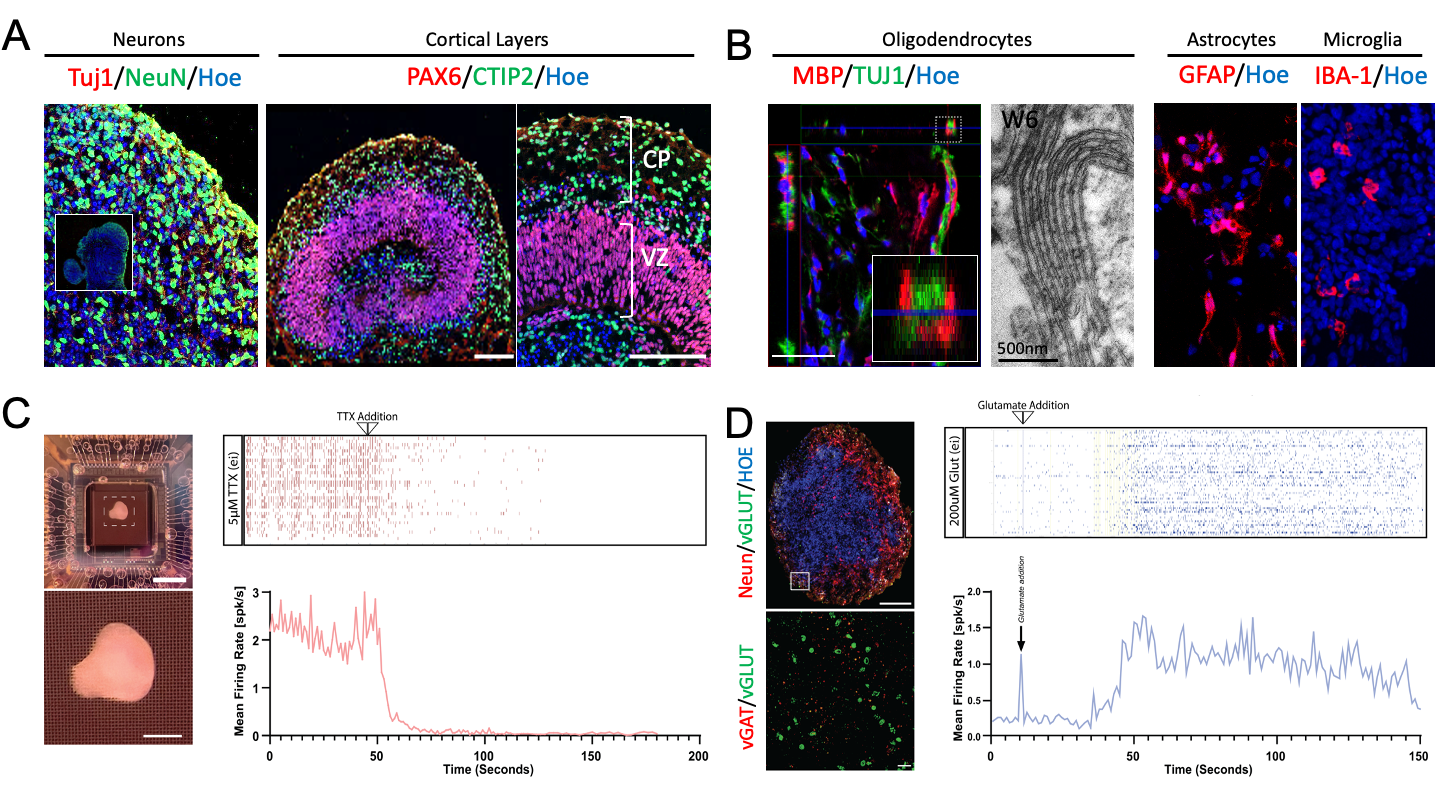
Human brain organoids can be grown in vitro from pluripotent stem cells. These cells can differentiate and grow into a self-organised brain tissue like structure that contain an ensemble of neurons, astrocytes, microglia and oligodendrocytes (Fig. 1a, b)2,3. Multi-electrode array (MEA) recordings of mature brain organoids show spontaneous activity (baseline; Fig. 1c) and increased neuronal activity when exposed to neurotransmitters (eg glutamate; Fig. 1d).Interestingly, these organoids do not have a vascular system. All the nutrients and oxygen needed to maintain homeostasis are absorbed directly from the surrounding medium. Making them an ideal testbed to investigate non-hemodynamic fMRI techniques, such as diffusion fMRI4 and DIANA1.
To investigate if DIANA can capture non-hemodynamic functional signals, we scanned a 3-month-old human brain organoid (Fig.2a, b). An acrylic imaging platform was built to hold optical components and a 3.5cm surface coil (Fig.2c). The coil was tuned and matched to the sample, including ~2mL of terminal differential media (TDM)3, residing in a 3.5cm diameter well. A custom build pneumatically actuated 1mL syringe was used to remotely deploy 50mM of Potassium Chloride (KCl) diluted in 0.2mL of buffer during the scan (Fig.2d).
DIANA uses a spoiled gradient recalled echo (GRE) sequence with phase and measurement loops swapped5. Combined with a repetitive stimulus, such a sequence can be used to obtain trial averaged response curves with milli-second temporal resolution1,5. However, our brain organoids are chemically excited, leading to several minutes of continues activation. Therefore, we used the traditional GRE ordering and recorded the signal intensities throughout the experiment with a 0.57s temporal resolution (TR=6ms, TE=3.0ms, 0.5x0.5mm, 96x96matrix). The excitation pulse was empirically calibrated to match the Ernst angle. Over 5000 images were collected starting 5min pre- and ending 45min post-injection. In addition, high resolution 3D imaging was performed to visualise the organoid sitting in the well.
All data was collected using whole body 7 Tesla MRI system (Siemens, Erlangen, Germany). Regions of interest (ROI) were drawn using IKT-SNAP6, and data was processed in Matlab (Mathworks, USA). Only linear detrending was used.
Results and Discussion
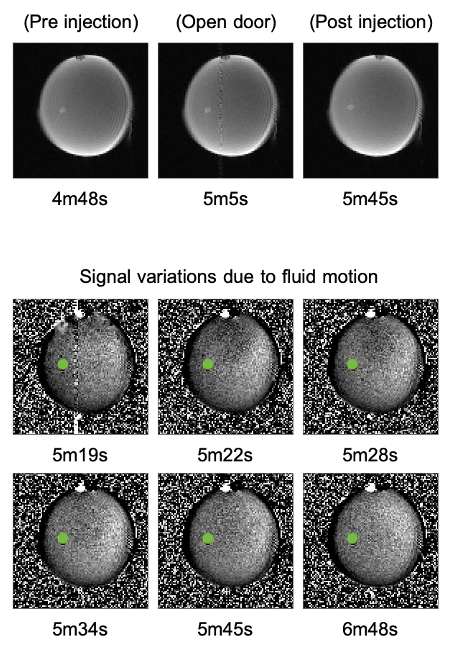
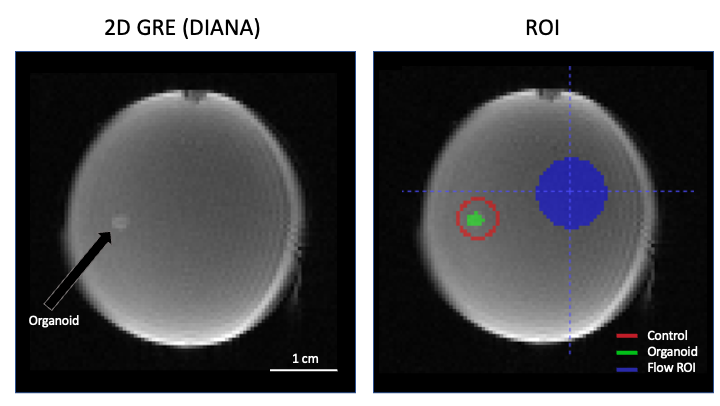
Figure 1b shows the brain organoid laying on the bottom of the well. It is not attached to the surface, only friction prevents it from moving. The pneumatical actuator, used to remotely deliver the drug, build up some pressure before it could overcome the plunger’s initial friction. Consequently, the chemicals are released into the dish with some force, slightly moving the organoid (Fig.3 top) and creating a small but widespread fluid motion that takes ~30s to dissipate (Fig.3 bottom). Note that not all areas are affected equally.ROI were drawn pre and post injection following organoid movement (Fig.4 green). A control ROI (Fig.4 red) maintaining a one voxel wide ring around the organoid was selected to control for flow and chemically related signal changes in the direct vicinity of the organoid. A large background ROI was used to investigate the flow effects in other areas (Fig.4 blue).
Directly after injection an 8% signal increase was observed in the background (Fig.5a, blue). This can be explained by the 0.2mL of buffer added by the injection (~10% of sample volume). On top of that we also observed a more gradual increase peaking at 10%. Surprisingly, the signal in the organoid increased twice as much (Fig.5a, green). Most likely a partial volume effect due to changes in buffer to tissue ratio combined with a change in organoid orientation.
More interesting are the relative signal changes following injection (Fig. 5b). The organoid (green) and its surrounding control ROI (red), did not show any non-linear flow-related signal change. After linear detrending ~3min of increased signal (~0.5%) was observed in the organoid (Fig. 5c), about 3x larger than the 0.1-0.2% signal change observed by Toi et al in mice1. Adding KCl is expected to create unnaturally strong activation, ultimately leading to a toxic environment and cell death after several minutes of intense activation. So, a significantly larger signal change may not be unreasonable.
Outlook and Conclusion
We did not yet perform concurrent optical measurements to independently assess neuronal activity during MRI. Nevertheless, the observed window of increased signal is tantalizing and closely matches neuronal activity increases measured on MEAs. In the absence of a vascular system any change in signal following trends in neuronal activation must be non-hemodynamic in nature.Work is underway to use dual opsins (GtARC2 and Chrimson7, 490 and 600nm respectively) to stimulate or inhibit neuronal firing during MRI, and independently record Ca2+ activity via the genetically encoded calcium sensor GCaMP68 or electrodes. In parallel, a second injection stage is in preparation to enable controlled release of chemical activators. In addition to KCl, our organoids contain genetically encoded Designer Receptors Exclusively Activated by Designer Drugs (DREADDs) with dual excitation and inhibition9, which allows controlled neuronal activation using clozapine N-oxide and inhibition using salvinorin-B.
Acknowledgements
This work was supported by Australian Research Council (ARC) Future fellowship grant FT200100329. In addition, the authors acknowledge the facilities of the National Imaging Facility at the Centre for Advanced Imaging.References
- Toi, P.T., et al., In vivo direct imaging of neuronal activity at high temporospatial resolution. Science, 2022. 378(6616): p. 160-168.
- Shaker, M.R., et al., Rapid and Efficient Generation of Myelinating Human Oligodendrocytes in Organoids. Frontiers in Cellular Neuroscience, 2021. 15.
- Shaker, M.R., Z.L. Hunter, and E.J. Wolvetang, Robust and Highly Reproducible Generation of Cortical Brain Organoids for Modelling Brain Neuronal Senescence In Vitro. J Vis Exp, 2022(183).
- Le Bihan, Denis, et al. "Direct and fast detection of neuronal activation in the human brain with diffusion MRI." Proceedings of the National Academy of Sciences 103.21 (2006): 8263-8268.
- Silva, Afonso C., and Alan P. Koretsky. "Laminar specificity of functional MRI onset times during somatosensory stimulation in rat." Proceedings of the National Academy of Sciences99.23 (2002): 15182-15187.
- Yushkevich, P.A., et al., User-guided 3D active contour segmentation of anatomical structures: significantly improved efficiency and reliability. Neuroimage, 2006. 31(3): p. 1116-28.
- Vierock, J., et al., BiPOLES is an optogenetic tool developed for bidirectional dual-color control of neurons. Nature Communications, 2021. 12(1): p. 4527.
- Chen, T.-W., et al., Ultrasensitive fluorescent proteins for imaging neuronal activity. Nature, 2013. 499(7458): p. 295-300.
- Roth, B.L., DREADDs for Neuroscientists. Neuron, 2016. 89(4): p. 683-94.
Figures
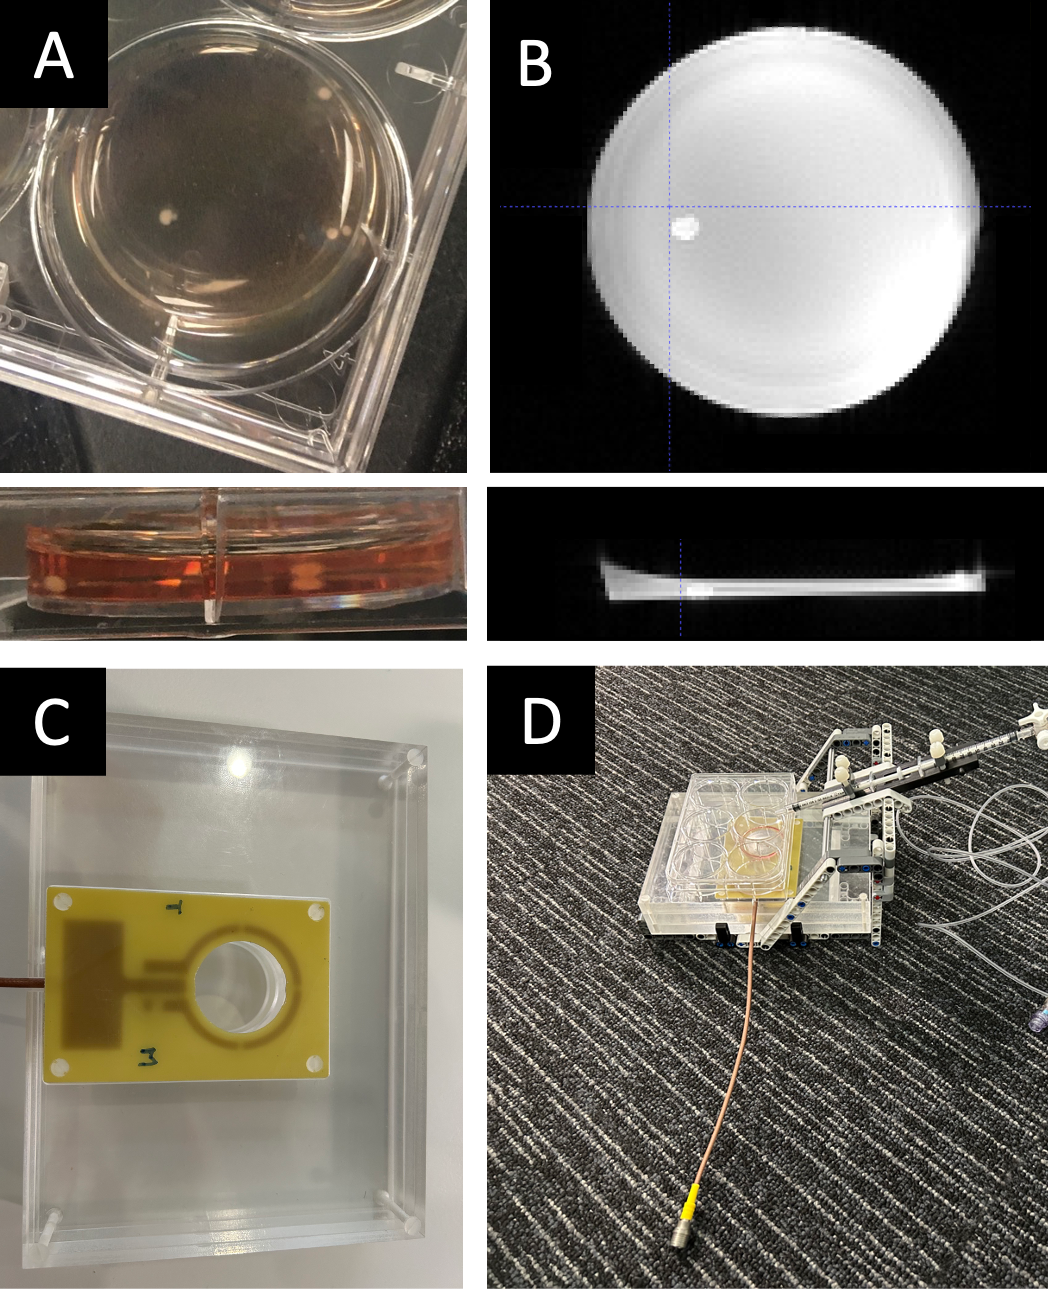
Three month old orgnoid in a 35mm well (A). Three-dimensional MRI image of a three month old organoid (B). Custom build optics platform with integrated coil assembly, optical components can be mound in the base looking though the open centre of the coil (C). Combined coil assembly and custom build pneumatically actuated system to remotely deploy chemicals during the scan (D).
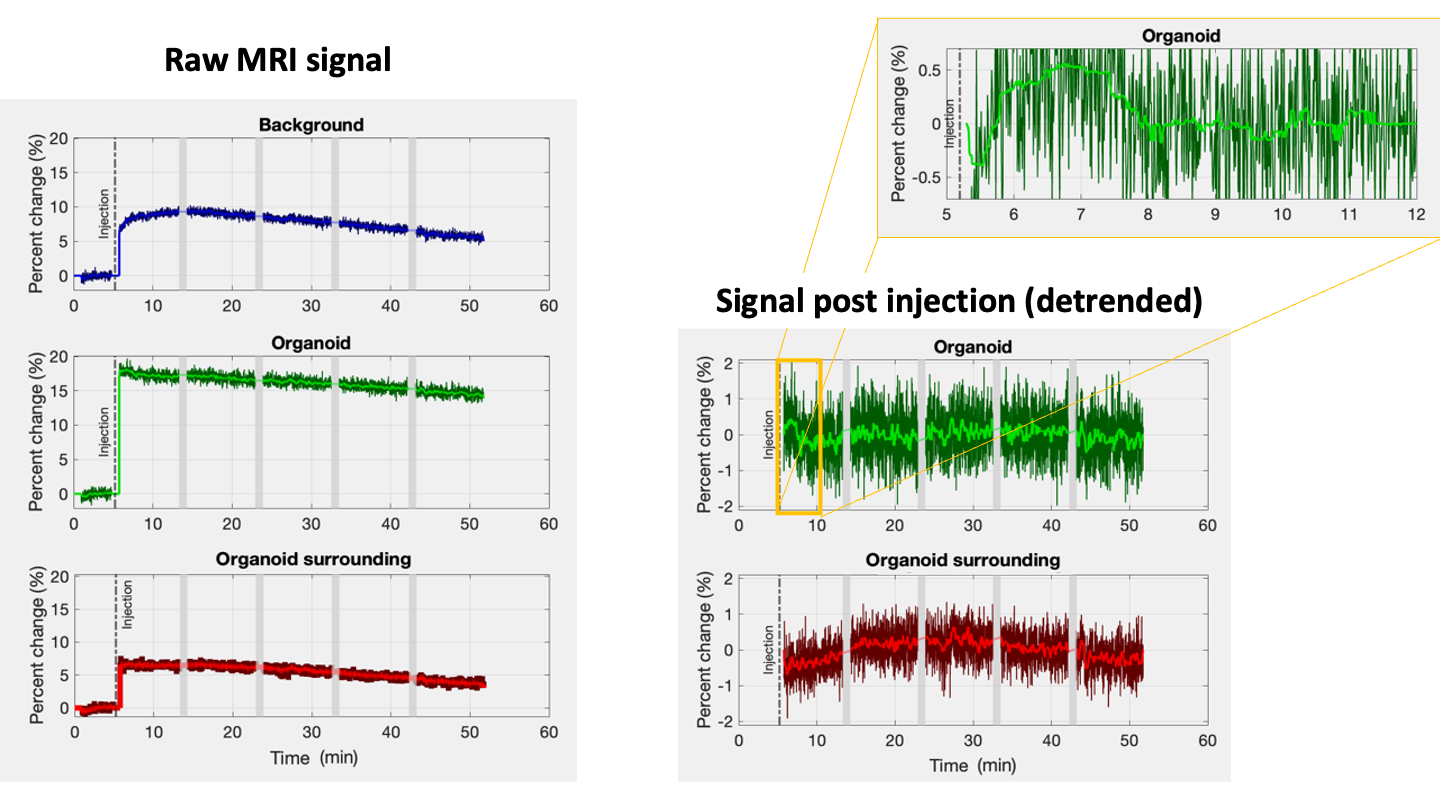
Average spoiled GRE signals measured in each of the ROI. The dark colours in the plots on the left represent the raw signal changes in percent. The bright lines indicate the median filtered signal (12s window). The middle column shows the percent signal change post injection after linear detrending. The top right shows the a zoomed in section of the signal measured in the organoid. In this case a 25s median filter was used to obtain the brightly green line. The dark green line shows the unfiltered data.