0915
Observing visually evoked responses in human thalamus and cortex at millisecond temporal resolution: Preliminary study at 3 T1Department of Biomedical Engineering, Sungkyunkwan University, Suwon, Korea, Republic of, 2Department of Intelligent Precision Healthcare Convergence, Sungkyunkwan University, Suwon, Korea, Republic of, 3Division of Biomedical Engineering, Hankuk University of Foreign Studies, Yongin, Korea, Republic of
Synopsis
Keywords: fMRI, Brain
There has been interested in observing neural activity dynamics in humans at high temporospatial resolution using noninvasive neuroimaging. Here, we report preliminary results of direct imaging of neuronal activity (DIANA) in humans at 3T using checkerboard pattern stimulation. The results show sequential temporospatial dynamics of activities in visual and prefrontal areas evoked by checkerboard pattern stimulation with a signal change of 0.1~0.3%. In contrast, DIANA signals were distinct from control experiments compared with checkerboard pattern stimulation ones. Our preliminary observations suggest that DIANA is feasible for human fMRI studies.Introduction
Tracking neural activity propagation in the human brain has long been interesting in exploring the temporospatial dynamics of functional networks. While invasive recordings are only possible for particular patients, noninvasive approaches provide broader horizons for human neuroscience. However, EEG/MEG summated signals typically reflect the temporal dynamics of the brain surface activities. BOLD-fMRI provides high-spatial-resolution brain activity maps, but is limited to seconds resolution. Recently, we proposed direct imaging of neuronal activity (DIANA) for fMRI with milliseconds precision1. DIANA captured neural propagations across the thalamocortical pathways in anesthetized mice. It is time to translate DIANA into human studies. Here, we report preliminary multislice DIANA-fMRI data in humans at 3T using checkerboard pattern stimulation.Methods
Experiment:Three healthy volunteers participated under IRB at Sungkyunkwan University for fMRI scans on Siemens Prisma 3T scanner with a 64-channel coil. Anatomical images were acquired using MPRAGE with TR/TE/TI=2500/2.7/900ms, FA=15o, resolution=1×1×3mm3.
For BOLD-fMRI, 2D EPI with TR/TE=1000/30ms, FA=70o, and resolution=3×3×3mm3 was used to image thalamic, prefrontal, and visual areas (Fig.2A). Checkerboard pattern stimulation at 2 reversals/s via Psychophysics Toolbox2 consisted of 10s pre-stimulation, 10s stimulation, and 20s post-stimulation periods (Fig.2B).
For DIANA-fMRI, a 2D fast line-scan sequence with multislice acquisition (Fig.1) was adapted from ref.1. The time series data for each slice was fully acquired before acquiring data for the next slice. Scan parameters were: TR/TE=5/2ms, FA=5o, FOV=192×174, matrix=64×58, and resolution=3×3×3mm3. RF spoiling, dummy scans (10s), and GRAPPA (R=2, 18 reference lines) were used (Fig.3A). With time series of 100 images, scan time was 19s/slice. The time series consisted of 100ms (20TRs) pre-stimulation and 400ms (80TRs) stimulation/post-stimulation period. Similar to visually evoked potentials (VEPs) measurement, the checkerboard pattern was repeatedly flickered 2 reversals every 500ms after 100ms pre-stimulation period with a fixed cross on gray background. Thus, the last 100ms of the previous interstimulus interval will be the pre-stimulation period for the next one (Fig.3B). As a control, only a cross fixed on a blank gray background was presented during the scan.
Data analysis:
Data analyses were performed using Matlab, AFNI3, FSL4, and ANTs5. Brain parcellation was Eickhoff-Zilles maximum probability map (MPM) atlas6,7.
For BOLD data (5 trials/subject), after correcting motion and slice timing, trial data were averaged for co-registration/normalization via a transformation matrix of anatomical images to the MNI template. The first five images were discarded before preprocessing: detrending and spatial smoothing (FWHM=3mm) (Fig.2C).
For DIANA data (4 trials/subject), co-registration/normalization of motion-corrected trials’ average data to the MNI template was the same as in BOLD data. It yielded a transformation matrix so that trials were normalized to the template. (Fig.3C). Preprocessing was detrending, bandpass filtering (2-25Hz), and spatial smoothing (FWHM=9mm). A moving mean temporal smoothing (7-9 points) was applied to each subject’s averaged time series to identify the peak latency within the 200ms post-stimulation period. For mapping, a moving mean temporal smoothing (9 points) was applied to each voxel in the preprocessed data before comparing the signal at each time point in the post-stimulation period with baseline (average of pre-stimulation signals) using paired t-test.
Results
As a reference, Fig.3A-B show BOLD time courses for the visual thalamus (Vis), primary/secondary visual cortex (V1/V2), prefrontal thalamus (Pre), and primary/secondary prefrontal cortex (Fp1/Fp2) (n=3 subjects) during pattern stimulation. Fig.3C shows group-averaged BOLD activation maps for three adjacent slices.Fig.5A shows the DIANA time series for Vis, V1, and V2 (n=3 subjects) with the main lobe of 0.1~0.3% signal changes within 200ms after pattern stimulus onset, and their peak latencies as 78.33±8.82, 95.00±17.56, and 93.33±18.56ms, respectively. Similarly, Fig.5B shows the DIANA time series and the peak latencies for Pre (68.33±8.82ms), Fp1 (101.67±14.81ms), and Fp2 (90.00±22.55ms). Fig.5C exhibits statistically significant temporospatial distributions of activations in thalami and cortices for a 150ms post-stimulation period. In contrast, signals in the blank condition show responses distinct from Fig.5A-C in both time series and maps (Fig.5D-F). As another control, the time series of ROIs extracted from inactivated areas in pattern and blank conditions show small signal change percentages (Fig.5G), similar to the range of baseline fluctuation in the time series of activated visual and prefrontal areas. These observations seem to imply that responses in the visual and prefrontal areas in Fig.5A-C come from neuronal activities evoked by pattern stimulation.
Discussion
In this preliminary study, we demonstrated human DIANA-fMRI at 3T using the checkerboard pattern stimulation paradigm as used in VEPs measurements, showing sequential activations in the order of Vis and V1/V2 as well as Pre and Fp1/Fp2. The signal changes of 0.1~0.3% in the human brain at 3T agreed with our previous estimation1. The first peak latency of Vis as ~70ms was similar to the previous observations in monkeys8,9 (30~70ms). Also, the latencies of V1/V2 as 90~100ms were typically observed in monkey8,10,11 and human12. Interestingly, we found that response latency in Pre was significantly earlier than in Vis, which might be coming from the earlier prefrontal perception than the visual one, as found in the previous studies13,14. Although further studies are needed, our preliminary results suggest that DIANA at millisecond precision seems feasible to work in the human 3T MRI system to track neural activity.Acknowledgements
This work was supported by NRF-2019M3C7A1031993.References
1. Toi, P. T. et al. In vivo direct imaging of neuronal activity at high temporospatial resolution. Science 378, 160–168 (2022).
2. Brainard, D. H. The Psychophysics Toolbox. Spat. Vis. 10, 433–436 (1997).
3. Cox, R. W. AFNI: Software for Analysis and Visualization of Functional Magnetic Resonance Neuroimages. Comput. Biomed. Res. 29, 162–173 (1996).
4. Smith, S. M. et al. Advances in functional and structural MR image analysis and implementation as FSL. Neuroimage 23, S208–S219 (2004).
5. Avants, B. B. et al. A reproducible evaluation of ANTs similarity metric performance in brain image registration. Neuroimage 54, 2033–2044 (2011).
6. Eickhoff, S. B. et al. A new SPM toolbox for combining probabilistic cytoarchitectonic maps and functional imaging data. Neuroimage 25, 1325–1335 (2005).
7. Amunts, K., Mohlberg, H., Bludau, S. & Zilles, K. Julich-Brain: A 3D probabilistic atlas of the human brain’s cytoarchitecture. Science 369, 988–992 (2020).
8. Schmolesky, M. T. et al. Signal Timing Across the Macaque Visual System. J. Neurophysiol. 79, 3272–3278 (1998).
9. Maunsell, J. H. R. et al. Visual response latencies of magnocellular and parvocellular LGN neurons in macaque monkeys. Vis. Neurosci. 16, 1–14 (1999).
10. Raiguel, S. E., Lagae, L., Gulyàs, B. & Orban, G. A. Response latencies of visual cells in macaque areas V1, V2 and V5. Brain Res. 493, 155–159 (1989).
11. Nowak, L. G., Munk, M. H. J., Girard, P. & Bullier, J. Visual latencies in areas V1 and V2 of the macaque monkey. Vis. Neurosci. 12, 371–384 (1995).
12. Self, M. W. et al. The Effects of Context and Attention on Spiking Activity in Human Early Visual Cortex. PLoS Biol. 14, e1002420 (2016).
13. Griffiths, B. J. et al. Rhythmic interactions between the mediodorsal thalamus and prefrontal cortex precede human visual perception. Nat. Commun. 13, 3736 (2022).
14. Gregoriou, G. G., Gotts, S. J., Zhou, H. & Desimone, R. High-Frequency, Long-Range Coupling Between Prefrontal and Visual Cortex During Attention. Science 324, 1207–1210 (2009).
Figures
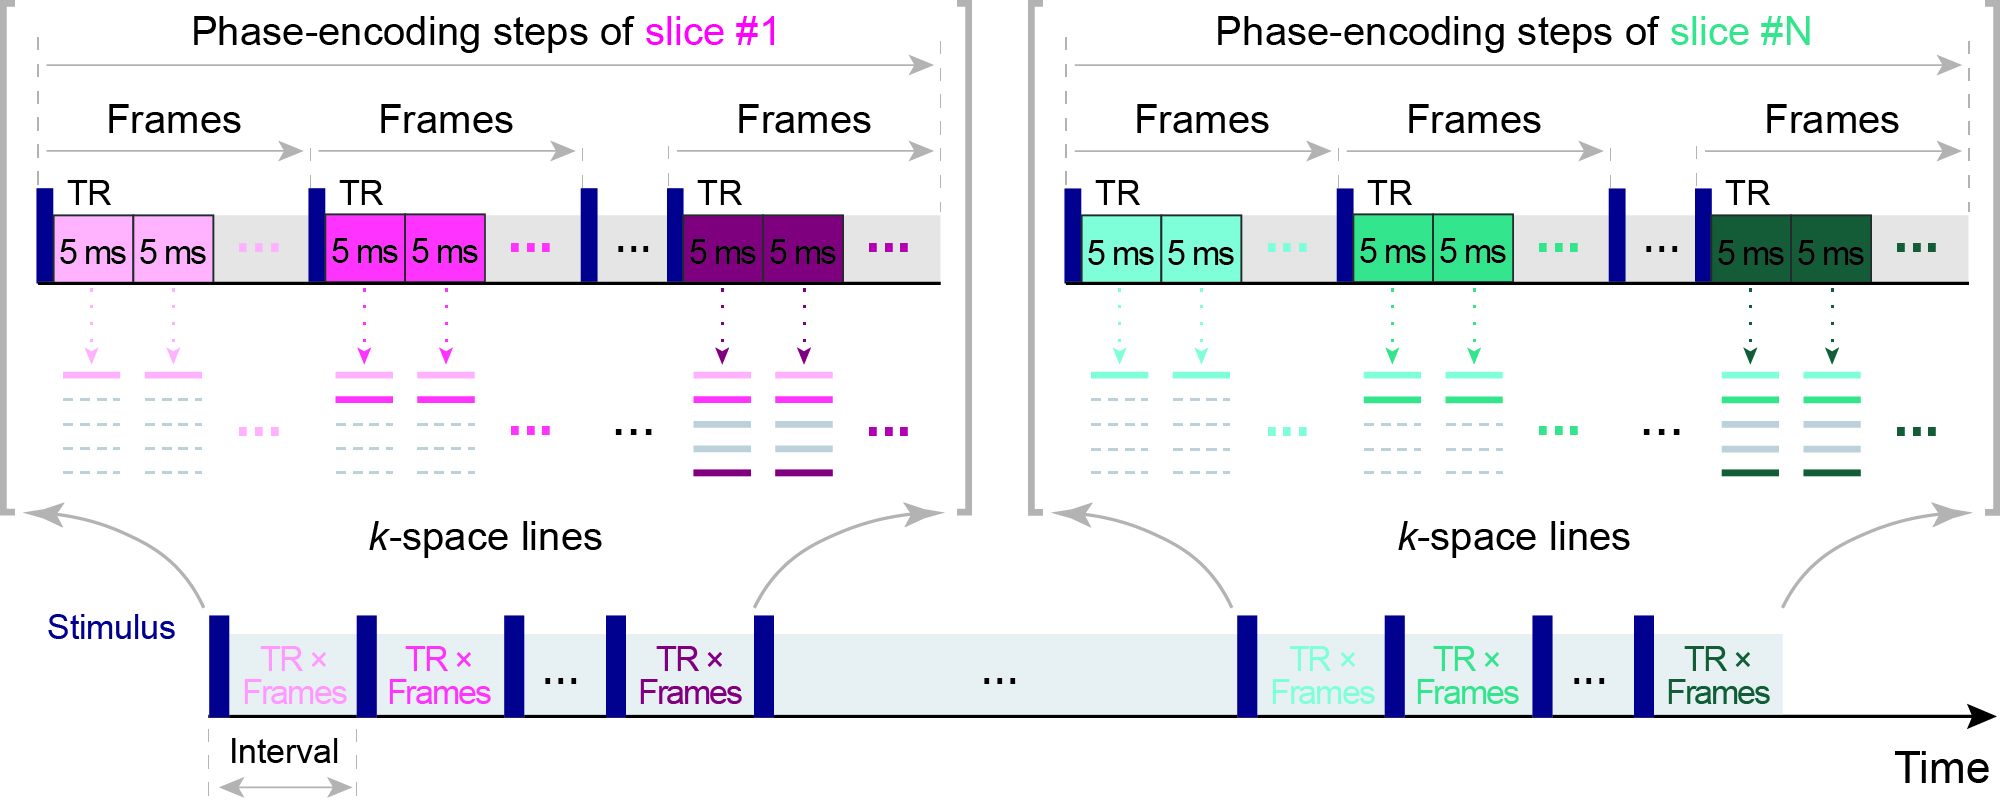
Fig. 1. 2D fast line-scan scheme for multislice acquisition. In each slice, the same k-space line is acquired for every image in the time series before the next lines are acquired. Thus, the designated and actual scanned time series length is the same. Because if slice loops are inserted into every k-space line time series, the actual scanned time series length will be equivalent to the designated time series length multiplied by the number of slices.
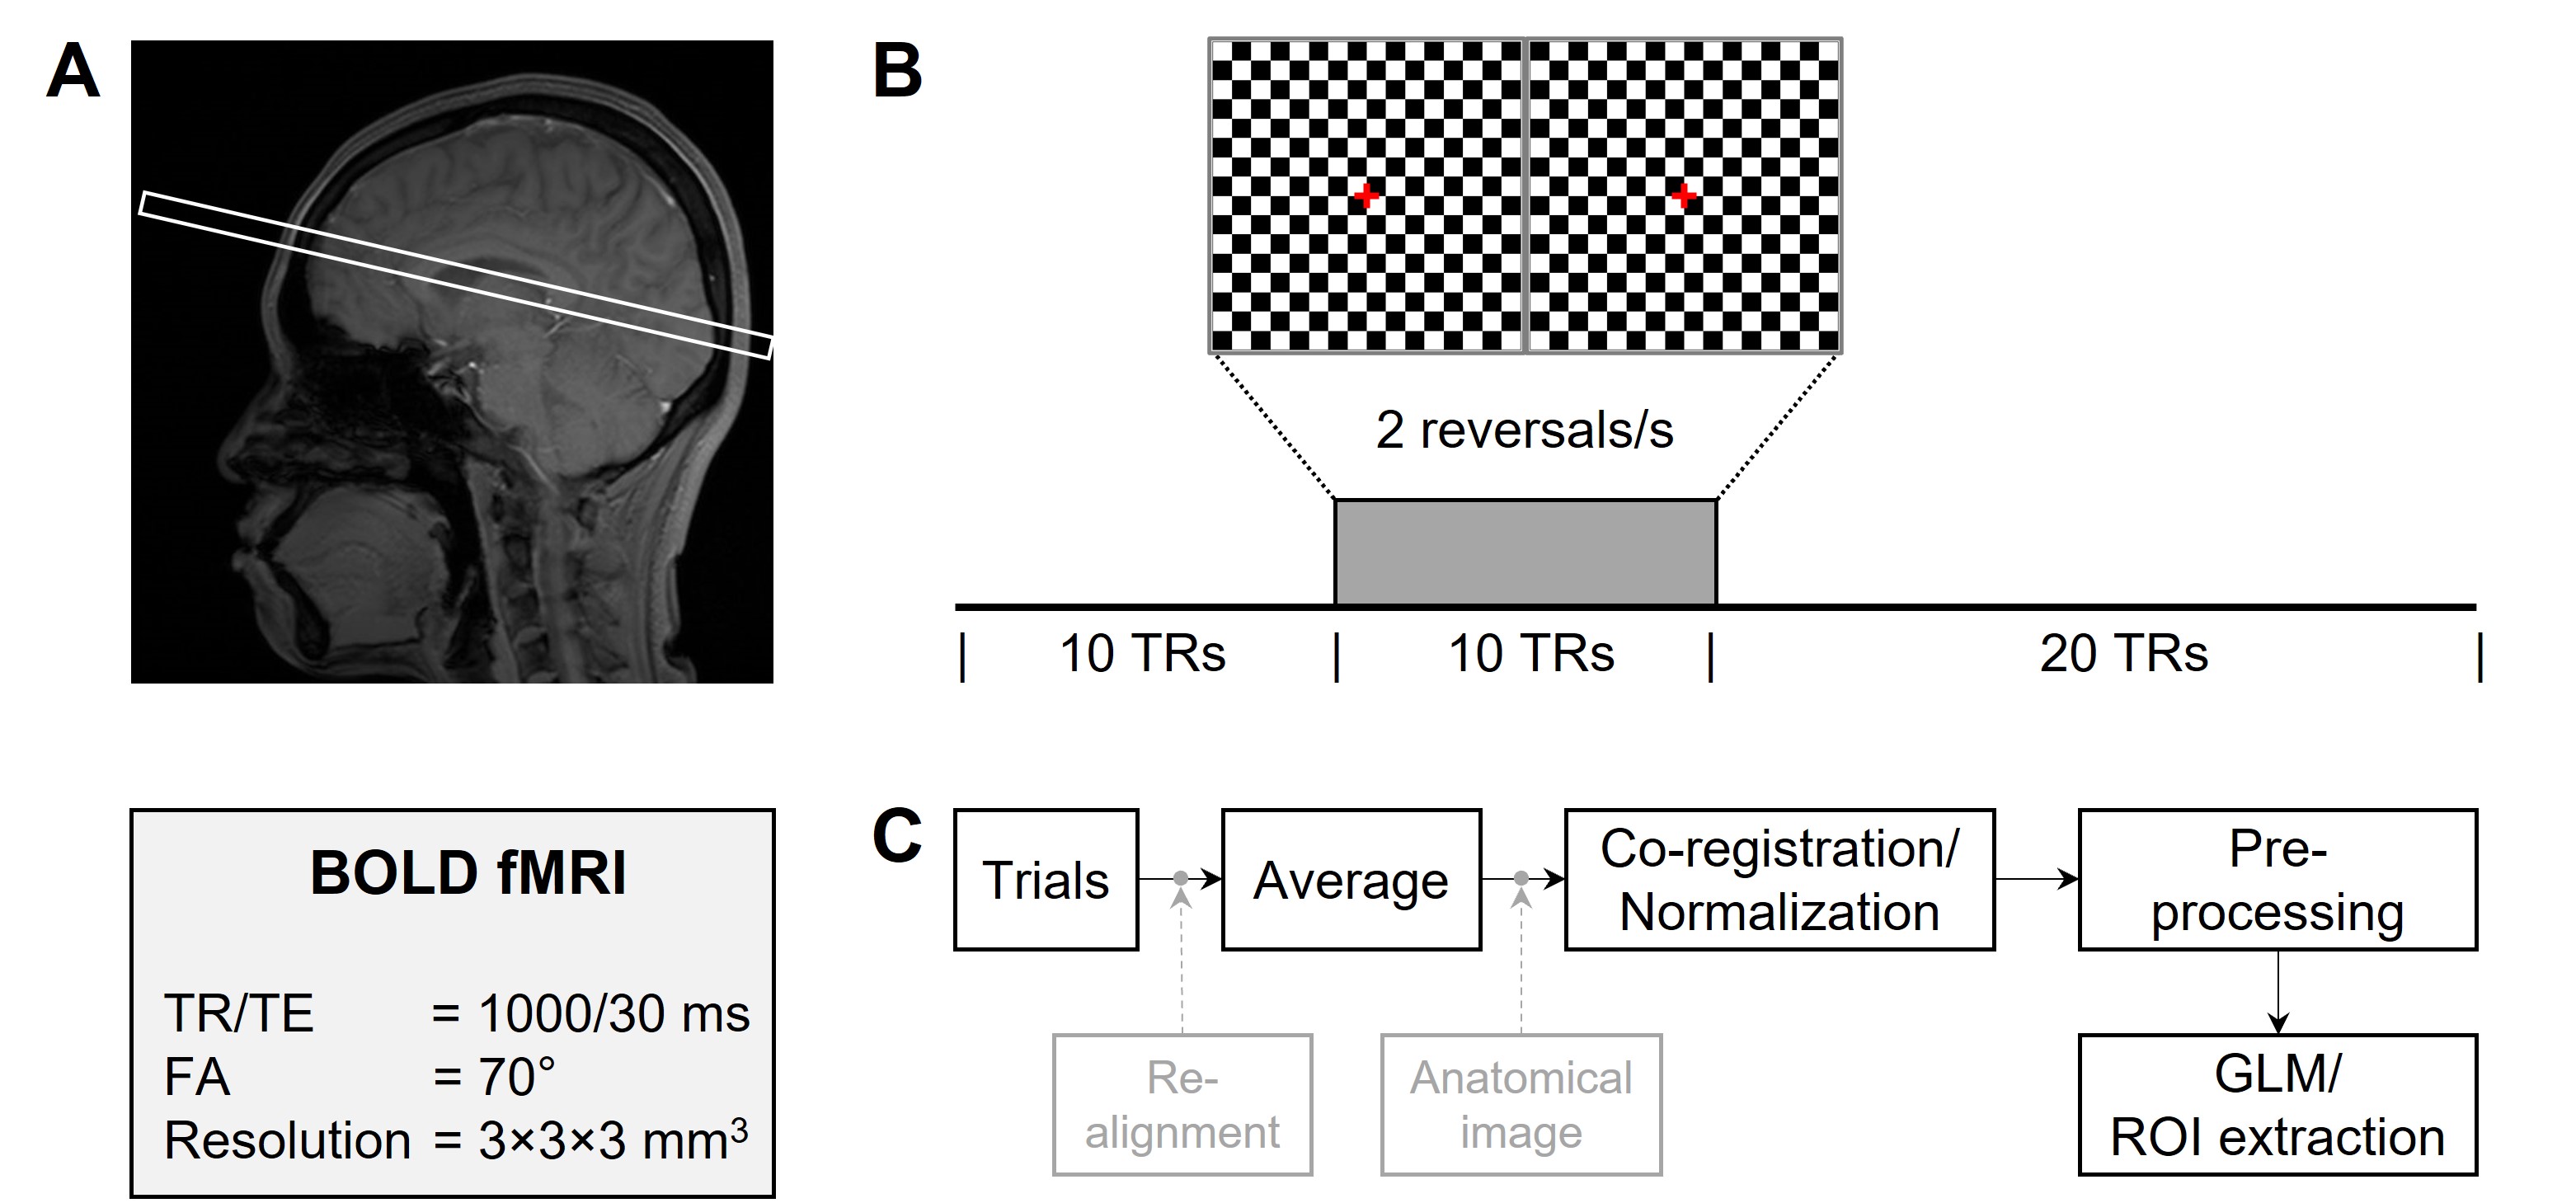
Fig. 2. BOLD-fMRI experiment and data analysis. (A-B) Imaging region and scan parameters (A) and checkerboard pattern stimulation paradigm (B) used in BOLD-fMRI experiment. (C) Co-registration/normalization and processing steps for BOLD data.
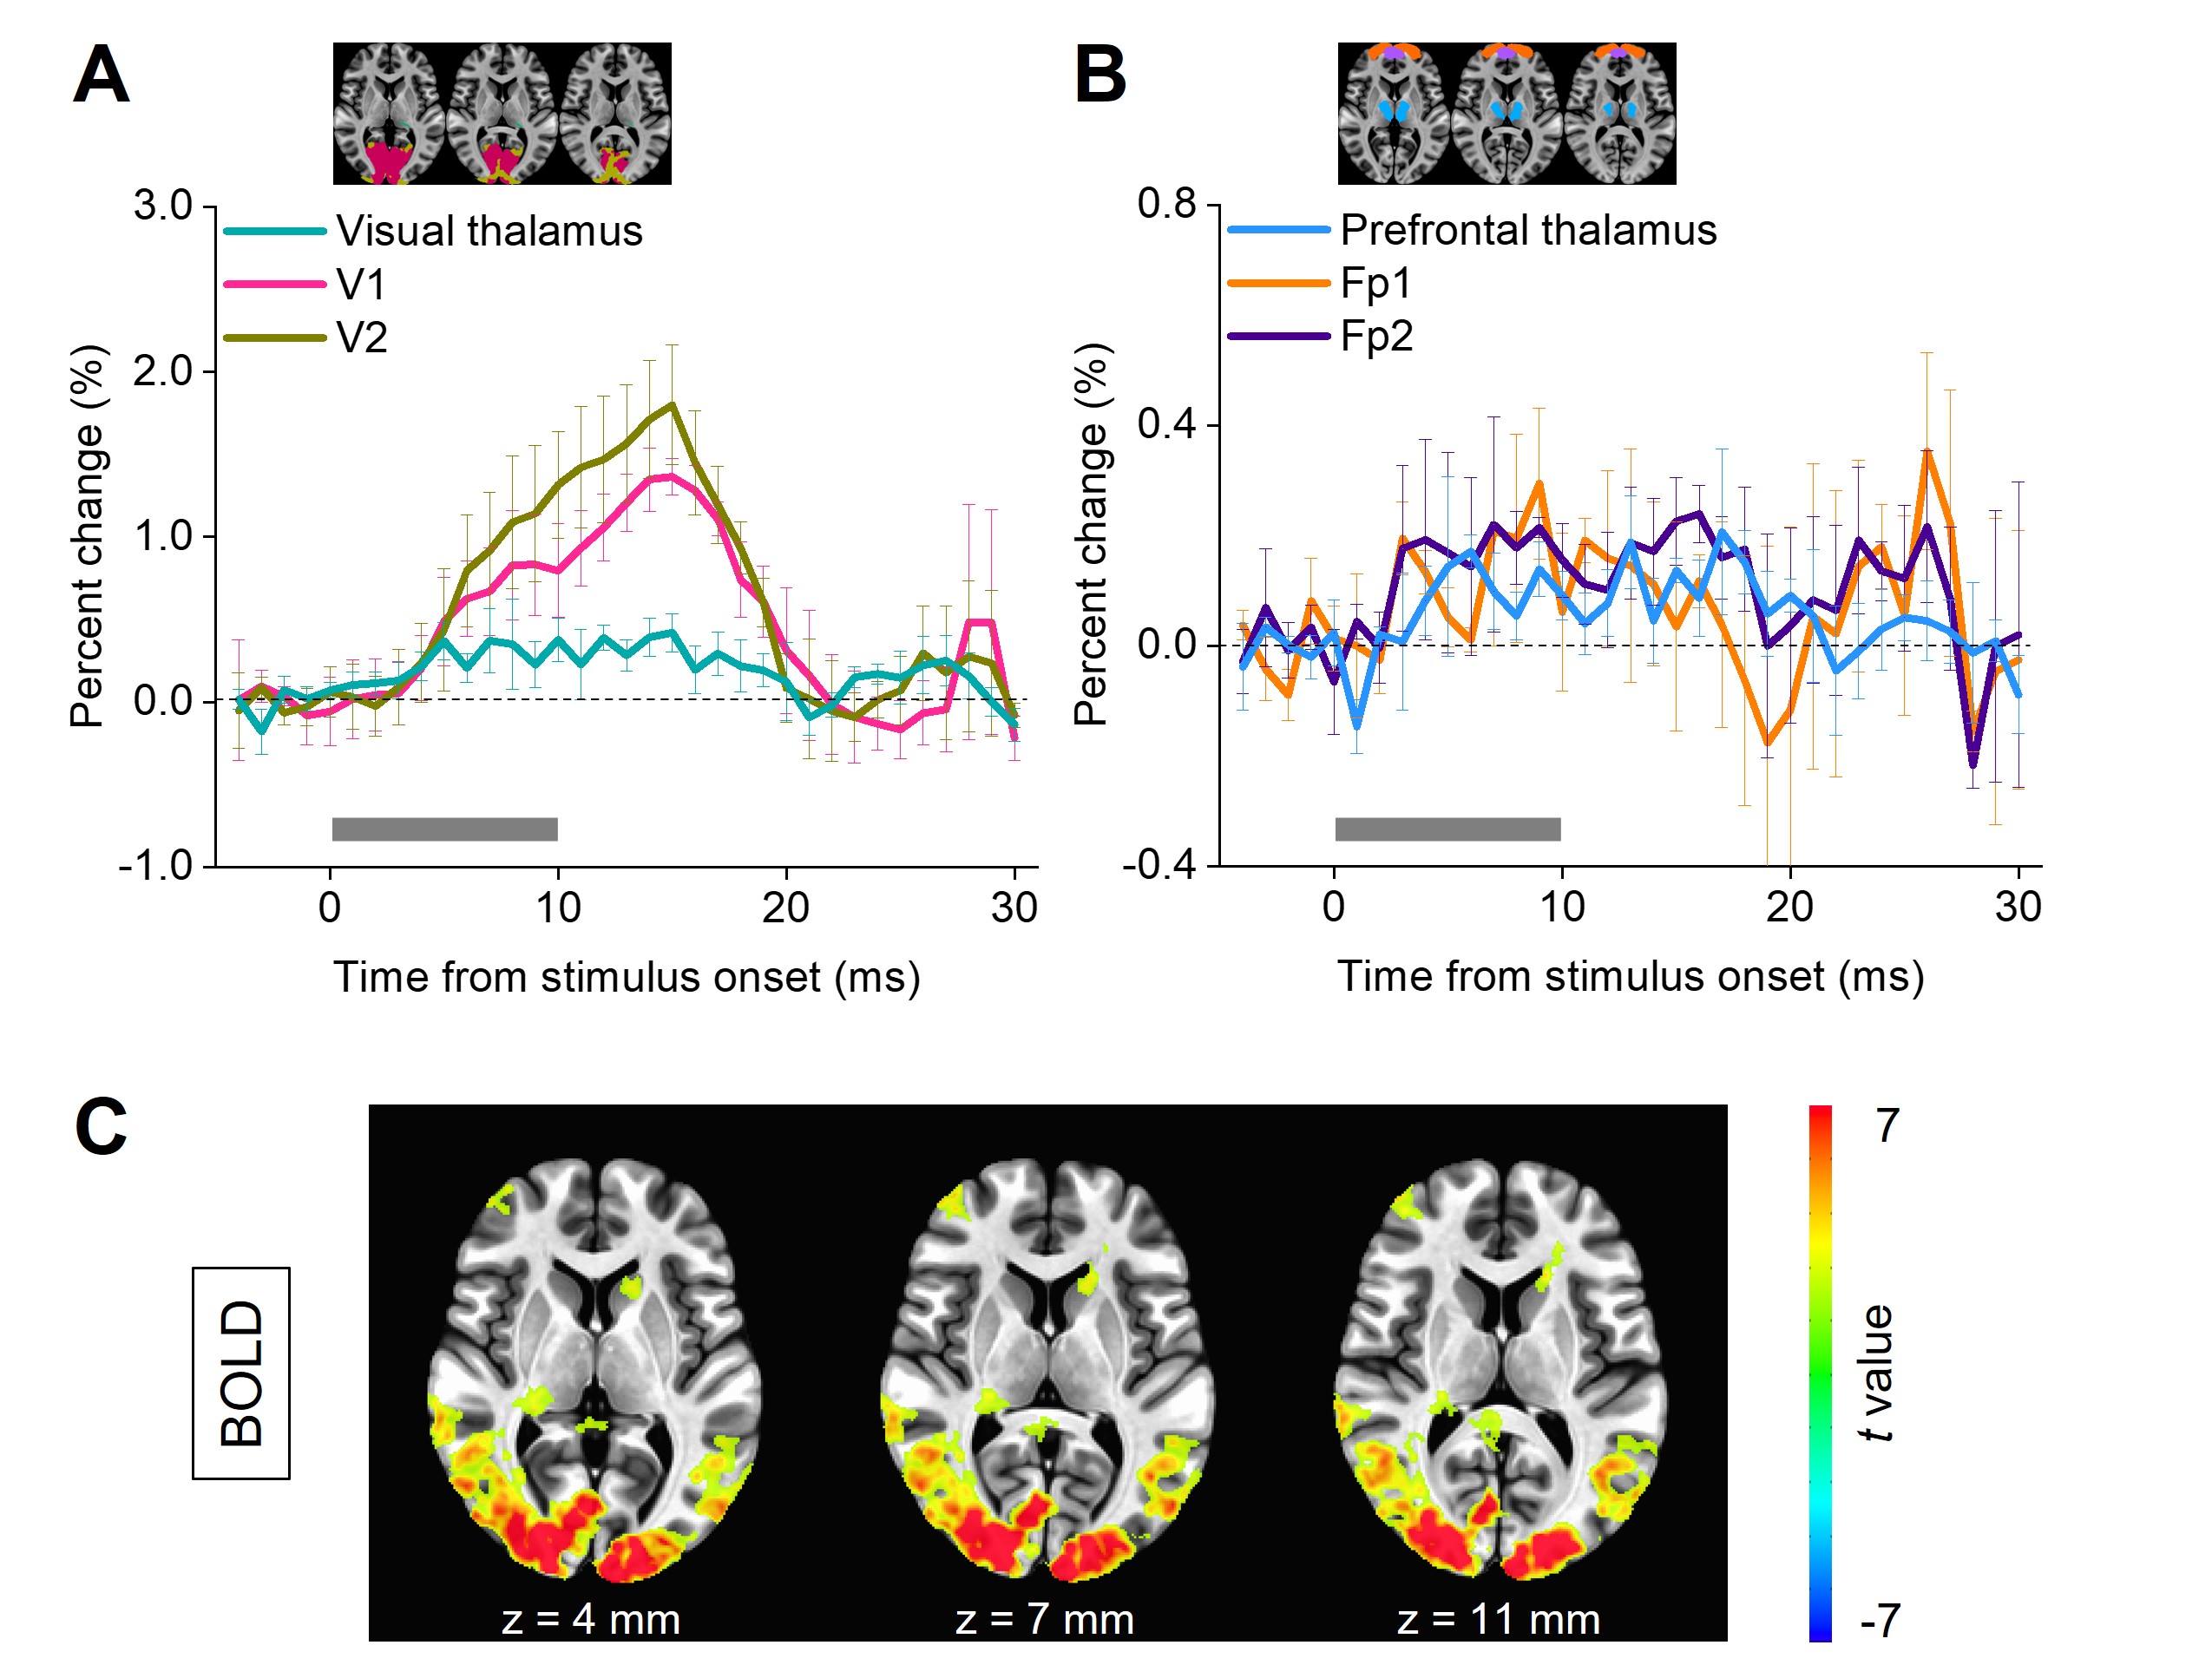
Fig. 3. BOLD activation with checkerboard pattern stimulation for reference. (A-B) Time courses of visual thalamus, primary/secondary visual cortex (V1/V2) (A); and prefrontal thalamus, primary/secondary prefrontal cortex (Fp1/Fp2) (B) (n=3 subjects). Subfigures show the ROI definition. Gray bars indicate the stimulation period. (C) Group-averaged activation map (one-sample t-test) showing the activation of the thalamus, visual and prefrontal cortex.
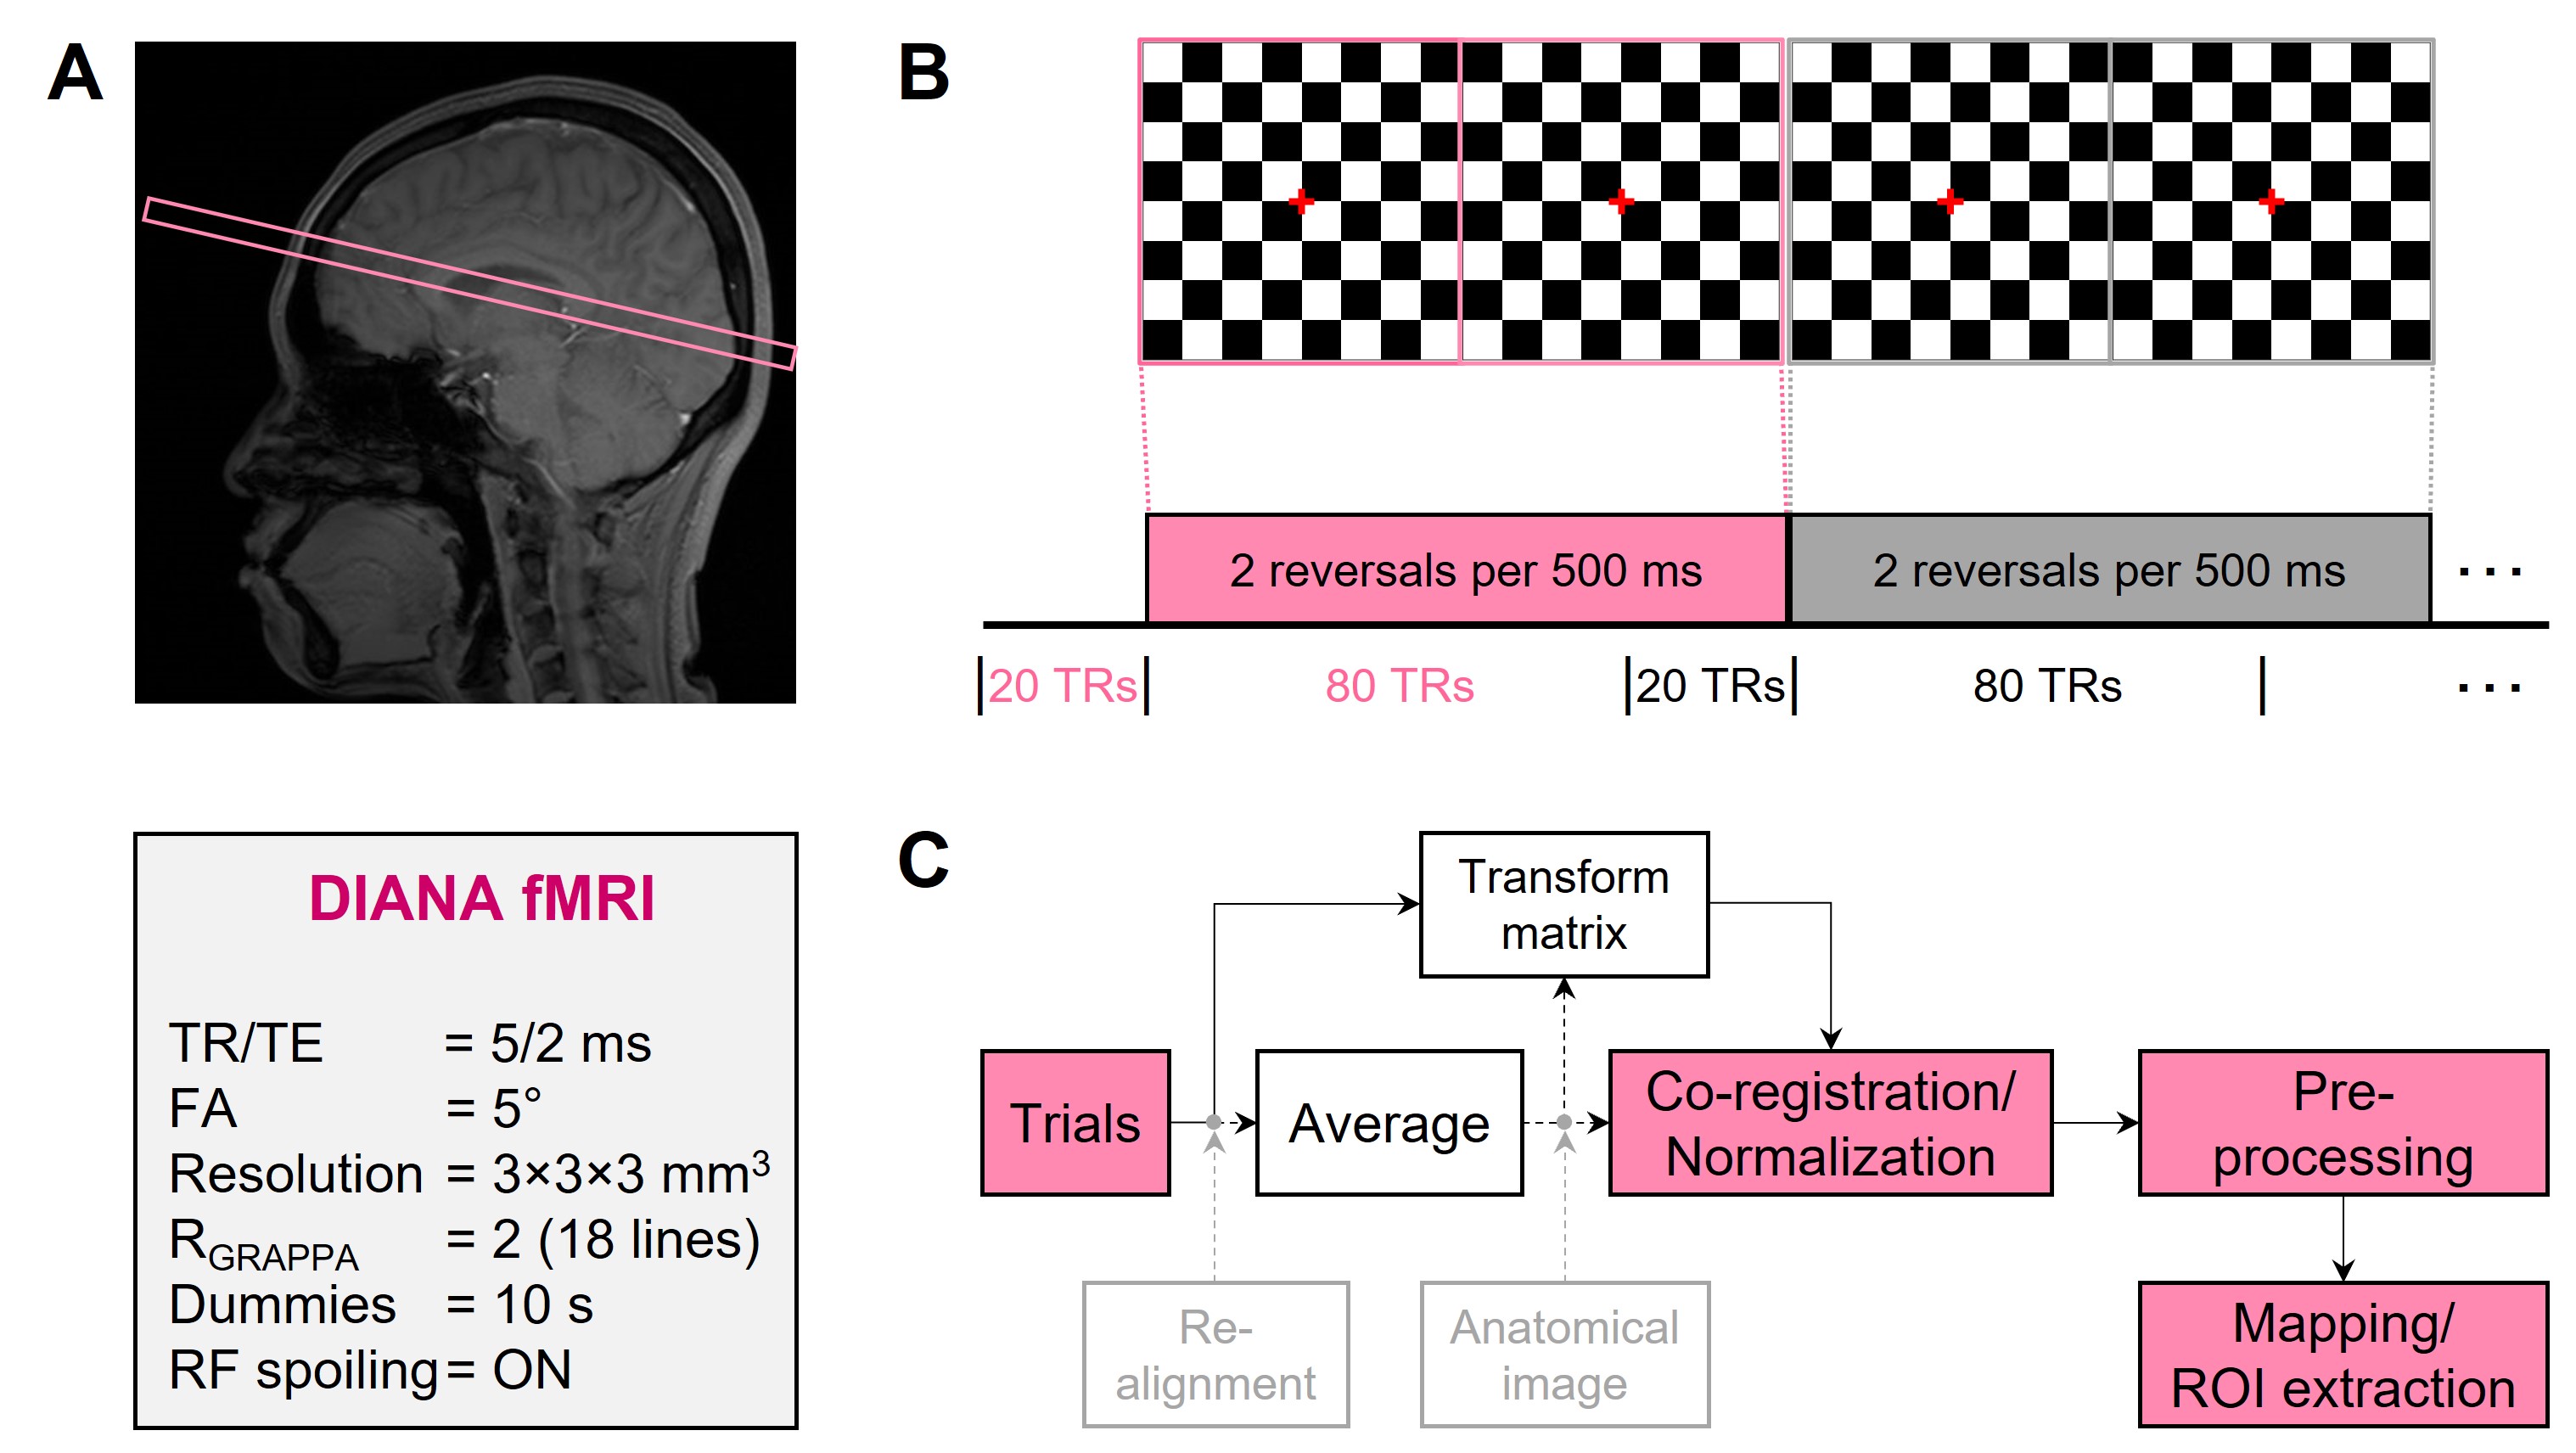
Fig. 4. DIANA-fMRI experiment and data analysis. (A-B) Imaging region and scan parameters (A) and checkerboard pattern stimulation paradigm (B) used in DIANA-fMRI experiment. (C) Co-registration/normalization and processing steps for DIANA data.
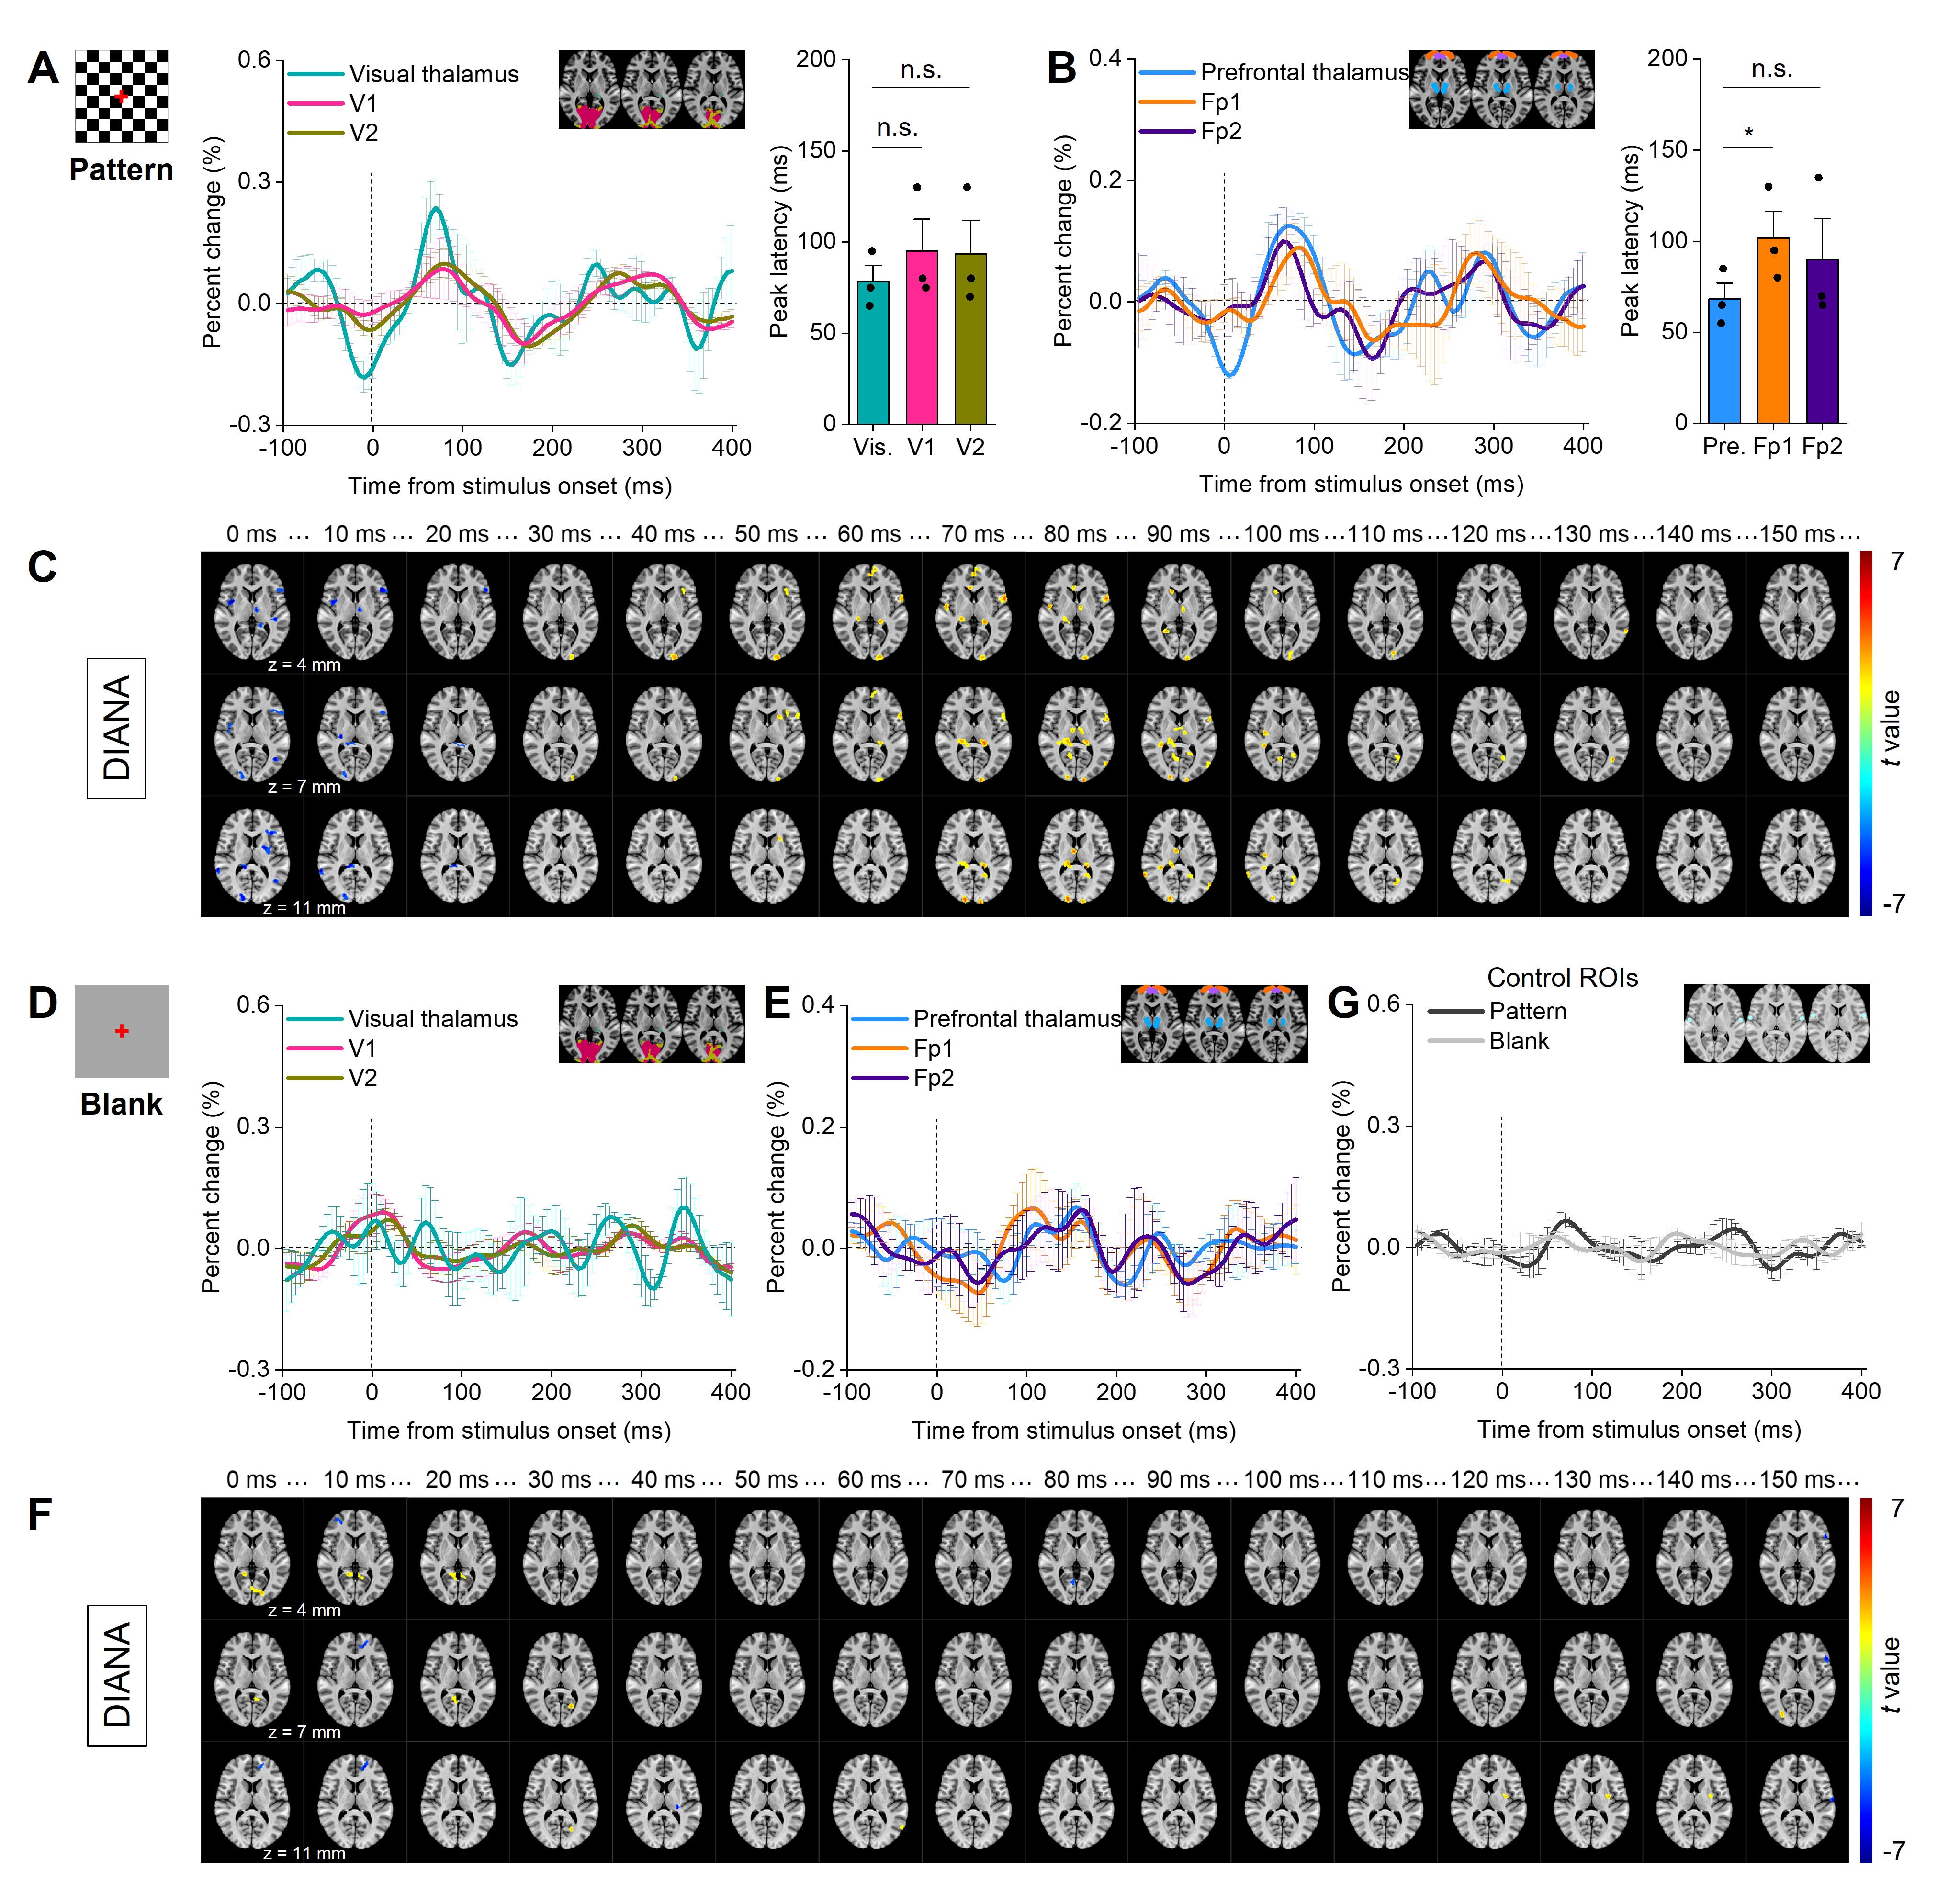
Fig. 5. DIANA responses with pattern and blank stimuli. (A-B) Time series of visual thalamus, V1, V2 (A, left), and their peak latencies (A, right); and prefrontal thalamus, Fp1, Fp2 (B, left), and their peak latencies (B, right) with the pattern. (C) t-value map every 10ms for 150ms period (12 trials from n=3 subjects, p < 0.01, cluster > 50 voxels). (D-F) The same as (A-C) but with blank in the same subjects. (G) Time series of control ROIs in pattern and blank conditions. *p<0.05, n.s.:p>0.05 for paired t-test.