0913
MT imaging at 0.55T with GRE and bSSFP1Biomedical Engineering & Imaging Sciences, King's College London, London, United Kingdom, 2MR Research Collaborations, Siemens Healthcare, Frimley, United Kingdom, 3Centre for the Developing Brain, King's College London, London, United Kingdom, 4Department of Neuroimaging, King's College London, London, United Kingdom
Synopsis
Keywords: Magnetization transfer, Magnetization transfer, Low-Field MRI
We used multiband pulses to obtain Magnetization Transfer (MT) weighted images at 0.55T in a time-efficient manner. White Matter (WM)/Grey Matter (GM) contrast is compared across several flip-angles for both GRE and bSSFP sequences. GRE showed larger MTR WM/GM difference but after accounting for signal-to-noise ratio bSSFP had 50% better contrast-to-noise ratio.Introduction
Low-field MRI brings new opportunities in interventional and diagnostic imaging1. Despite lower signal-to-noise ratio (SNR), longitudinal magnetization recovers faster (shorter T1) while longer T2 values means signal can be measured for longer2. This is particularly beneficial for bSSFP whose signal amplitude is T2/T1-weighted3 but also for GRE. Another advantage of low field-strength is lower specific absorption rate (SAR) which allows higher root mean square $$$\mathrm{B_1^+}$$$ amplitude. This is beneficial for Magnetization Transfer (MT) imaging which uses high power pulses to saturate semisolid magnetization and thus generate MT contrast. Here we exploit these advantages to demonstrate high Contrast-to-Noise MTR imaging with GRE and bSSFP at 0.55T.Methods
Magnetization Transfer Ratio (MTR) maps were acquired for the brain over two scanning sessions on the same healthy volunteer at a clinical 0.55T system (MAGNETOM Free.Max, Siemens Healthineers, Erlangen, Germany) using a 6-channel head coil. 3D GRE and bSSFP sequences were acquired in combination with non-selective multiband (MB) pulses to simultaneously excite the free-water magnetization and saturate the semisolid magnetization4 (Figure 1) – i.e. the pulses were not used for spatial encoding, only for contrast generation. These pulses offer an efficient means for generating MT contrast within rapid gradient echo sequences5.Both GRE and bSSFP had identical settings (cartesian encoding, sagittal orientation, $$$\mathrm{2mm}$$$ isotropic resolution, 3 averages, $$$\mathrm{TE=3.6ms}$$$, $$$\mathrm{BW_{pixel}=429Hz}$$$) with exception of the TR ($$$ \mathrm{TR_{GRE}=7.96ms/TR_{bSSFP}=7.19ms}$$$) but resulting in very similar acquisition times per volume ($$$ \mathrm{T_{acq,GRE}=4m59s/T_{acq,bSSFP}=4m53s}$$$). To investigate the contrast dependence on the flip angle, GRE and bSSFP were acquired using several flip angles: $$$\mathrm{\alpha_{GRE}=\{5^\circ,10^\circ,15^\circ,20^\circ,25^\circ\}}$$$ and $$$\mathrm{\alpha_{bSSFP}=\{10^\circ,20^\circ,30^\circ,40^\circ,50^\circ,60^\circ\}}$$$.
MTRs were measured by acquiring images with either a single band (SB) pulse used only for excitation, or a MB pulse containing both the on-resonance excitation and off-resonance saturation bands (Figure 1). The MB pulse was $$$\mathrm{3ms}$$$ long with its side bands at $$$\mathrm{\pm3kHz}$$$, used a Gaussian envelope ($$$\mathrm{TBP=2.26}$$$) and was designed to achieve $$$\mathrm{B_1^{rms}=3.5\mu{}T}$$$. Since the on-resonance band also contributes to $$$\mathrm{B_1^{rms}}$$$ the pulses with lower flip angle employed larger amplitude off-resonance bands than the higher flip angle pulses. The non-MT-weighted volume used a SB pulse with the same duration and TBP. The MTR was calculated using the expression:
$$\mathrm{MTR(\%)=100\times{}\frac{S_{SB}-S_{MB}}{S_{SB}}}\;\;[1]$$
where $$$\mathrm{S_*}$$$ are the signals acquired with the SB and MB pulses.
To compare the contrast across sequences and flip angles, two ROIs were drawn manually (Figure 2A) around white matter (WM) and gray matter (GM) to estimate the MTR. The average $$$\mu{}$$$ and standard deviation $$$\sigma$$$ of MTR were calculated over the ROIs, and the difference $$$\mathrm{\Delta{}MTR}$$$ between WM-GM MTR was calculated:
$$\mathrm{\Delta{}MTR=\mu_{WM}-\mu_{GM}}\;\;[2]$$
To account for differences in SNR, the contrast-to-noise ratio (CNR) was also calculated:
$$\mathrm{CNR=\frac{\Delta{}MTR}{\sqrt{\sigma_{WM}^2+\sigma_{GM}^2}}}\;\;[3]$$
Results
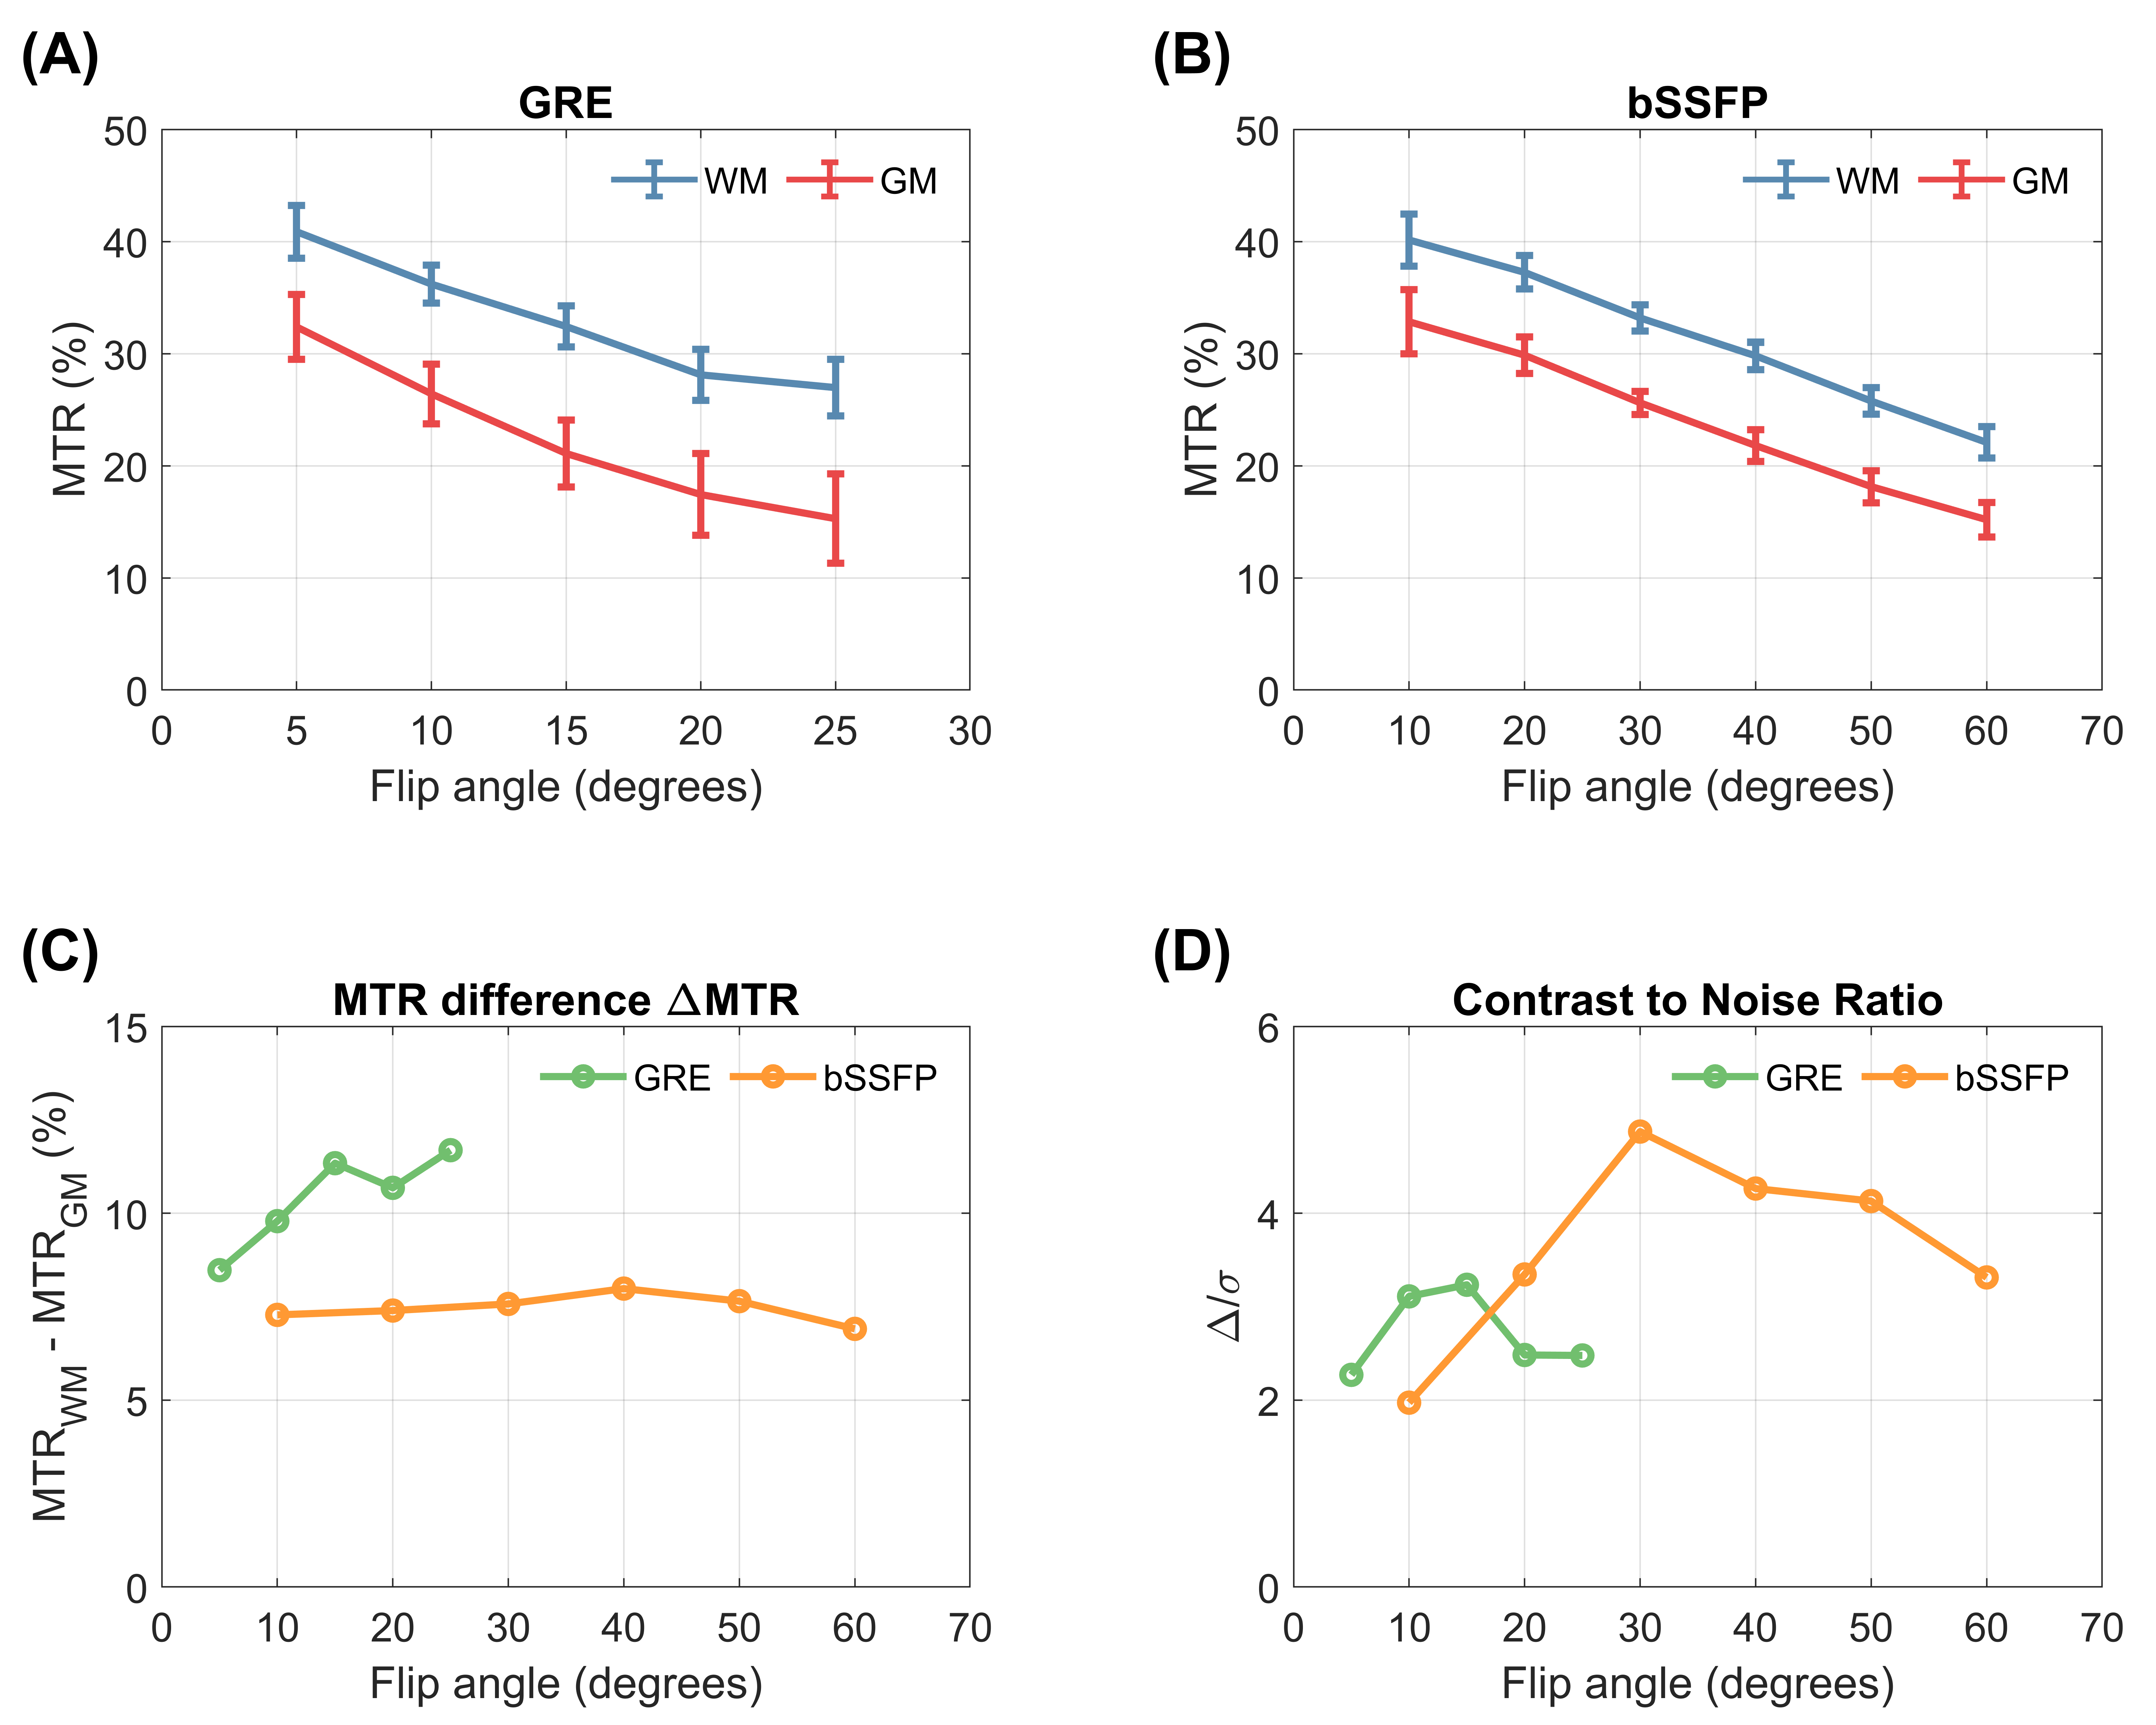
MTR maps acquired with bSSFP and GRE are shown in Figures 3 and 4 respectively. Overall MTR values decreased with increasing flip angles (Figure 5A,B). However, as the flip angle increases the difference in MTR between WM and GM increases substantially for GRE (Figure 5C). When accounting for the SNR the bSSFP has superior WM-GM discernment for an optimal flip angle of $$$30^\circ$$$ ($$$\mathrm{CNR=4.9}$$$), whereas the CNR for GRE is $$$50\%$$$ smaller ($$$\mathrm{CNR=3.2}$$$) for an optimal flip angle of $$$15^\circ$$$.Discussion and Conclusion
In this work MT contrast was achieved by off-resonance saturation with non-selective MB pulses which are a time efficient way to simultaneously excite free-water magnetization and saturate semisolid magnetization. The MB pulses applied a constant $$$\mathrm{B_1^{rms}}$$$ which was maximized to the system limits. Thus, these pulses created a variable amount of off-resonance semisolid saturation across different flip angles as the power is moved from off-resonance to on-resonance with increasing flip angle (Figure 1). Assuming a constant absorption lineshape, the net semisolid saturation induced by the MT-weighted scan is the same at all flip angles, but for the higher flip angles the ‘reference’ image is itself more strongly MT weighted, thus reducing the measured MT ratio.Both GRE and bSSFP showed very uniform MTR maps with virtually no $$$\mathrm{B_1^+}$$$ inhomogeneity and a strong MTR dependence on the flip angle, with smaller MTR for larger flip angles (Figure 5A,B) but difference between WM and GM difference improving for GRE (Figure 5C). However, in terms of CNR bSSFP proved superior to GRE, which was expected given its intrinsic higher SNR. This agrees with previous work on MTR imaging at 0.55T6 where MT contrast was obtained via on-resonance saturation by scaling the pulses amplitude/duration. Independently of the saturation scheme, MT contrast increases with the applied RF power and in this work we found that the maximum achievable $$$\mathrm{B_1^{rms}}$$$ was limited by the hardware and not by SAR constraints. Therefore, there is potential to safely increase MT contrast.
Future work will explore more efficient spatial encoding like spiral7, and other imaging modalities that could benefit from high $$$\mathrm{B_1^+}$$$ fields like inhomogeneous MT8.
Acknowledgements
The research was funded/supported by core funding from the Wellcome/EPSRC Centre for Medical Engineering [WT203148/Z/16/Z] and by the National Institute for Health Research (NIHR) Biomedical Research Centre based at Guy's and St Thomas' NHS Foundation Trust and King's College London and/or the NIHR Clinical Research Facility. The views expressed are those of the author(s) and not necessarily those of the NHS, the NIHR or the Department of Health and Social Care.References
1. Campbell-Washburn, A. E., Ramasawmy, R. & Restivo, M. C. Opportunities in Interventional and Diagnostic Imaging by. Radiology 2–11 (2019).
2. Marques, J. P., Simonis, F. F. J. & Webb, A. G. Low-field MRI: An MR physics perspective. Journal of Magnetic Resonance Imaging 49, 1528–1542 (2019). 3. Bieri, O. & Scheffler, K. Fundamentals of balanced steady state free precession MRI. Journal of Magnetic Resonance Imaging 38, 2–11 (2013).
4. Teixeira, R. P. A. G., Malik, S. J. & Hajnal, J. v. Fast quantitative MRI using controlled saturation magnetization transfer. Magn Reson Med 81, 907–920 (2019).
5. Malik, S. J., Teixeira, R. P. A. G., West, D. J., Wood, T. C. & Hajnal, J. v. Steady-state imaging with inhomogeneous magnetization transfer contrast using multiband radiofrequency pulses. Magn Reson Med 83, 935–949 (2020).
6. Afshari, R., Bauman, G. & Bieri, O. On the Prospects of Magnetization Transfer Imaging at 0.55T. in Proc. Intl. Soc. Mag. Reson. Med. 30 2710 (2022).
7. Restivo, M. C., Ramasawmy, R., Bandettini, W. P., Herzka, D. A. & Campbell-Washburn, A. E. Efficient spiral in-out and EPI balanced steady-state free precession cine imaging using a high-performance 0.55T MRI. Magn Reson Med 84, 2364–2375 (2020).
8. Girard, O. M. et al. Magnetization transfer from inhomogeneously broadened lines (ihMT): Experimental optimization of saturation parameters for human brain imaging at 1.5 Tesla. Magn Reson Med 73, 2111–2121 (2015).
Figures