0910
Quantification of NOE effect and its application on brain tumor detection
Jingyi Yu1, Jian Wu1, Xinli Lan1, Yonggui Yang2, Zhigang Wu3, Congbo Cai1, and Shuhui Cai1
1Department of Electronic Science, Xiamen University, Xiamen, China, 2Department of Radiology, The Second Affiliated Hospital of Xiamen Medical College, Xiamen, China, 3MSC Clinical & Technical Solutions, Philips Healthcare, Shenzhen, China
1Department of Electronic Science, Xiamen University, Xiamen, China, 2Department of Radiology, The Second Affiliated Hospital of Xiamen Medical College, Xiamen, China, 3MSC Clinical & Technical Solutions, Philips Healthcare, Shenzhen, China
Synopsis
Keywords: CEST & MT, Machine Learning/Artificial Intelligence
Chemical exchange saturation transfer (CEST) quantification is mostly based on pixel-wise fitting of Z-spectra, which is time-consuming and noise-sensitive. Herein, we propose an approach to quantify CEST based on U-Net. The proposed method can simultaneously quantify the concentration and the exchange rate of nuclear Overhauser enhancement (NOE), together with the B0 map. The results of a simulation sample and a rat C6 glioma model suggest that the quantification of NOE effect with U-Net is accurate, precise and fast.Introduction
Nuclear Overhauser enhancement (NOE) is a type of chemical exchange saturation transfer (CEST) and it originates from mobile macromolecules.1, 2 NOE weighted maps have shown the potential to grade brain tumors and diagnose benign and malignant tumors by adding them to standard MRI protocols.3 Bloch fitting4 is a widely accepted technique to quantify CEST effects at present. However, it requires costly computation and is not suitable for clinical practice. Glang et al. utilized a fully connected neural network (DeepCEST) to fast quantify CEST effects.5 However, the methods mentioned above are pixel-wise based and may take much time on quantification for large data set. Besides, their quantitative quality is reduced as spatial structural information between voxels is ignored, which deteriorates their ability to smooth noise.6 To improve quantitative quality of NOE parametric maps, a U-Net with skip connections is proposed in this work.Methods
CEST images: MRI scans on a rat C6 glioma model were conducted on a 7.0T MR scanner. Detailed acquisition protocol is as follows: Saturation power = 1.5 µT, saturation time = 2 s, frequency offsets of the Z-spectra ranging from -4.35 to 1.35 ppm with a total offset number of 39, spin-echo EPI sequence with 30 mm × 30 mm field of view, 3 mm slice sickness, TE/TR = 26.57/4000 ms, matrix = 64 × 64.Training data: As shown in Figure 1a, data for U-Net training were generated with MATLAB using the Bloch equations, and various imperfect situations including B0 inhomogeneity and Rician noise were considered.5 The variance of Rician noise (σ2) for training data was 0.0083. The saturation power, saturation time and range of frequency offsets were the same as parameters used for rat data. At the training stage, data were randomly split to two parts: 1000 samples for training and 100 for validation. A simulation sample was generated in the same way and different levels of Rician noise were considered (σ2 = 0.0083, 0.01, 0.0125, 0.0167, 0.0250, 0.0333, 0.0500 for level 1 to level 7).
Quantitative experiments: Bloch fitting4, FCN5 and U-Net were used to obtain NOE concentration and exchange rate, and B0 maps for comparison. The Bloch equations were applied to simulate the Z-spectra for each pixel with MATLAB. Figure 1b shows a U-Net used to quantify parametric maps. Different from FCN, which is a pixel-wise network, the input of the U-Net is the images at different saturation frequency offsets instead of pixels of Z-spectra. The output of U-Net is the NOE’s concentration and exchange rate, and B0 maps.
Performance evaluation: The root mean square error (RMSE) of the results of a simulation sample with different noise levels was calculated to evaluate the fitting accuracy. To quantitatively compare the precision of the three methods, the coefficient of variation (CV) and contrast-to-noise ratio (CNR) of the results of the rat C6 glioma model were analyzed. The regions of interest (ROIs) enclosing the tumor and the normal tissue were carefully drawn on its T2-weighted image.
Results
The results of three methods for the simulation sample with noise level 4 are displayed in Figure 2a. Figure 2b shows that in the case of strong noise (noise level > 4), the RMSEs of U-Net results are smaller than those of Bloch fitting and FCN, which indicates that U-Net has the highest accuracy in strong noise.For a set of 64 × 64 rat brain data, Bloch fitting took about 20 h, FCN took about 5 s, while U-Net took less than 1 s. Figure 3a shows the results of rat brain. In the NOE concentration map, the tumor portion shows a lower concentration than normal tissue, which is coincident with established studies.1, 3 Figure 3b shows the ROIs for CV and CNR calculations. Table 1 indicates that the CVs of ROI1 in tumor from U-Net are significantly lower compared with Bloch fitting or FCN. Table 2 shows that the CNRs from U-Net are higher than those of FCN. These results indicate that U-Net has higher precision and provides more visible contrast between tumor and normal tissue than FCN.
Discussion and conclusion
In this study, we propose a method for quantifying NOE effect using U-Net. The method is compared with Bloch fitting and FCN. The results of a simulation sample with different noise levels show that the error increases as noise rising for all three methods. Our proposed method has the highest accuracy in the case of strong noise, which means that U-Net has the strongest robustness to noise. This may be due to the fact that U-Net can smooth noise by utilizing spatial information. The results of a rat C6 glioma model show that the proposed method is the fastest among the three methods, and the contrast between the tumor and the normal tissue is more visible for the proposed method than for FCN, which is more favorable for tumor detection.Acknowledgements
This work was supported by the National Natural Science Foundation of China under grant numbers 11775184, 82071913 and U1805261.References
1. Jianpan H, Zilin C, Se-Weon P, et al. Molecular Imaging of Brain Tumors and Drug Delivery Using CEST MRI: Promises and Challenges. Pharmaceutics. 2022; 14(2):451.2. Jinyuan Z, Moritz Z, Linda K, et al. Review and consensus recommendations on clinical APT-weighted imaging approaches at 3T: Application to brain tumors. Magnetic Resonance in Medicine. 2022; 88(2):546-574.
3. Yuanyu S, Gang X, Zhiwei S, et al. Imaging of nuclear Overhauser enhancement at 7 and 3T. Nmr in Biomedicine. 2017; 30(9):e3735.
4. Lin C, Michael S, Kannie W.Y C, et al. In vivo imaging of phosphocreatine with artificial neural networks. Nature Communications. 2020; 11(1):1072.
5. Felix G, Anagha D, Sergey P, et al. DeepCEST 3T: Robust MRI parameter determination and uncertainty quantification with neural networks-application to CEST imaging of the human brain at 3T. Magnetic Resonance in Medicine. 2020; 84(1):450-466.
6. Johannes B, Anagha D, Steffen G, et al. Adaptive denoising for chemical exchange saturation transfer MR imaging. Nmr in Biomedicine. 2019; 32(11):e4133.
Figures
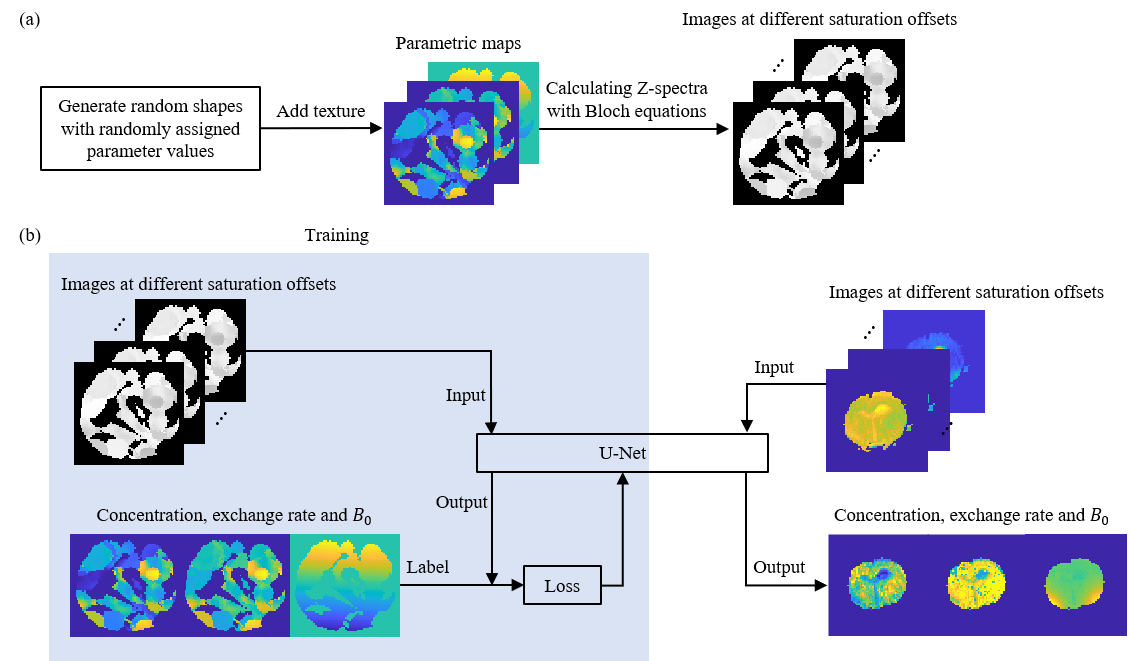
Figure 1. (a) The process of generating simulation samples. (b) Framework of predicting concentration, exchange rate and B0 from images at different saturation offsets with U-Net.
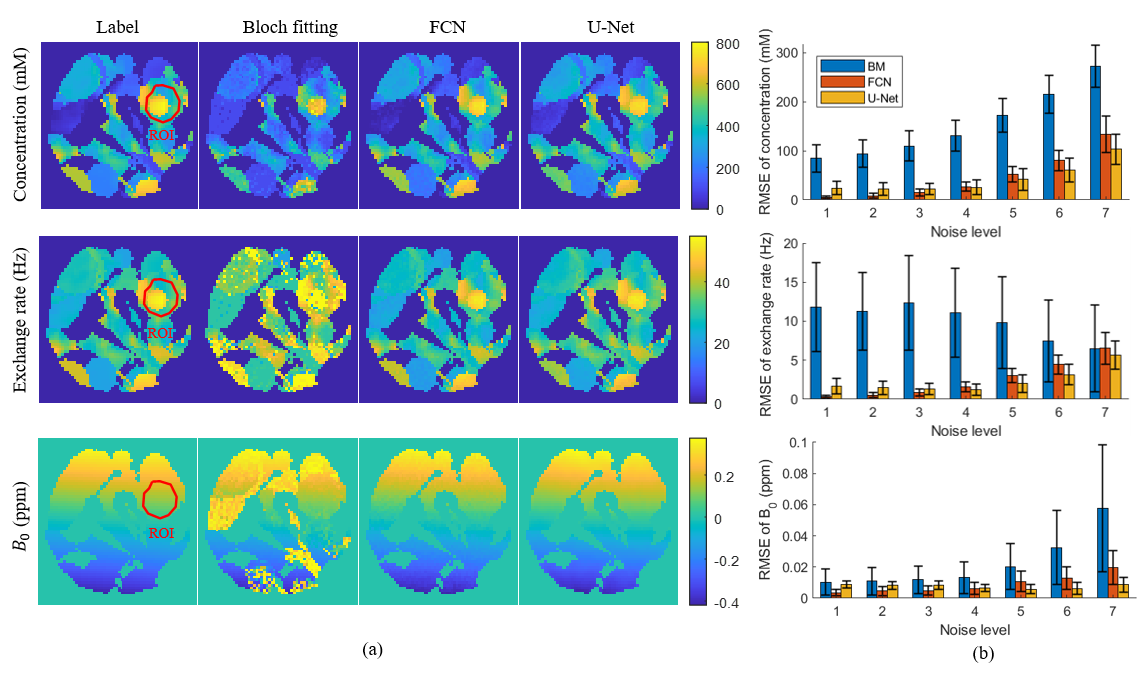
Figure 2. (a) The concentration, exchange rate and B0 maps for simulation sample from Bloch fitting, FCN and U-Net. (b) The RMSEs of ROI of the results of simulation sample at different noise levels.
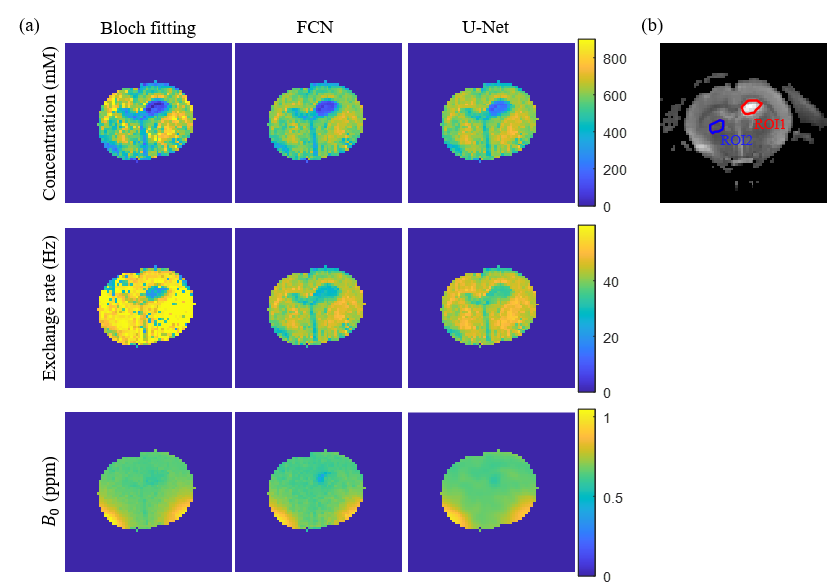
Figure 3. (a) The concentration, exchange rate and B0 maps for the glioma rat brain from Bloch fitting, FCN and U-Net. (b) The ROIs marked in the T2-weighted image of the glioma rat brain for CV and CNR calculations.
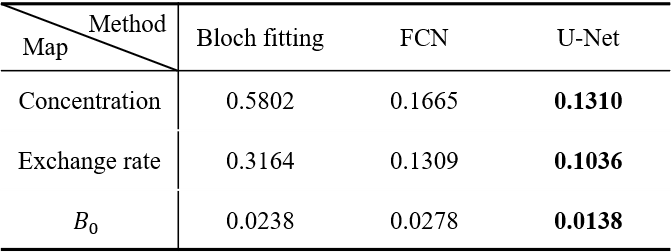
Table 1. The CVs of ROI1 in tumor for the concentration, exchange rate and B0 maps.

Table 2. The CNRs between tumor (ROI1) and normal tissue (ROI2) for the concentration and exchange rate maps.
DOI: https://doi.org/10.58530/2023/0910