0909
Can APT-weighted CEST MRI provide robust measurement at 3T? A reproducibility study in healthy brain and tumor across sessions and scanners1Department of Radiology & Nuclear Medicine, Erasmus MC, Rotterdam, Netherlands, 2Brain Tumour Centre, Erasmus MC Cancer Institute, Rotterdam, Netherlands, 3Centre for Neuroimaging Science, King's College London, London, United Kingdom, 4Department of Medical Oncology, Erasmus MC, Rotterdam, Netherlands, 5Medical Delta, Delft, Netherlands
Synopsis
Keywords: CEST & MT, CEST & MT, Amide, reproducibility, brain tumor
The goal of this study was to investigate whether APT-weighted CEST imaging can provide reproducible measurements across scan sessions and scanners. Reproducibility of APT-weighted imaging in healthy brain tissue and tumors was evaluated for three CEST metrics: Lorentzian Difference (LD), magnetization transfer ratio asymmetry (MTRasym), and relaxation-compensated inverse magnetization transfer ratio (MTRREX).Introduction
Amide proton transfer weighted chemical exchange saturation transfer imaging (APTw CEST) can provide biomarkers for characterization of brain tumors1. However, before routine application in clinical practice, it is necessary to investigate and compare the reproducibility of APTw CEST to provide robust measurement across different scan sessions and scanners, in both healthy volunteers and patients. In this work, we compared the reproducibility of APTw CEST evaluated by Lorentzian Difference (LD), magnetization transfer ratio asymmetry (MTRasym) and relaxation-compensated inverse magnetization transfer ratio (MTRREX) of healthy tissue and brain tumors, to assess within-session, between-session and between scanner reproducibility.Methods
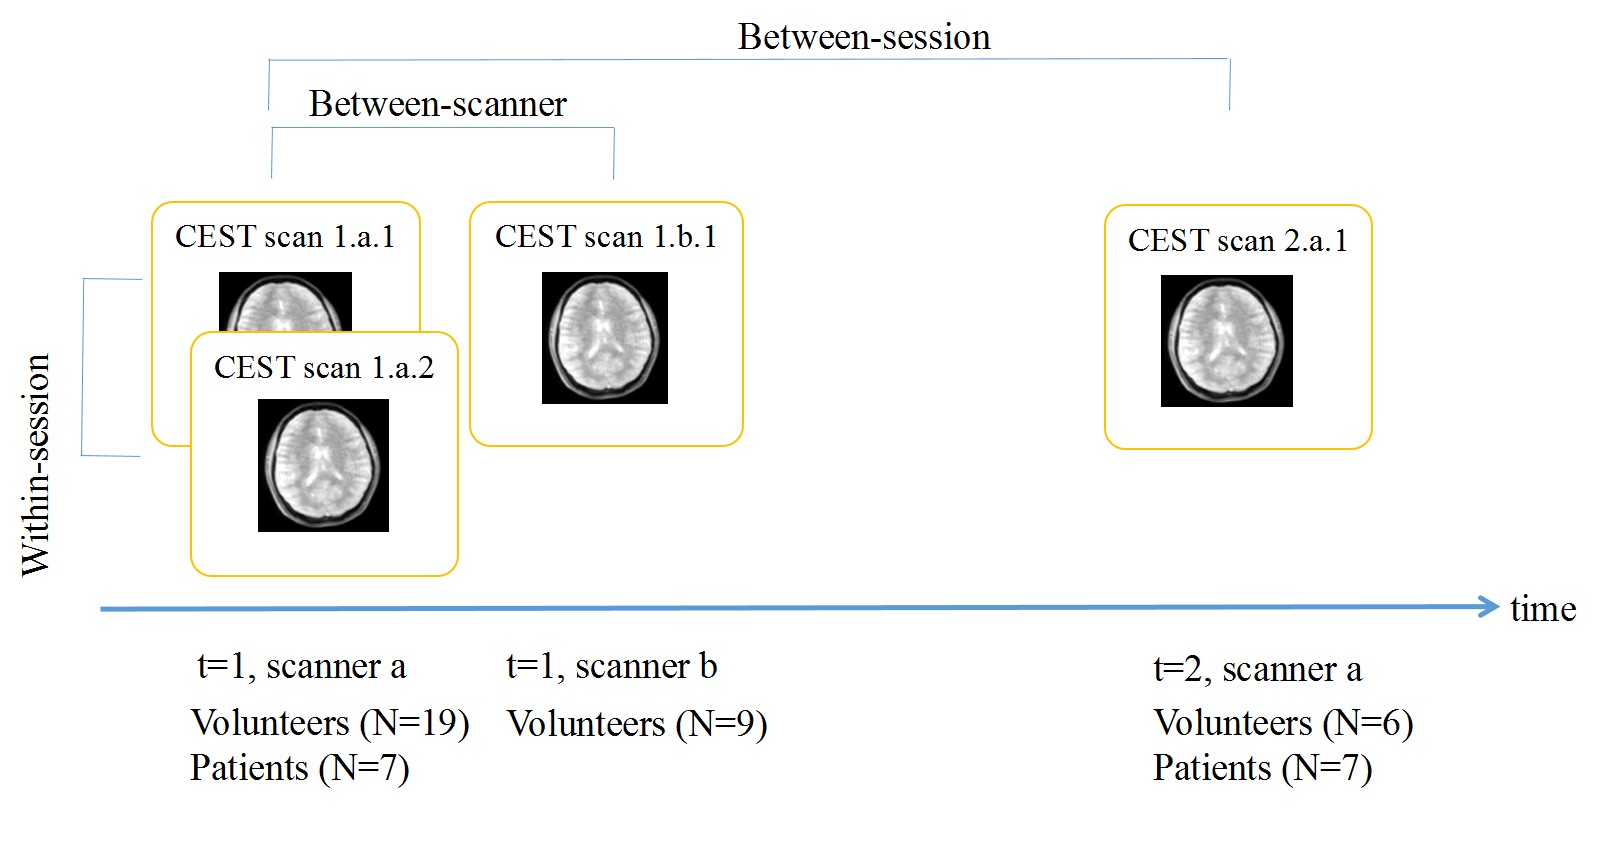
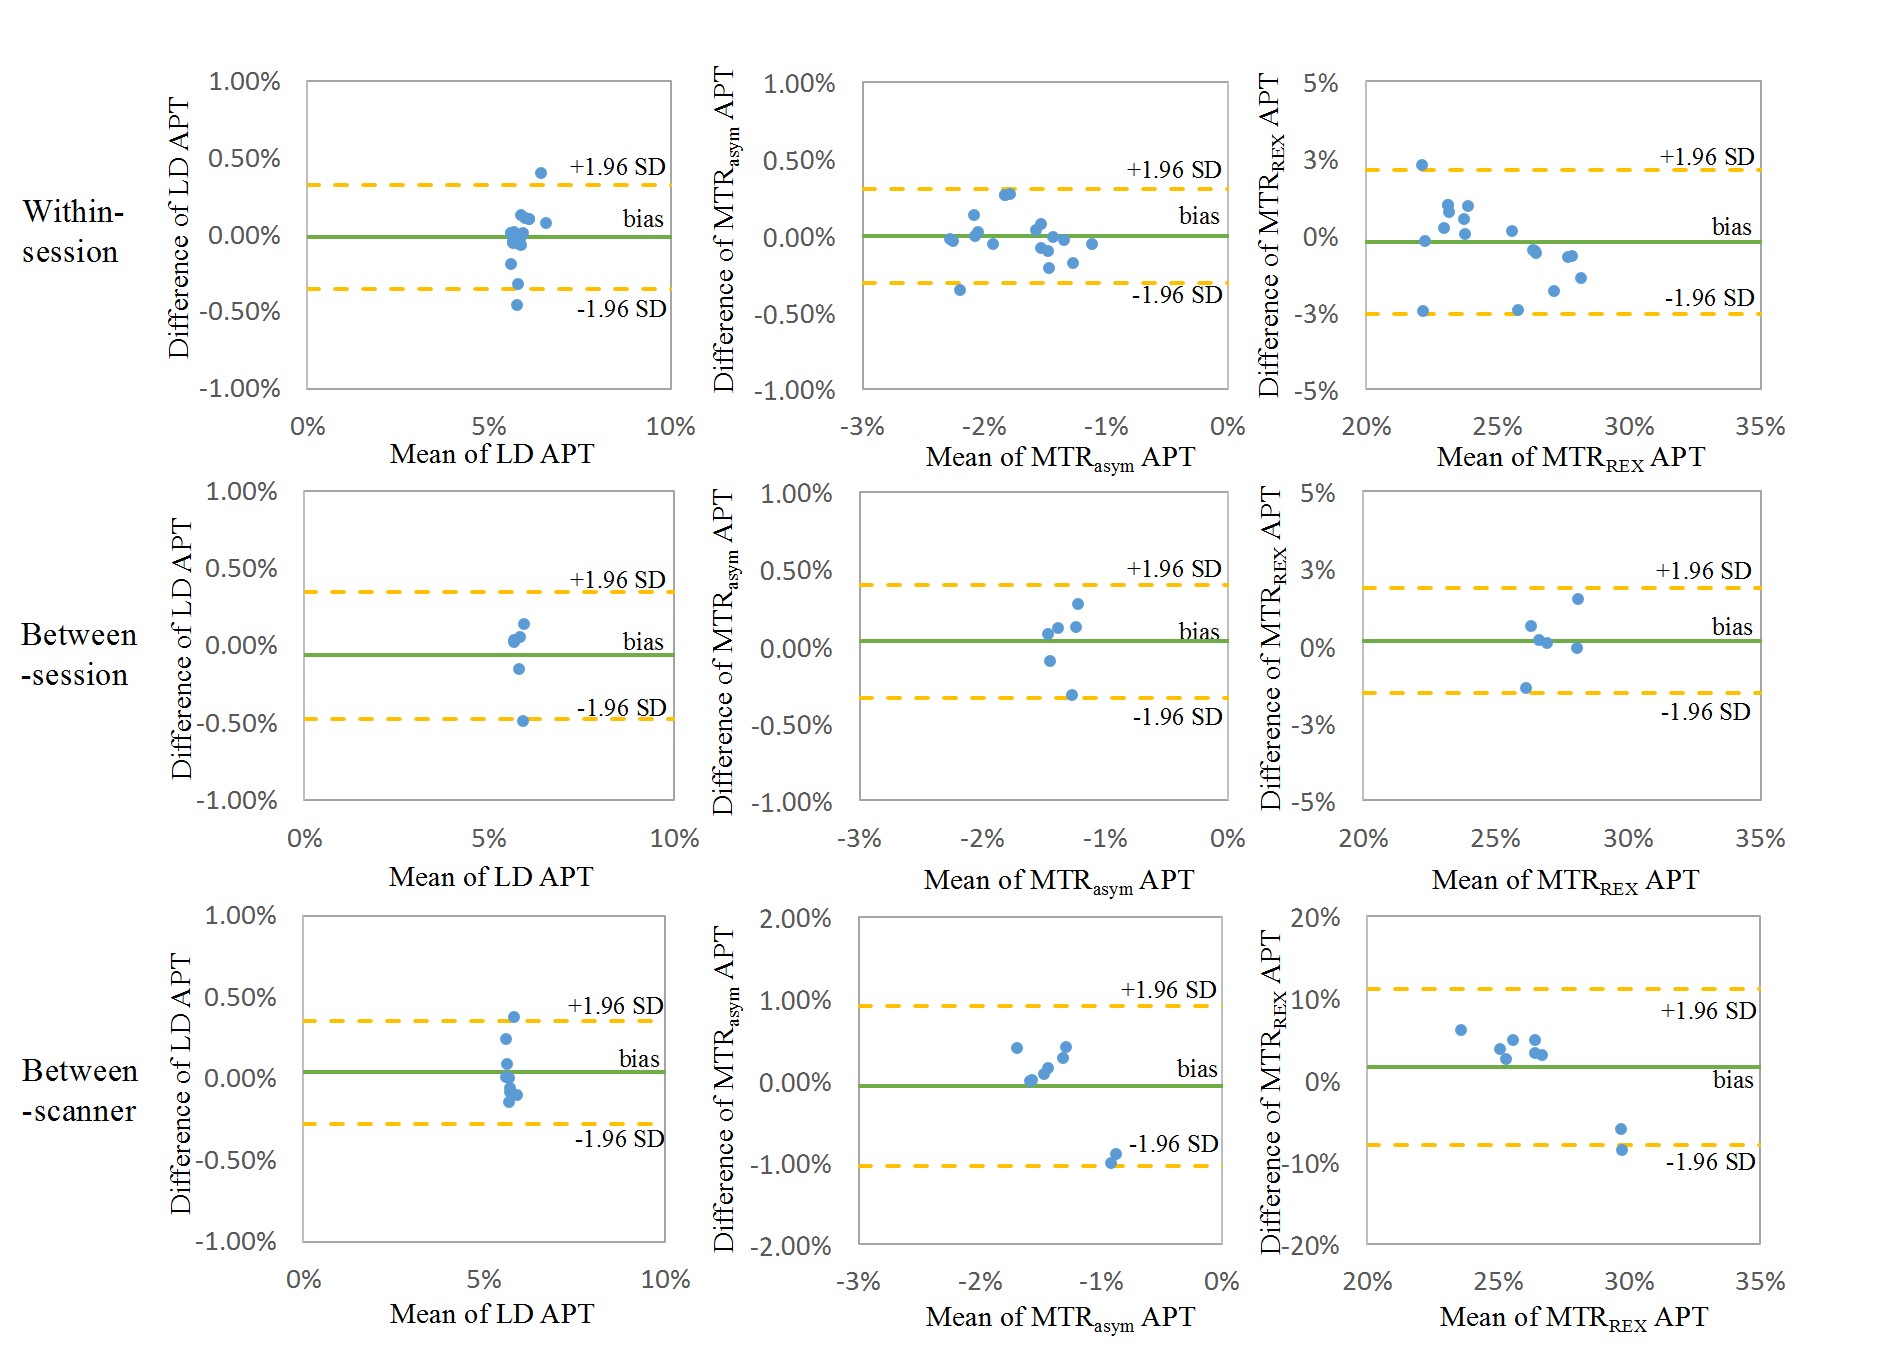
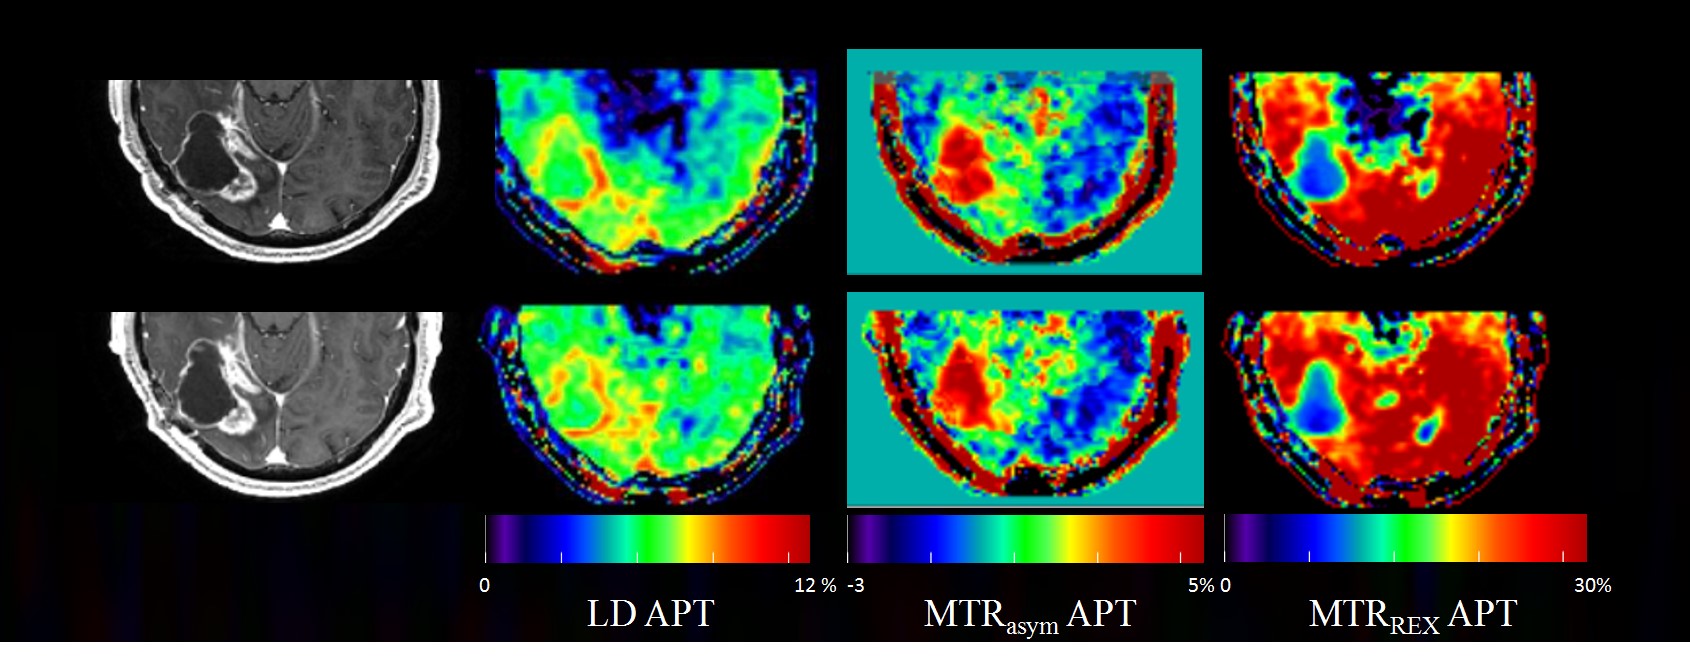
This research had approval of the institutional ethics committee. A 3 Tesla MRI scanner equipped with a 32-channel head coil (MR750, General Electric, Chicago, USA) was used for the within/between session reproducibility in healthy volunteers. Additional scans at a 3T SIGNA PET-MRI scanner with a 24-channel head coil (General Electric, Chicago, USA) were used to assess between-scanner reproducibility in healthy volunteers, and between-session reproducibility in patients. A session contained a T1-weighted structural scan and 2 identical CEST scans. The total scan duration of a session was approximately 15 minutes. We investigated reproducibility (Figure 1) in 19 healthy volunteers (age 19-62 years, sex: 7 males/12 females) and 7 patients with primary or recurrent malignant brain tumors (high-grade glioma, N=5; brain metastasis, N=2).CEST scans were performed using a snapshot acquisition2 with B1=1.5 µT, 14 slices, 1.7×1.7×3 mm3, 80 pulses (20 ms saturation,50% duty cycle). The last of 4 images acquired at 300 ppm was selected as the S0 image. Saturated S images were acquired at 43 frequency off-sets between -100 and 100 ppm, yielding 4min40s in each static scan. CEST images were processed based on the analysis pipeline reported in Wu et al3. The APTw CEST effect was evaluated by the standard calculation of LD3, MTRasym4 and MTRREX5 at 3.5 ppm and averaged in whole brain white matter (WM), grey matter (GM), lateral ventricles (CSF), enhancing tumor (CE) and necrotic area (core). The calculation of within subject coefficient of variation (COV), Bland-Altman plots, and mixed effect modeling were performed to assess the reproducibility based on the ROI averaged values. Analysis was done with in-house written Matlab scripts (R2021a, The MathWorks, Natick, USA)6 and R studio v2022.2.1.4617. The level of statistical significance was set at p<0.05.
Results
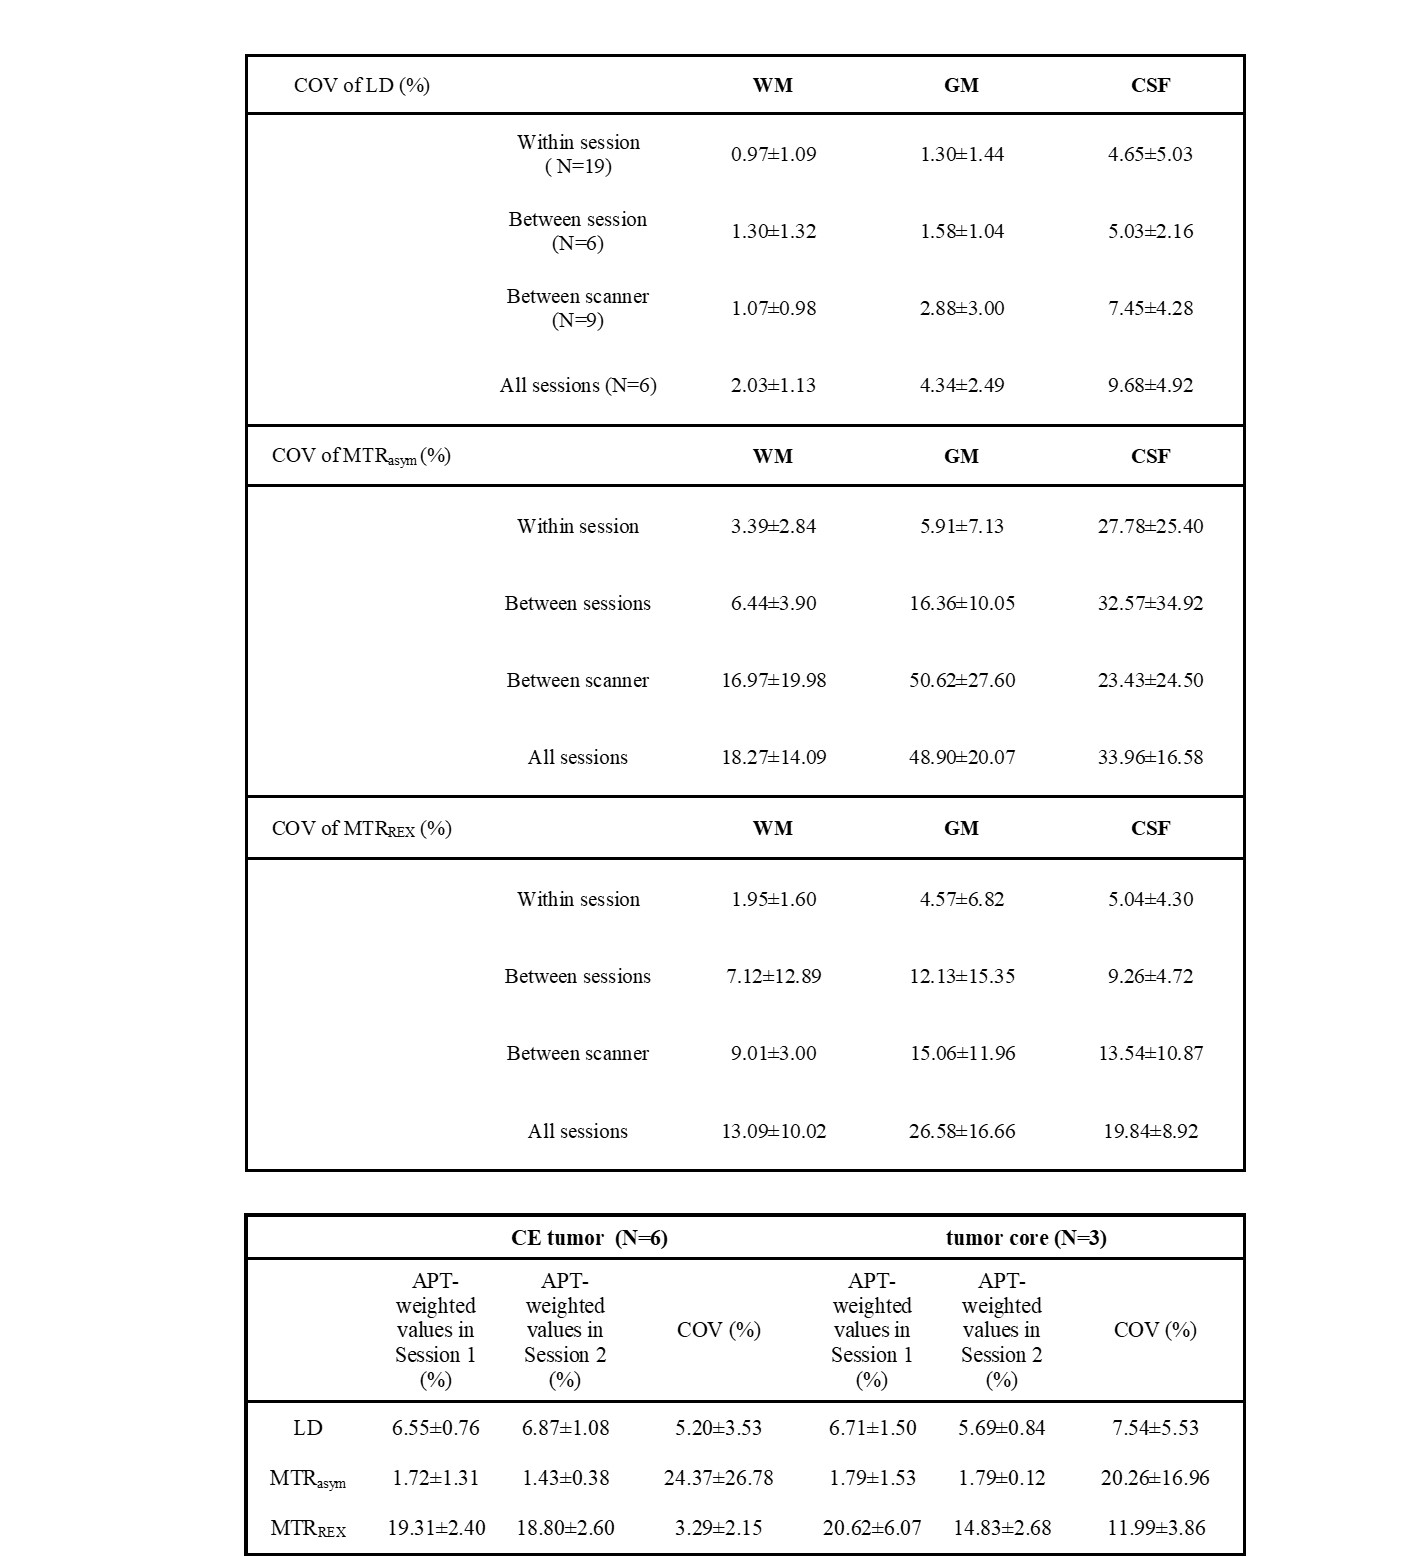
The group averaged COVs of LD APT were 0.97%±1.09% (N=19), 1.30%±1.32% (N=6), 1.07%±0.98% (N=9) in WM for within-session (Table 1), between-session and between-scanner, respectively, 2.03%±1.13% over all 4 CEST scans (N=6) in different sessions, 5.20%±3.52% and 7.54%±5.53% in CE (N=6) and necrotic core (N=3) respectively. One patient data was discarded due to a small tumor ROI and unable alignment. The areas of tumor core in some patients were too small due to resection, which was not included in the analysis. There were no significant differences in within-session, between-session and between-scanner comparisons of APT-weighted CEST signal evaluated by LD, MTRasym and MTRREX. The COVs of LD and MTRREX were consistently lower compared to the COV of MTRasym, both in healthy tissue and tumor and for all experiments.Discussion
The reproducibility of APT-weighted CEST signal within a session was consistently better than between sessions and between scanners. However, the majority of COV values in our study were <30%, which suggest acceptable reproducibility for clinical practice8,9, not only within sessions but also between sessions and scanners. LD and MTRREX provided more robust measurements than MTRasym with COV<10%, because LD/MTRREX provided higher signal-to-noise and included less signal contributors than MTRasym which helped improve the reproducibility.Conclusion
In summary, our study provides further evidence that APTw CEST MRI is a reproducible and quantitative imaging biomarker in healthy brain and brain tumors across scan sessions and scanners at 3 Tesla. While MTRasym provides acceptable reproducibility, more advanced metrics (LD and MTRREX) show much better reproducibility which is of importance when subtle differences in APTw CEST are sought for clinical diagnosis or monitoring of brain pathology. Future work in translating APTw CEST MRI for clinical application in brain tumor diagnostics should include measuring reproducibility across different sites and different vendors.Acknowledgements
This research was supported by the Erasmus MC, the British Brain Tumour Charity (GN-000540), Dutch Research Council (91619121) and Semmy Foundation. We would like to thank all study participants for taking part, Renée Leenaars for helping recruitment participants and Qianting Lv for providing statistical advice.References
1. Zhou, J., et al., Review and consensus recommendations on clinical APT-weighted imaging approaches at 3T: Application to brain tumors. Magn Reson Med, 2022. 88(2): p. 546-574.
2. Deshmane, A., et al.,3D gradient echo snapshot CEST MRI with low power saturation for human studies at 3T.Magnetic Resonance in Medicine, 2019. 81(4): p. 2412-2423.
3. Wu, Y., et al.,3D APT and NOE CEST-MRI of healthy volunteers and patients with non-enhancing glioma at 3 T.Magnetic Resonance Materials in Physics, Biology and Medicine, 2022.
4. Zhou, J., et al.,Amide proton transfer (APT) contrast for imaging of brain tumors.Magn Reson Med, 2003. 50(6): p. 1120-6.
5. Zaiss, M., et al.,Relaxation-compensated CEST-MRI of the human brain at 7T: Unbiased insight into NOE and amide signal changes in human glioblastoma.NeuroImage, 2015. 112: p. 180-188.
6. Strupp, J.P.,Stimulate: A GUI based fMRI analysis software package.NeuroImage, 1996. 3(3, Supplement): p. S607.
7. R Core team (2022). R: A language and environment for statistical computing.R Foundation for Statistical Computing, Vienna, Austria, 2022. URL: https://www.R-project.org/
8. Lee, J.B., et al., Repeatability of amide proton transfer-weighted signals in the brain according to clinical condition and anatomical location. Eur Radiol, 2020. 30(1): p. 346-356.
9. Aronhime, S., et al.,DCE-MRI of the liver: Effect of linear and nonlinear conversions on hepatic perfusion quantification and reproducibility.Journal of Magnetic Resonance Imaging, 2014. 40(1): p. 90-98.
Figures