0908
Removal of lipid artifacts in CEST data using differential analysis with fitted magnetization transfer and lipid signals (DIGITAL)1Key Laboratory for Biomedical Engineering of Ministry of Education, Department of Biomedical Engineering, College of Biomedical Engineering & Instrument Science, Zhejiang University, Hangzhou, China, 2Department of Radiology, Chongqing University Cancer Hospital, Chongqing, China, 3MR Collaborations, Siemens Healthineers Ltd., Shanghai, China, 4School of Medicine, Chongqing University, Chongqing, China
Synopsis
Keywords: CEST & MT, CEST & MT
Chemical exchange saturation transfer (CEST) imaging provides important molecular information that can reflect changes in various pathologies. However, applying CEST to lipid-rich organs, such as the breast, is technically challenging, where the lipid artifacts can grossly affect the CEST signal. In this study, we propose a novel differential analysis method with fitted magnetization transfer and lipid contributions (DIGITAL) to remove the lipid artifacts without changing the acquisition sequence. The DIGITAL method was validated on breast cancer patients, and yielded fewer lipid artifacts and better image smoothness than previous analysis-based methods.Introduction
Chemical exchange saturation transfer (CEST) imaging provides important molecular information that can reflect changes in various pathologies1. However, applying CEST to lipid-rich organs, such as the breast, is technically challenging, where the lipid artifacts can grossly affect the CEST signal2,3. Various methods have been proposed to tackle the lipid artifacts in breast CEST studies, which can be roughly grouped into acquisition-based and analysis-based methods. The acquisition-based methods include special fat suppression4, water-only excitation5 and CEST-Dixon6. The analysis-based methods include Lorentzian difference (LD) analysis7 and multi-pool Lorentzian (MPL) fitting7,8. The analysis-based methods are of particular interest in this work. The LD analysis method proposed by Dula et al. fits a single-pool z-spectrum to the data and subtracts it from the experimental data7. The MPL fitting method proposed by Zimmermann et al. normalizes the z-spectrum by assuming the 0ppm signal to be pure fat, and fits the normalized z-spectrum with a 5-pool Lorentzian function8. Inspired by the extrapolated semi-solid magnetization transfer reference (EMR) method9, we propose a differential analysis method with fitted magnetization transfer and lipid contributions (DIGITAL), which forms a background z-spectrum and gets subtracted from the experimental z-spectrum to remove lipid artifacts.Methods
Data acquisition:Six female patients with breast cancer were scanned on a 3T Siemens scanner. A frequency-stabilized 2D TSE-CEST sequence10 was used for CEST acquisition: TR=3000ms, TE=7.5ms, matrix size=256×224, FOV=260mm×227.5mm, B1=1uT, saturation time=1s including 10 gauss pulses, and 63 saturation offsets from 80 to -6ppm9 with a total duration of 3.2min. Notably, no fat suppression was used in the TSE-CEST sequence. The B0 and B1 field maps were also acquired for z-spectrum correction and numerical fitting. In addition, conventional Dixon data were acquired to calculate the fat fraction (FF) map, and contrast-enhanced T1-weighted images were collected to demarcate the tumor.
Image processing & DIGITAL fitting:
The raw z-spectrum was corrected by the B0 map for succeeding fitting in Matlab 2020a (The MathWorks Inc, Natick, MA, USA). Similar to EMR9, the frequency offsets within 80~6ppm were utilized to fit a two-pool (water and magnetization transfer [MT]) Bloch-McConnell model using a super-Lorentzian lineshape11. Different from EMR9, the proposed DIGITAL method included an extra lipid pool, without proton exchange between lipid and water pools (kfw = 0Hz). Specifically, we used a 7-peak fat model12 and deployed extra frequency offsets within 1~-6ppm to ensure a good fit of the lipid pool. The relative concentrations of the 7 lipid peaks can vary in tissues, and were estimated with an established 3-parameter function depending on the fatty acid chain length (CL), number of double bonds per molecule (ndb), and number of methylene-interrupted double bonds (nmidb)13. We used identical T1 and T2 values for the 7 lipid peak as an approximation of lipid signal to reduce the fitting parameters. Consequently, a total of 6 unknown parameters (FF, CL, ndb, nmidb, T1f, and T2f) were fitted for the 7-peak fat pool. The range of the DIGITAL parameters is listed in Table 1.
Evaluation:
The fitted z-spectrum was extrapolated to +3.5 ppm for calculating the APT# signal as:$$APT^{\#}=Z_{fit}\left(+3.5\mathrm{ppm}\right) - Z_{acq} \left( +3.5\mathrm{ppm} \right)$$where $$$Z_{fit}$$$ was the fitted z-spectrum from DIGITAL or EMR, and $$$Z_{acq}$$$ was the acquired z-spectrum. In comparison, MPL8 and convention asymmetry (MTRasym) methods were also implemented.
The uniformity index (UI) was used for assessing the quantitative quality of results in the normal tissues:$$UI=1-\frac{1}{a \cdot N \cdot (b+\overline{X})}\sum^N_{i=1}\left|X_i-\overline{X}\right|$$where $$$a\ (=0.5)$$$ and $$$b\ (=-0.05)$$$ are scaling factors,$$$\overline{X}$$$ is the mean value inside a chosen region of interest (ROI), $$$N$$$ is the number of voxels, and $$$X_i$$$ denotes the value of each voxel inside the ROI.
Results
The structural and CEST maps of two breast cancer patients from different analysis methods are displayed in Fig. 1. Unsurprisingly, the conventional MTRasym metric was strongly contaminated by lipid artifacts. The other methods extracted the CEST contrast successfully in general, but the CEST maps of EMR and MPL were noisy in the tumor region (Fig. 1A) and had noticeable lipid artifacts (red arrows). The quantitative evaluation indicated that DIGITAL had the best uniformity (Fig. 2) and was significantly (P<0.01) better than other analysis methods. Fig. 3 presents the z-spectra and difference spectra from various analysis methods. EMR failed to model the lipid peaks around -3.4ppm, while both MPL and DIGITAL both incorporated the lipid contributions in their models. However, DIGITAL fitted the lipid peak substantially better than MPL, likely because it used the comprehensive 7-peak lipid model instead of a signal peak in MPL. In addition, the FF map from DIGITAL agreed well with that from conventional Dixon (Fig. 4), demonstrating the reliability of DIGITAL.Discussion and Conclusion
The proposed DIGITAL method adds an extra lipid pool to the EMR method that can form a background z-spectrum and remove lipid artifacts by subtracting the background and experimental z-spectra. Notably, only 6 extra unknown parameters are needed to model the comprehensive 7-peak lipid contributions in DIGITAL. DIGITAL yielded fewer residual artifacts than EMR & MPL, and better image quality quantitatively evaluated by the UI index. In conclusion, DIGITAL is a promising analysis-based method that can be adopted easily to tackle the intense lipid artifacts in CEST imaging.Acknowledgements
National Natural Science Foundation of China: 81971605. Key R&D Program of Zhejiang Province: 2022C04031. Leading Innovation and Entrepreneurship Team of Zhejiang Province: 2020R01003. This work was supported by the MOE Frontier Science Center for Brain Science & Brain-Machine Integration, Zhejiang University.References
1 van Zijl, P. C., Lam, W. W., Xu, J., Knutsson, L. & Stanisz, G. J. Magnetization Transfer Contrast and Chemical Exchange Saturation Transfer MRI. Features and analysis of the field-dependent saturation spectrum. Neuroimage 168, 222-241 (2018).2 Zhang, S. et al. Z-spectrum appearance and interpretation in the presence of fat: Influence of acquisition parameters: Z-Spectrum Appearance and Interpretation in the Presence of Fat. Magnetic Resonance in Medicine 79, doi:10.1002/mrm.26900 (2017).
3 Lu, J., Zhou, J., Cai, C., Cai, S. & Chen, Z. Observation of true and pseudo NOE signals using CEST-MRI and CEST-MRS sequences with and without lipid suppression. Magnetic Resonance in Medicine 73, doi:10.1002/mrm.25277 (2014).
4 Dula, A. et al. Amide Proton Transfer Imaging of the Breast at 3 T: Establishing Reproducibility and Possible Feasibility Assessing Chemotherapy Response. Magnetic resonance in medicine : official journal of the Society of Magnetic Resonance in Medicine / Society of Magnetic Resonance in Medicine 70, doi:10.1002/mrm.24450 (2013).
5 Klomp, D. et al. Amide proton transfer imaging of the human breast at 7T: Development and reproducibility. NMR in biomedicine 26, doi:10.1002/nbm.2947 (2013).
6 Zhang, S. et al. CEST-Dixon for human breast lesion characterization at 3 T: A preliminary study: CEST-Dixon for Human Breast Lesion Characterization at 3 T. Magnetic Resonance in Medicine 80, doi:10.1002/mrm.27079 (2018).
7 Dula, A. N. et al. Optimization of 7-T chemical exchange saturation transfer parameters for validation of glycosaminoglycan and amide proton transfer of fibroglandular breast tissue. Radiology 275, 255-261, doi:10.1148/radiol.14140762 (2015).
8 Zimmermann, F. et al. A novel normalization for amide proton transfer CEST MRI to correct for fat signal–induced artifacts: application to human breast cancer imaging. Magnetic Resonance in Medicine 83, doi:10.1002/mrm.27983 (2019).
9 Heo, H. Y., Zhang, Y., Lee, D. H., Hong, X. & Zhou, J. Quantitative assessment of amide proton transfer (APT) and nuclear overhauser enhancement (NOE) imaging with extrapolated semi-solid magnetization transfer reference (EMR) signals: Application to a rat glioma model at 4.7 tesla. Magnetic resonance in medicine 75, 137-149, doi:10.1002/mrm.25581 (2016).
10 Liu, R. et al. Frequency-stabilized chemical exchange saturation transfer imaging with real-time free-induction-decay readout. Magnetic resonance in medicine 85, doi:10.1002/mrm.28513 (2020).
11 Morrison, C. & Henkelman, M. A Model for Magnetization Transfer in Tissues. Magnetic resonance in medicine : official journal of the Society of Magnetic Resonance in Medicine / Society of Magnetic Resonance in Medicine 33, 475-482, doi:10.1002/mrm.1910330404 (1995).
12 Zhao, Y. et al. Self-adapting multi-peak water-fat reconstruction for the removal of lipid artifacts in chemical exchange saturation transfer (CEST) imaging. Magnetic Resonance in Medicine 82, 1700-1712, doi:https://doi.org/10.1002/mrm.27859 (2019).
13 Hamilton, G. et al. In vivo characterization of the liver fat (1)H MR spectrum. NMR in biomedicine 24, 784-790, doi:10.1002/nbm.1622 (2011).
Figures
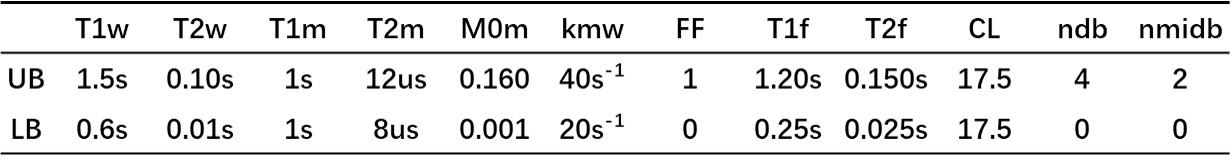
Table 1:
Parameters used in DIGITAL fitting. T1w: T1 of water; T2w: T2 of water; T1m: T1 of MT; T2m: T2 of MT; M0m: fraction of MT; kmw: exchange rate of MT to water; FF: fat fraction; T1f: T1 of fat; T2f: T2 of fat; CL, fatty acid chain length; ndb: number of double bonds per molecule; nmidb: number of methylene-interrupted double bonds; UB: upper bound; LB: lower bound.
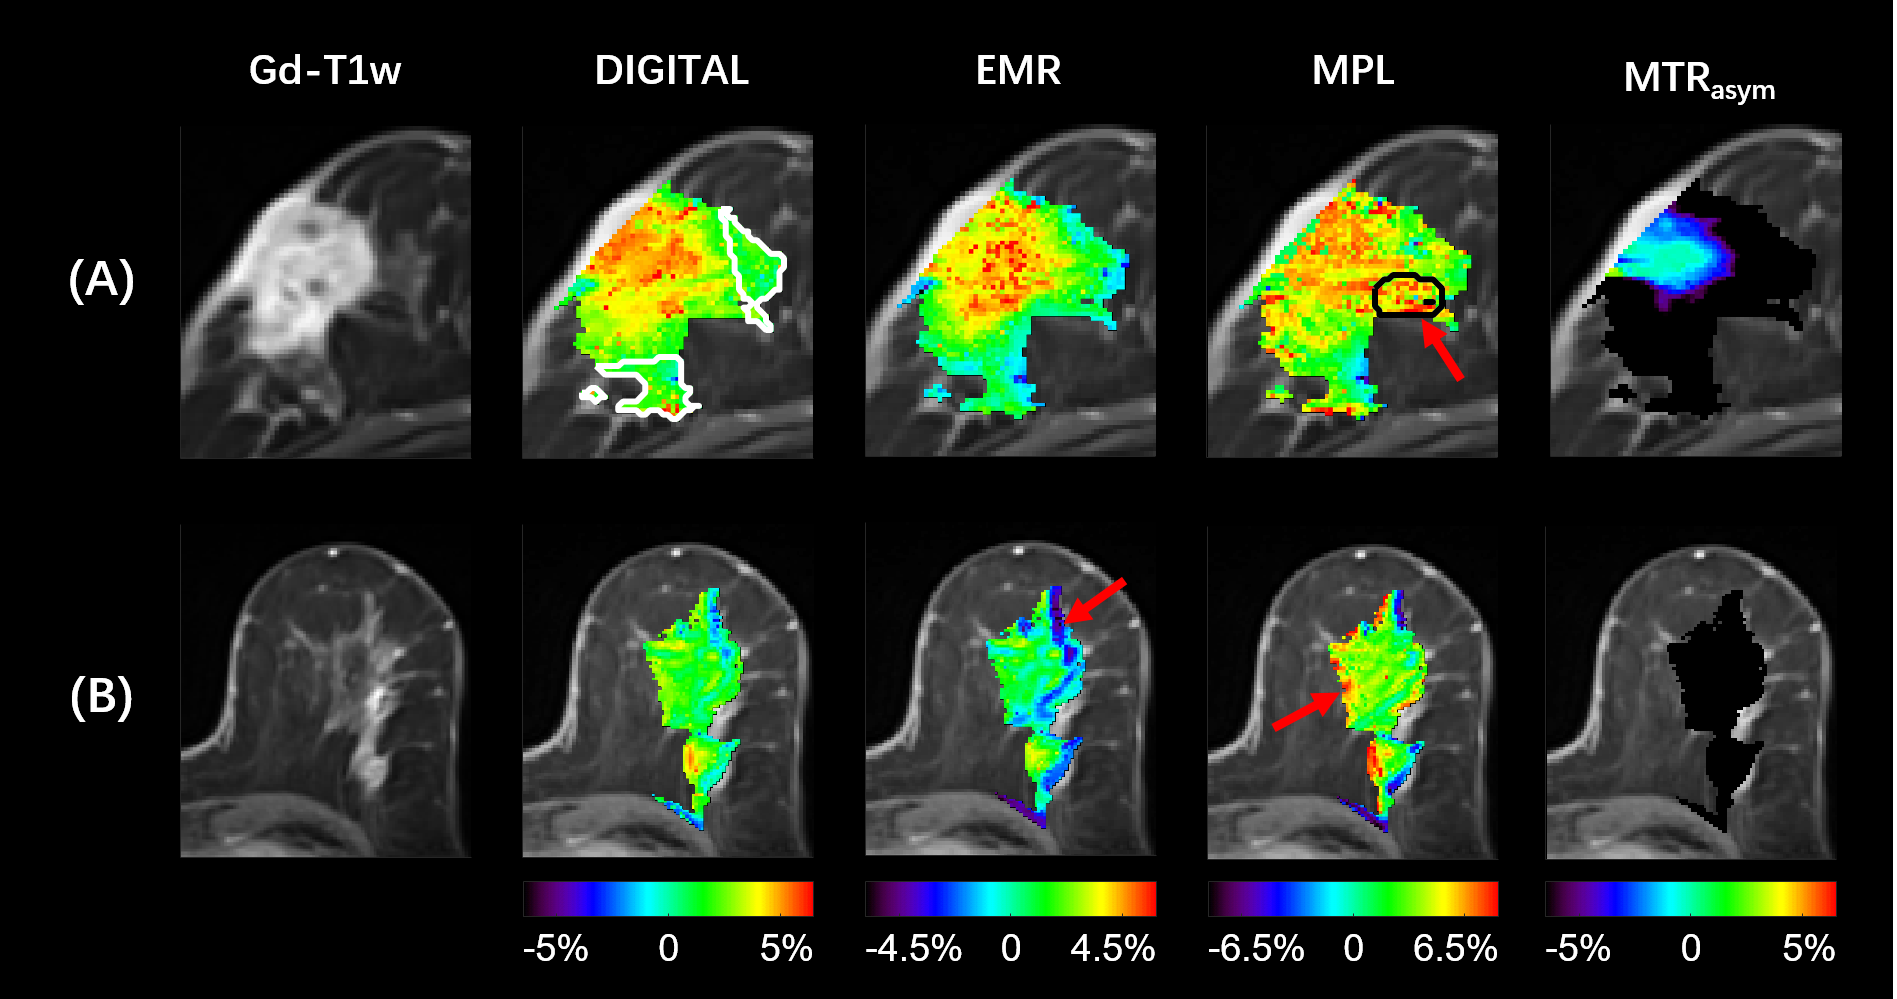
Figure 1:
The structural and CEST maps of two breast cancer patients from different analysis methods (DIGITAL, EMR, MPL, and MTRasym). The CEST color maps are only displayed in regions with FF < 75%. Red arrows mark the residual artifacts.
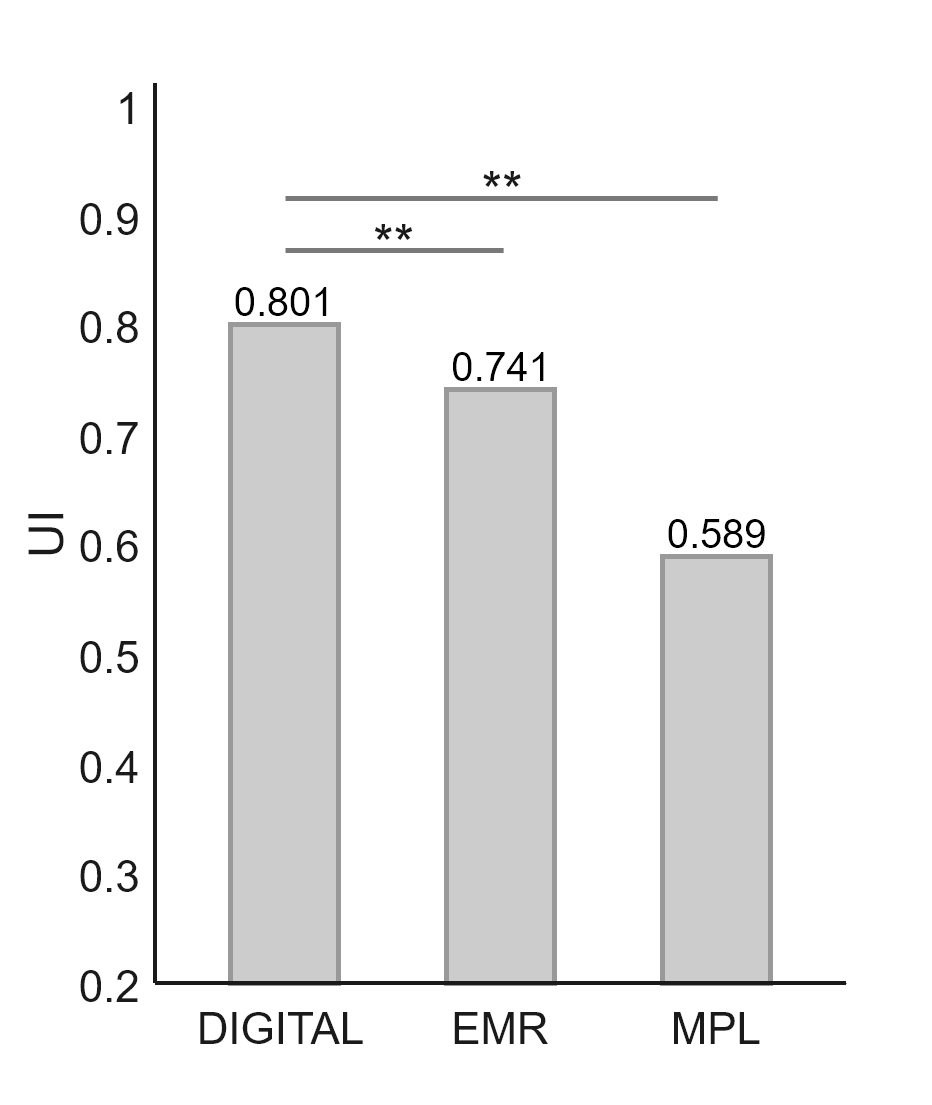
Figure 2:
The UI inside normal tissues from different analysis methods. The white contours on the DIGITAL map of Figure 1 refers to the ROI for normal tissues. **: P<0.01.
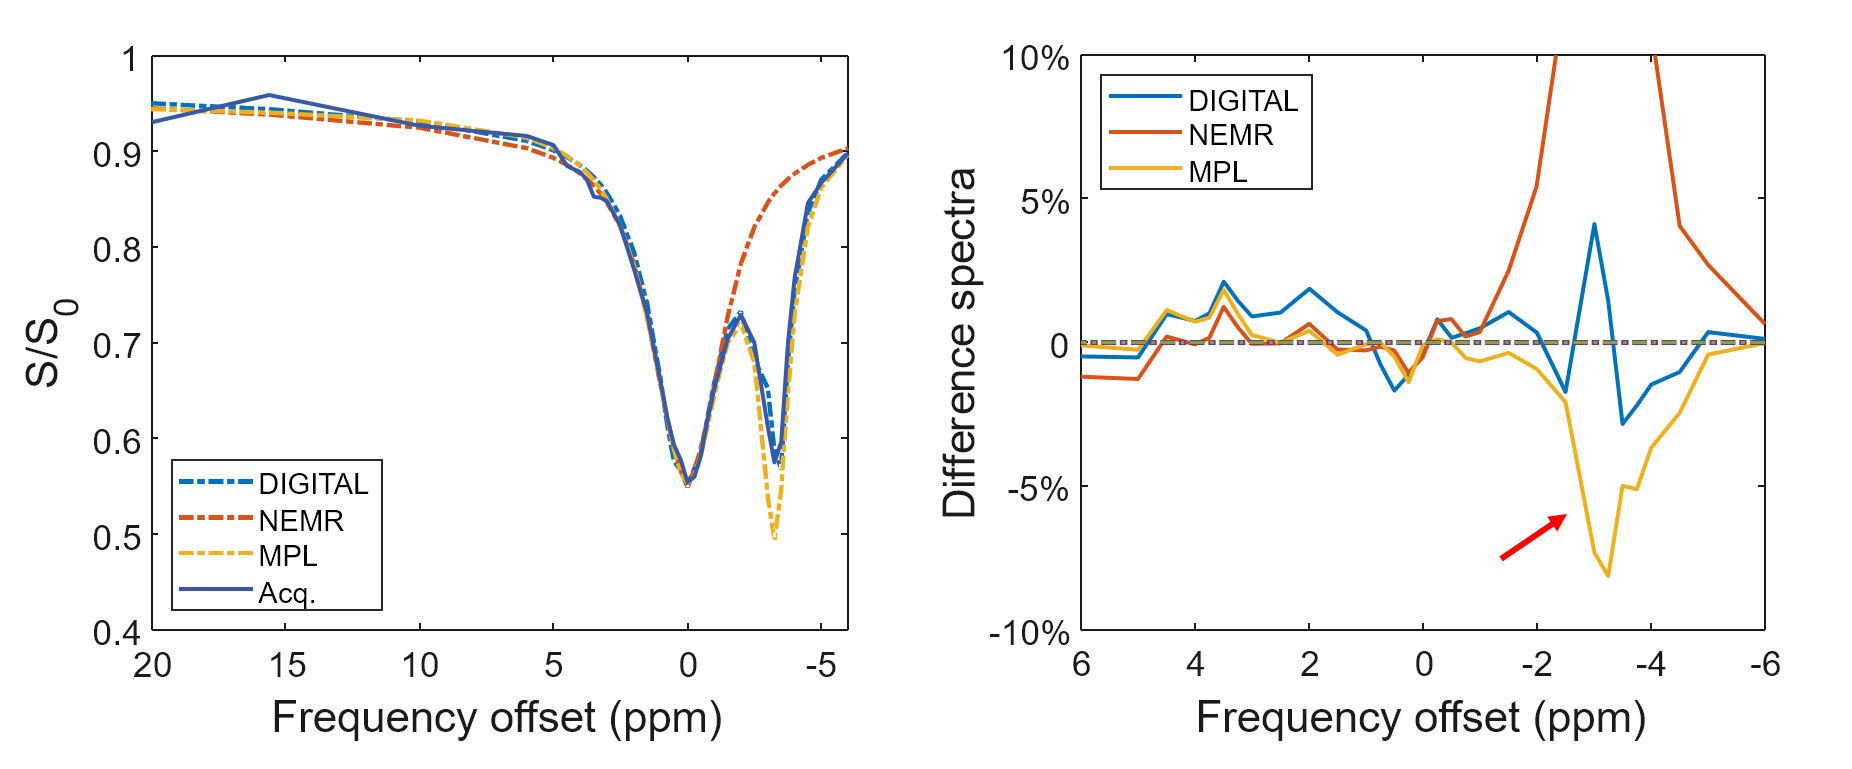
Figure 3:
The z-spectrum and difference spectra from DIGITAL, EMR and MPL in the black contours on the MPL map of Figure 1. The red arrow indicates the fitting error of MPL around -3.4ppm.
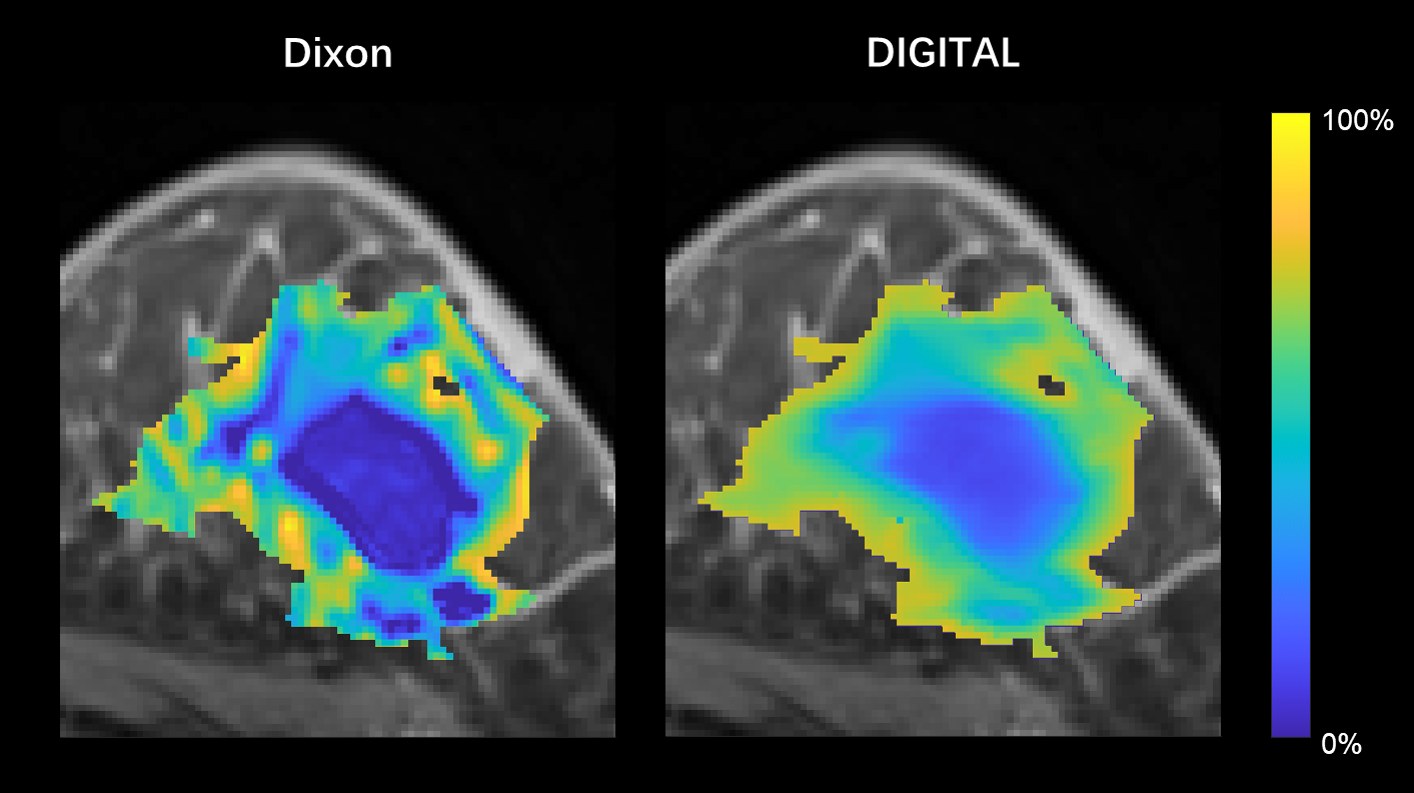
Figure 4:
The fat fraction maps from Dixon and DIGITAL in regions with FF < 75%.