0907
Validate your CEST simulation!
Patrick Schuenke1, Kai Herz2,3, Zhongliang Zu4, Nirbhay Yadav5,6, Qing Zeng5,6, Markus Huemer7, Rudolf Stollberger7, Jiadi Xu5,6, Kexin Wang5,8, Feriel Romdhane9, Dario Livio Longo9, Or Perlman10, Peter C.M. van Zijl5,8, and Moritz Zaiss11
1Physikalisch-Technische Bundesanstalt (PTB), Braunschweig and Berlin, Germany, 2Magnetic Resonance Center, Max Planck Institute for Biological Cybernetics, Tuebingen, Germany, 3Department of Biomedical Magnetic Resonance, University of Tuebingen, Tuebingen, Germany, 4Department of Radiology, Vanderbilt University Medical Center, Nashville, TN, United States, 5FM Kirby Research Center, Kennedy Krieger Institute, Baltimore, MD, United States, 6Russell H. Morgan Department of Radiology and Radiological Science, The Johns Hopkins University School of Medicine, Baltimore, MD, United States, 7Institut of Bioimaging, Graz University of Technology, Graz, Austria, 8Department of Radiology, The Johns Hopkins University School of Medicine, Baltimore, MD, United States, 9Institute of Biostructures and Bioimaging (IBB), National Research Council of Italy (CNR), Torino, Italy, 10Athinoula A. Martinos Center for Biomedical Imaging, Department of Radiology, Massachusetts General Hospital and Harvard Medical School, Charlestown, MA, United States, 11Institute for Neuroradiology, University Hospital Erlangen, Friedrich-Alexander Universität Erlangen-Nürnberg, Erlangen, Germany
1Physikalisch-Technische Bundesanstalt (PTB), Braunschweig and Berlin, Germany, 2Magnetic Resonance Center, Max Planck Institute for Biological Cybernetics, Tuebingen, Germany, 3Department of Biomedical Magnetic Resonance, University of Tuebingen, Tuebingen, Germany, 4Department of Radiology, Vanderbilt University Medical Center, Nashville, TN, United States, 5FM Kirby Research Center, Kennedy Krieger Institute, Baltimore, MD, United States, 6Russell H. Morgan Department of Radiology and Radiological Science, The Johns Hopkins University School of Medicine, Baltimore, MD, United States, 7Institut of Bioimaging, Graz University of Technology, Graz, Austria, 8Department of Radiology, The Johns Hopkins University School of Medicine, Baltimore, MD, United States, 9Institute of Biostructures and Bioimaging (IBB), National Research Council of Italy (CNR), Torino, Italy, 10Athinoula A. Martinos Center for Biomedical Imaging, Department of Radiology, Massachusetts General Hospital and Harvard Medical School, Charlestown, MA, United States, 11Institute for Neuroradiology, University Hospital Erlangen, Friedrich-Alexander Universität Erlangen-Nürnberg, Erlangen, Germany
Synopsis
Keywords: CEST & MT, Simulations, validation, comparison
Quantitative CEST approaches can provide access to the exchange rate and solute concentration of exchange processes of interest. However, differences in the implementation of underlying Bloch-McConnell simulations will lead to differences in the determined quantitative parameters. Thus, we initiated a platform to compare and validate the CEST simulations from various CEST research groups. In this first comparison of continuous-wave saturation schemes, up to 5 different results for 8 compared simulations were observed. The project is still open for participation and we invite everbody to join the comparison and our planned discussions to finally realize a consensus on CEST simulations.Introduction
CEST MRI provides a contrast sensitive to exchange processes between solute and water protons, which provides new contrasts for clinical MRI. Recently, quantitative CEST approaches, providing access to the exchange rate and solute concentrations, are gaining interest. This includes Bloch-McConnell fits1,2, ratiometric approaches3,4 or CEST MR fingerprinting5. All of them have in common that, for a limited number of proton pools, the effects can be described quantitatively by Bloch-McConnell simulations. If these simulations differ between groups, the quantitative results will differ as well.We initiated a simple platform to compare and ultimately validate Bloch-McConnell simulations of different CEST research groups. In this work, we present the first preliminary results of our comparison for four cases with different well-defined continuous-wave saturation schemes and pool models. Our comparison already showed significant differences for a 5 pool WM system including semisolid MT.
Methods
Until now, 8 groups participated in the Bloch-McConnell simulation comparison. General simulation settings are provided on a public GitHub repository6, and simulation results are collected in an open google docs sheet to keep participation as simple as possible.The general settings/assumptions were: a fully relaxed initial magnetization (Zi = 1) for every offset, a post-preparation delay of 6.5 ms representing a typical gradient spoiler duration, a gyromagnetic ratio of exactly 42.5764 MHz/T, a field strength of 3T and thus a Larmor frequency of exactly 127.7292 MHz/T, and a preceding fully-relaxed normalization scan at -300 ppm
The four simulation cases were chosen as follows:
• Case 1: APTw steady-state (2µT, 15s cw) in a 2 pool model
• Case 2: APTw transient-state (2µT, 2s cw)7 in a 2 pool model
• Case 3: APTw transient-state (2µT, 2s cw)7 in a 5 pool model
• Case 4: WASABI (3.7µT, 5ms cw)8 in a 5 pool model
The 2 pool model consist of a water pool and a single CEST pool. The 5 pool model consists of 1 water, 1 symmetric MTC, 2 CEST and 1 NOE pool. Exact definitions are provided on the GitHub repository. For this abstract, the Pulseq-CEST simulation9 results are used as a “reference”. However, in general they are explicitly not considered to be the ground truth!
Results
The “reference” Z-spectra and corresponding MTRasym curves for all four cases are shown in figure 1.The 2 pool simulations (case 1 and 2) of all groups were in good agreement. Largest deviations in Z-spectra were in the order of 2‰ and are thus not shown or further analyzed here. Larger differences were observed for the 5 pool simulations (cases 3 and 4). For case 3, the Z-spectra of all participating groups are depicted in figure 2A and corresponding MTRasym curves in figure 2B. Figure 2C and 2D show the differences with regard to the Pulseq-CEST simulation.
Interestingly, 5 different results/clusters with essential differences are visible in the Z-spectrum differences (Fig. 2C), but only three clusters are visible in the MTRasym curves (Fig. 2B). With respect to the “reference” MTRasym, the differences range between roughly -20% to +50%, which is surprisingly high. Fitting the same data with different models could therefore generate significant different CEST exchange and concentration parameters.
Discussion
Between the participating groups, we observed differences in both, Z-spectra and MTRasym curves. For case 3, 5 different results out of 8 submitted simulations were observed. The origin of these differences was not yet identified at the time of submission. However, they are a clear indication that previously reported differences in quantitative parameters5 could originate from differences in utilized simulations. For example, to achieve comparable MTRasym values at 2 ppm between groups #1 and #3, an increase of roughly 30% in the CEST pool size fraction or a 50% decrease of the exchange rate would be necessary (Fig. 3).Most plausible explanations for the larger deviations in cases 3 and 4 are differences regarding the definition of the MT pool. In particular, the definition of pool size fractions, or the use of x-y-z or only z-components for MT magnetization. However, this cannot be the only reason, because some results match well despite varying simulated MT components.
Furthermore, although the observed deviations for cases 1 and 2 are in the order of 1e-4 and thus comparatively small, they are still several orders of magnitude larger than typical rounding errors. This is a clear indication that the compared simulations must differ in more than just the MT definition.
This project is still open for participation and several discussions about the observed differences are planned. We hope for keen participation and to find the source of differences. The final goal is to realize a consensus on CEST simulationsto and provide a reference that can be used by all groups to validate their CEST simulations.
Conclusion
Although simple continuous-wave cases were investigated, apparent deviations between participating groups have been observed, leading to large difference in quantifiable parameters. We invite everybody to join and validate their own CEST simulations and plan to generate a solid basis for future quantitative CEST approaches. In upcoming challenges, more sophisticated cases will be included to get better understanding of differences in implementations.Acknowledgements
No acknowledgement found.References
1. Zaiss M, Anemone A, Goerke S, et al. Quantification of hydroxyl exchange of D-Glucose at physiological conditions for optimization of glucoCEST MRI at 3, 7 and 9.4 Tesla. NMR Biomed. 2019;32:e4113 doi: 10.1002/nbm.4113.2. Woessner DE, Zhang S, Merritt ME, Sherry AD. Numerical solution of the Bloch equations provides insights into the optimum design of PARACEST agents for MRI. Magn. Reson. Med. 2005;53:790–9 doi: 10.1002/mrm.20408.
3. Longo DL, Sun PZ, Consolino L, Michelotti FC, Uggeri F, Aime S. A general MRI-CEST ratiometric approach for pH imaging: demonstration of in vivo pH mapping with iobitridol. J. Am. Chem. Soc. 2014;136:14333–6 doi: 10.1021/ja5059313.
4. Ward KM, Balaban RS. Determination of pH using water protons and chemical exchange dependent saturation transfer (CEST). Magn. Reson. Med. 2000;44:799–802 doi: 10.1002/1522-2594(200011)44:5<799::aid-mrm18>3.0.co;2-s.
5. Perlman O, Farrar CT, Heo H-Y. MR fingerprinting for semisolid magnetization transfer and chemical exchange saturation transfer quantification. NMR Biomed. 2022:e4710 doi: 10.1002/nbm.4710.
6. Zaiss M, Schuenke P, Herz K. BMsim GitHub Repository. https://github.com/pulseq-cest/BMsim_challenge. Published 2022.
7. Zhou J, Zaiss M, Knutsson L, et al. Review and consensus recommendations on clinical APT-weighted imaging approaches at 3T: Application to brain tumors. Magn. Reson. Med. 2022;88:546–574 doi: 10.1002/mrm.29241.
8. Schuenke P, Windschuh J, Roeloffs V, Ladd ME, Bachert P, Zaiss M. Simultaneous mapping of water shift and B1 (WASABI)-Application to field-Inhomogeneity correction of CEST MRI data. Magn. Reson. Med. 2017;77:571–580 doi: 10.1002/mrm.26133.
9. Herz K, Mueller S, Perlman O, et al. Pulseq-CEST: Towards multi-site multi-vendor compatibility and reproducibility of CEST experiments using an open-source sequence standard. Magn. Reson. Med. 2021;86:1845–1858 doi: 10.1002/mrm.28825.
Figures
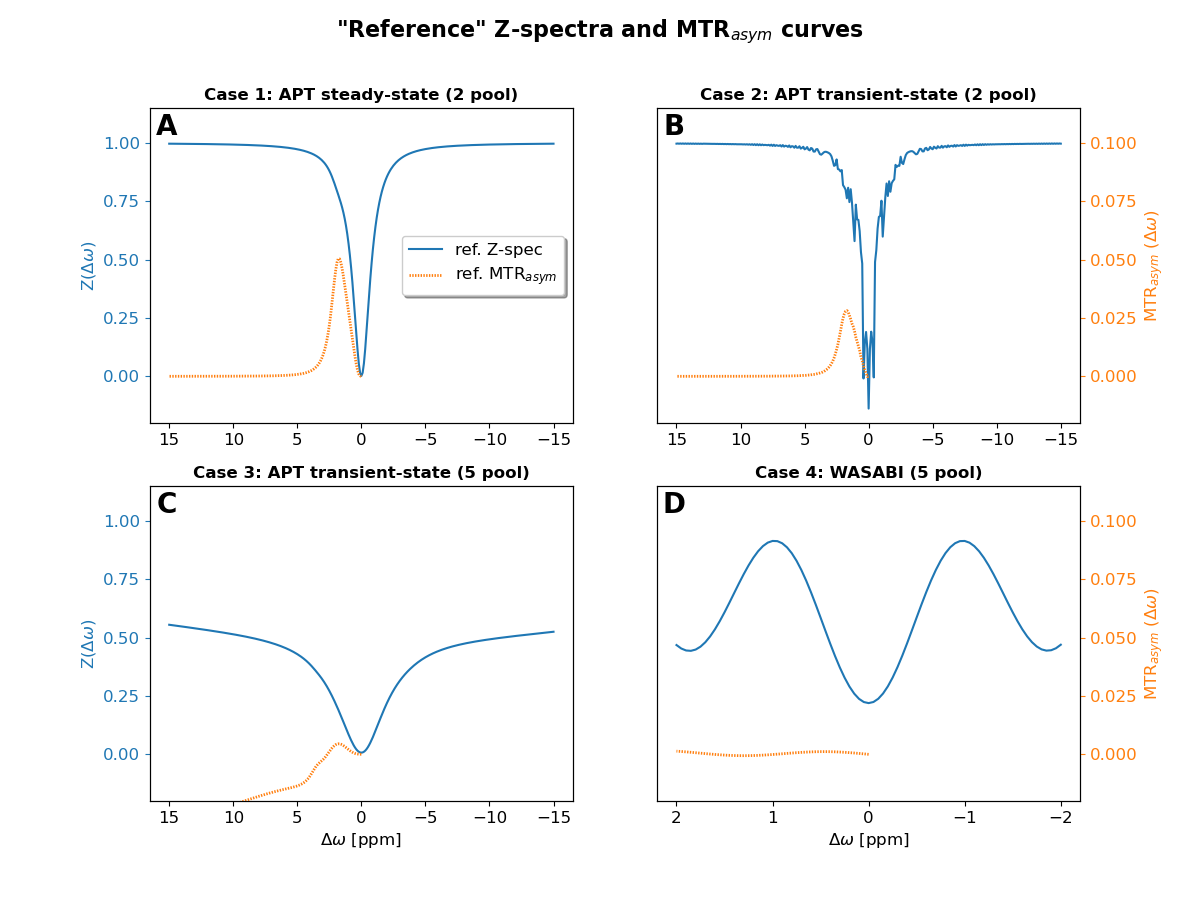
Fig. 1: Z-spectra and MTRasym curves for all four cases created using the Matlab implementation of the Pulseq-CEST simulation. These results were used as "reference" data in this abstract. However, in general they are not considered as ground truth.
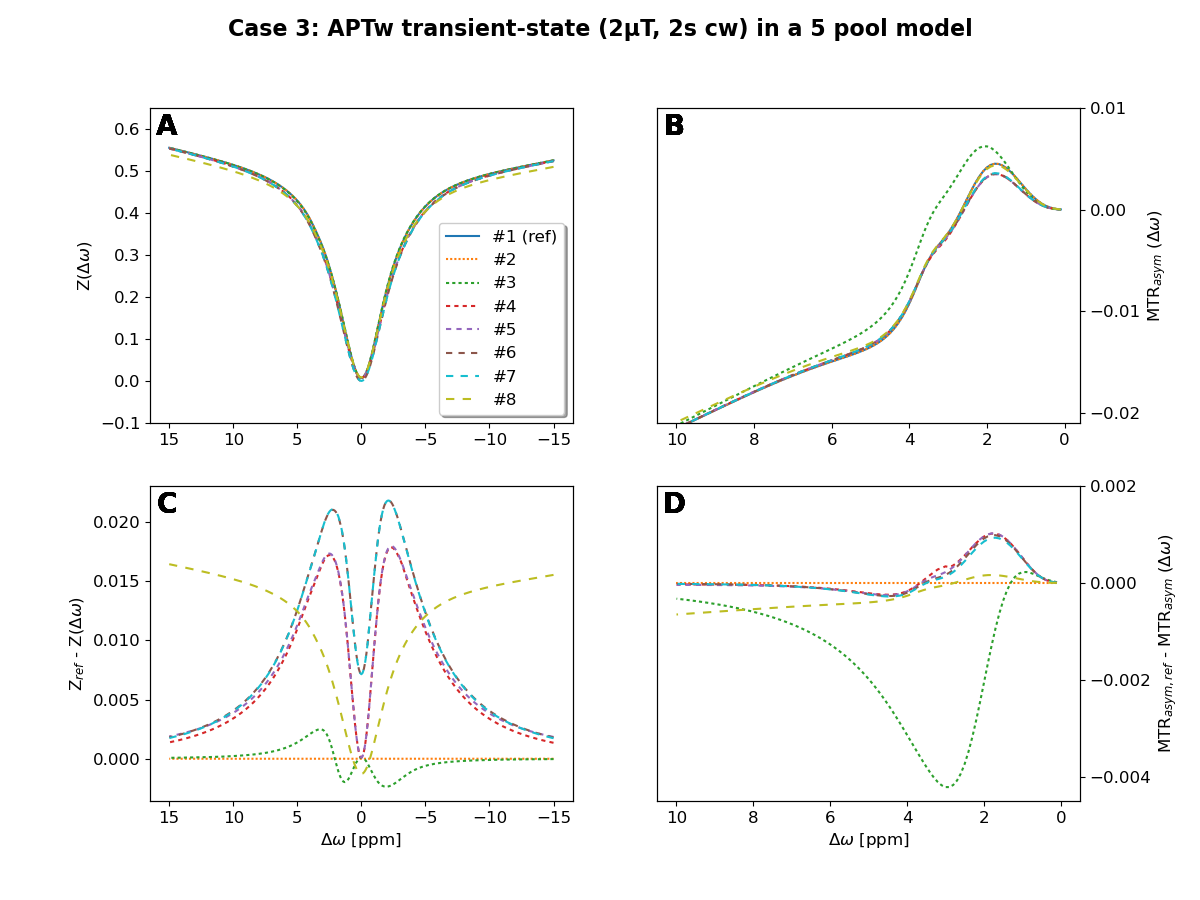
Fig. 2: Comparison of simulation results from all 8 participating CEST research groups for case 3: "APTw transient-state in a 5 pool model". Depicted are the Z-spectra (A), MTRasym curves (B), differences to the Pulseq-CEST "reference" Z-spectrum (C), and differences to the Pulseq-CEST "reference" MTRasym curve (D).
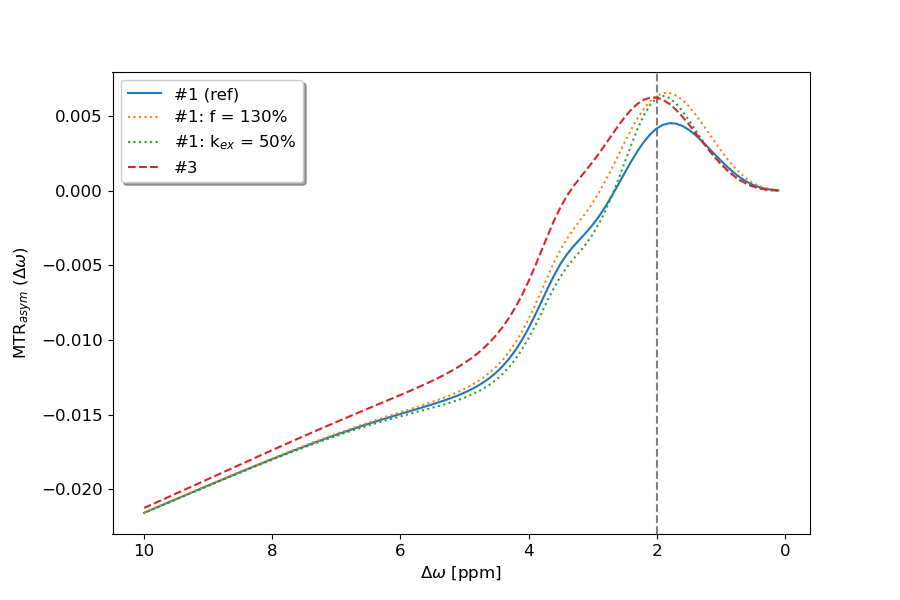
Fig. 3: Comparison of the MTRasym curves of groups #1 and #3 for case 3: "APTw trasient-state in a 5 pool model". To achieve matching MTRasym values at 2 ppm between both groups, group #1 either has to increase the pool size fraction by 30%, or has to decrease the exchange rate by 50%.
DOI: https://doi.org/10.58530/2023/0907