0905
Unraveling contributions to the saturated signal at 3.5 ppm in the Z-spectrum of human brain tumors1Russell H. Morgan Department of Radiology and Radiological Science, Johns Hopkins University, Baltimore, MD, United States
Synopsis
Keywords: CEST & MT, CEST & MT
Increased cytosolic mobile protein content in gliomas causes amide proton transfer (APT) hyperintensity. However, most current APT imaging protocols acquire APT-weighted images that reflect multiple contributions, including residual direct water saturation (or relaxation), semisolid macromolecular magnetization transfer contrast (MTC) asymmetry, and nuclear Overhauser enhancement (NOE) effects, thus limiting the assessment of clean APT. Herein, we separated water, MTC, and APT signal components from RF saturated signals using an MR fingerprinting sequence and evaluated the contributions to the saturation signal at 3.5 ppm in the Z-spectrum of brain tumors.Introduction
Amide proton transfer (APT) MRI has been used successfully to image protein content and pH, allowing tumor grading, differentiating active recurrence tumor from treatment effects, and possibly assessing isocitrate dehydrogenase status1-6. However, a conventional APT-weighted signal has interfering contributions, such as direct water saturation and magnetization transfer contrast (MTC) effects, because water and semisolid macromolecular protons are also saturated due to overlap in the chemical shift7. Various tissue relaxation and exchange properties can differently influence on the APT contrast8,9. To make matters worse, the degree to which water and MTC-related parameters contribute at 3.5 ppm relies highly on RF saturation parameters7,8. In this study, we measured water and MTC effects using a deep-learning MR fingerprinting (MRF) and evaluated the influence of the confounding factors on measured Z-spectra and APT contrast in brain tumors.Methods
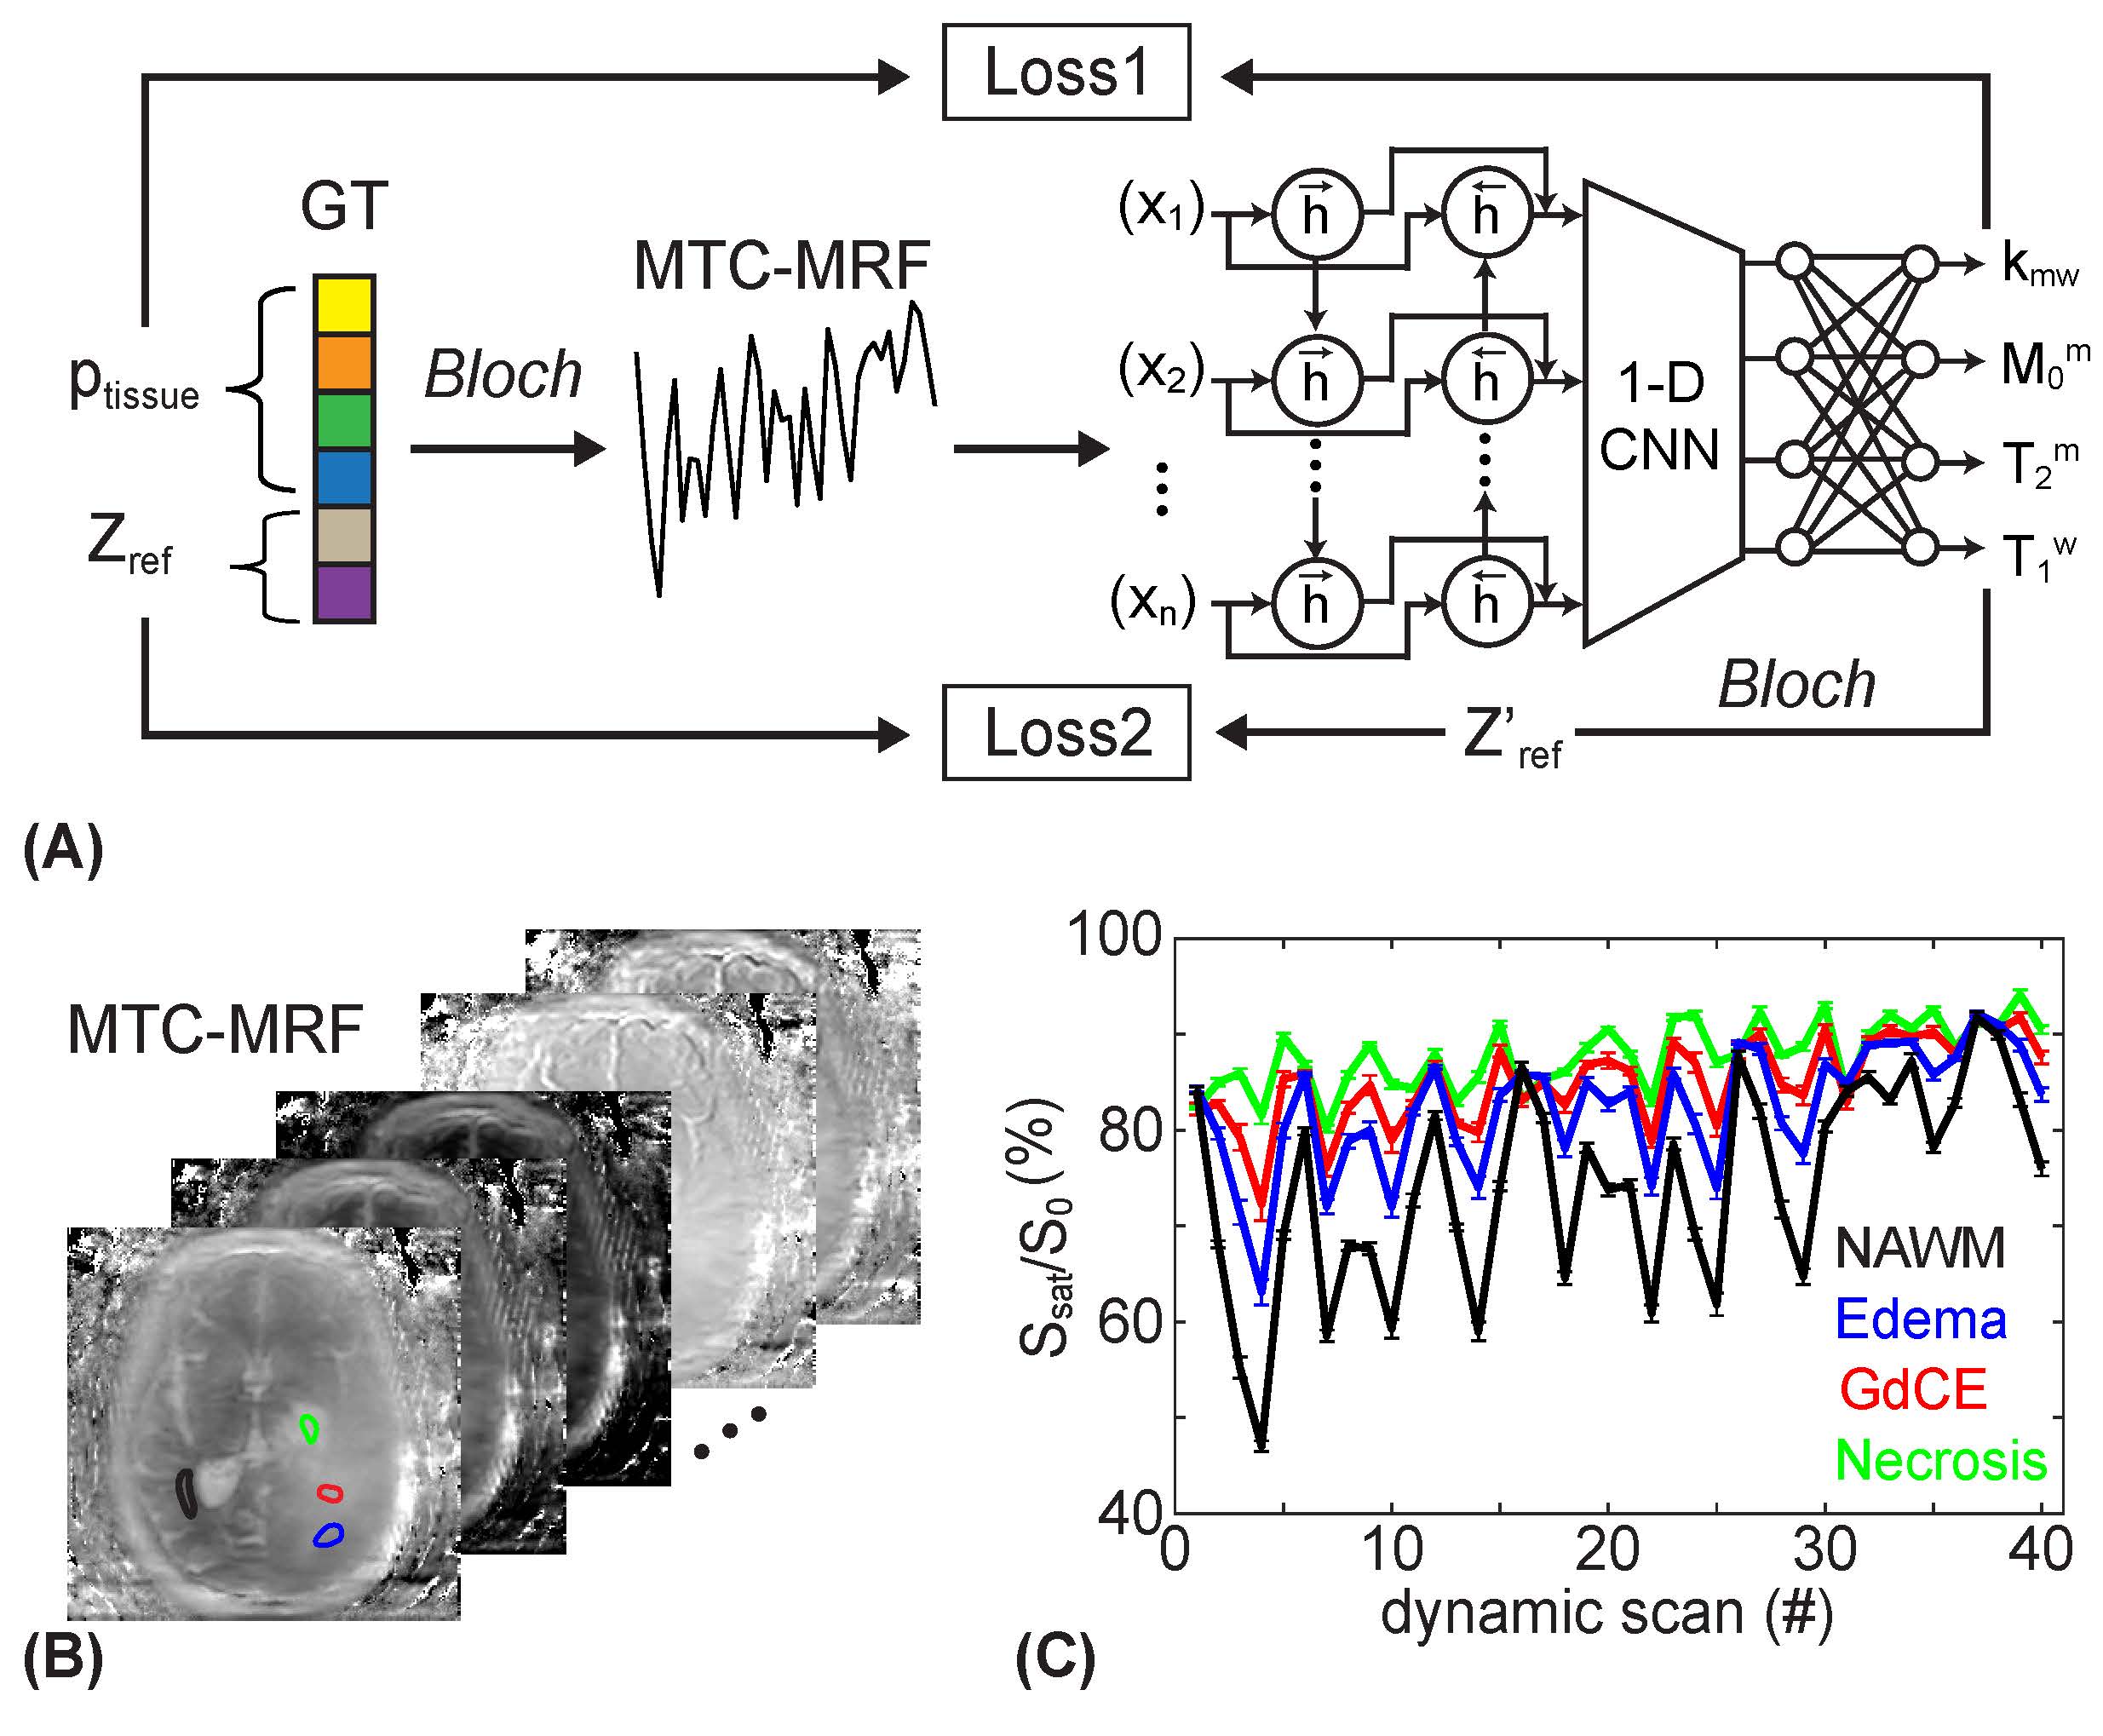
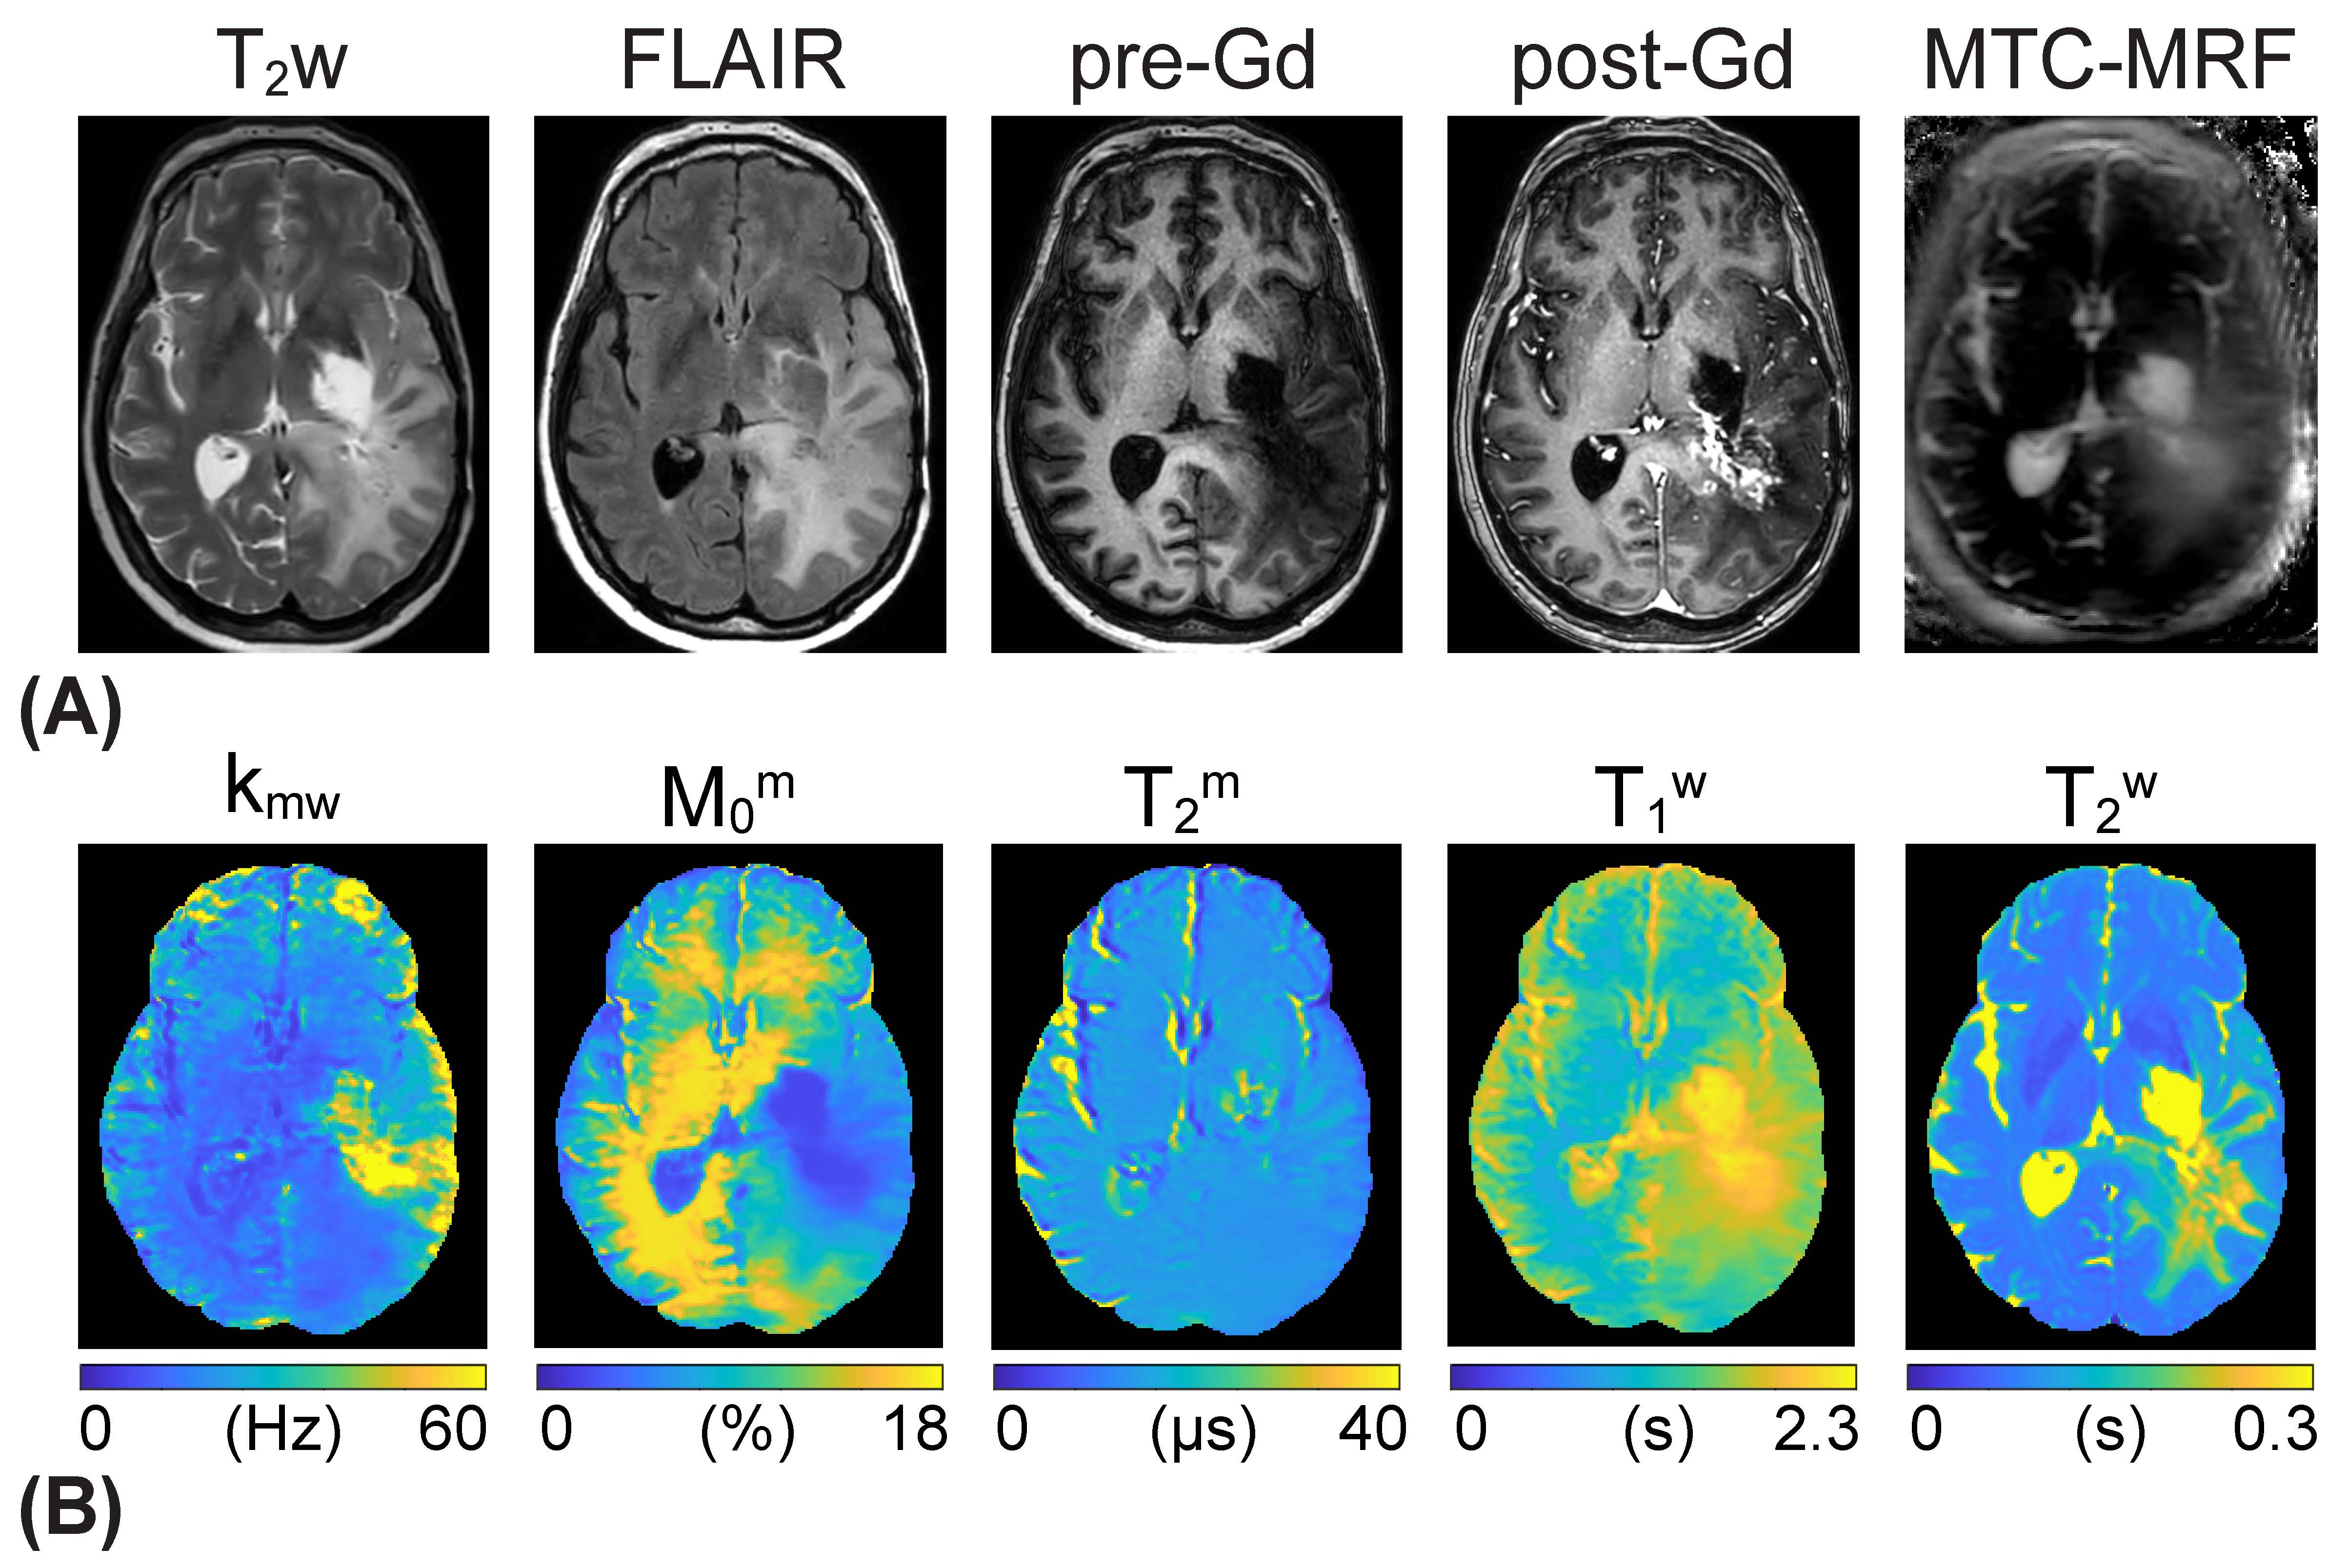
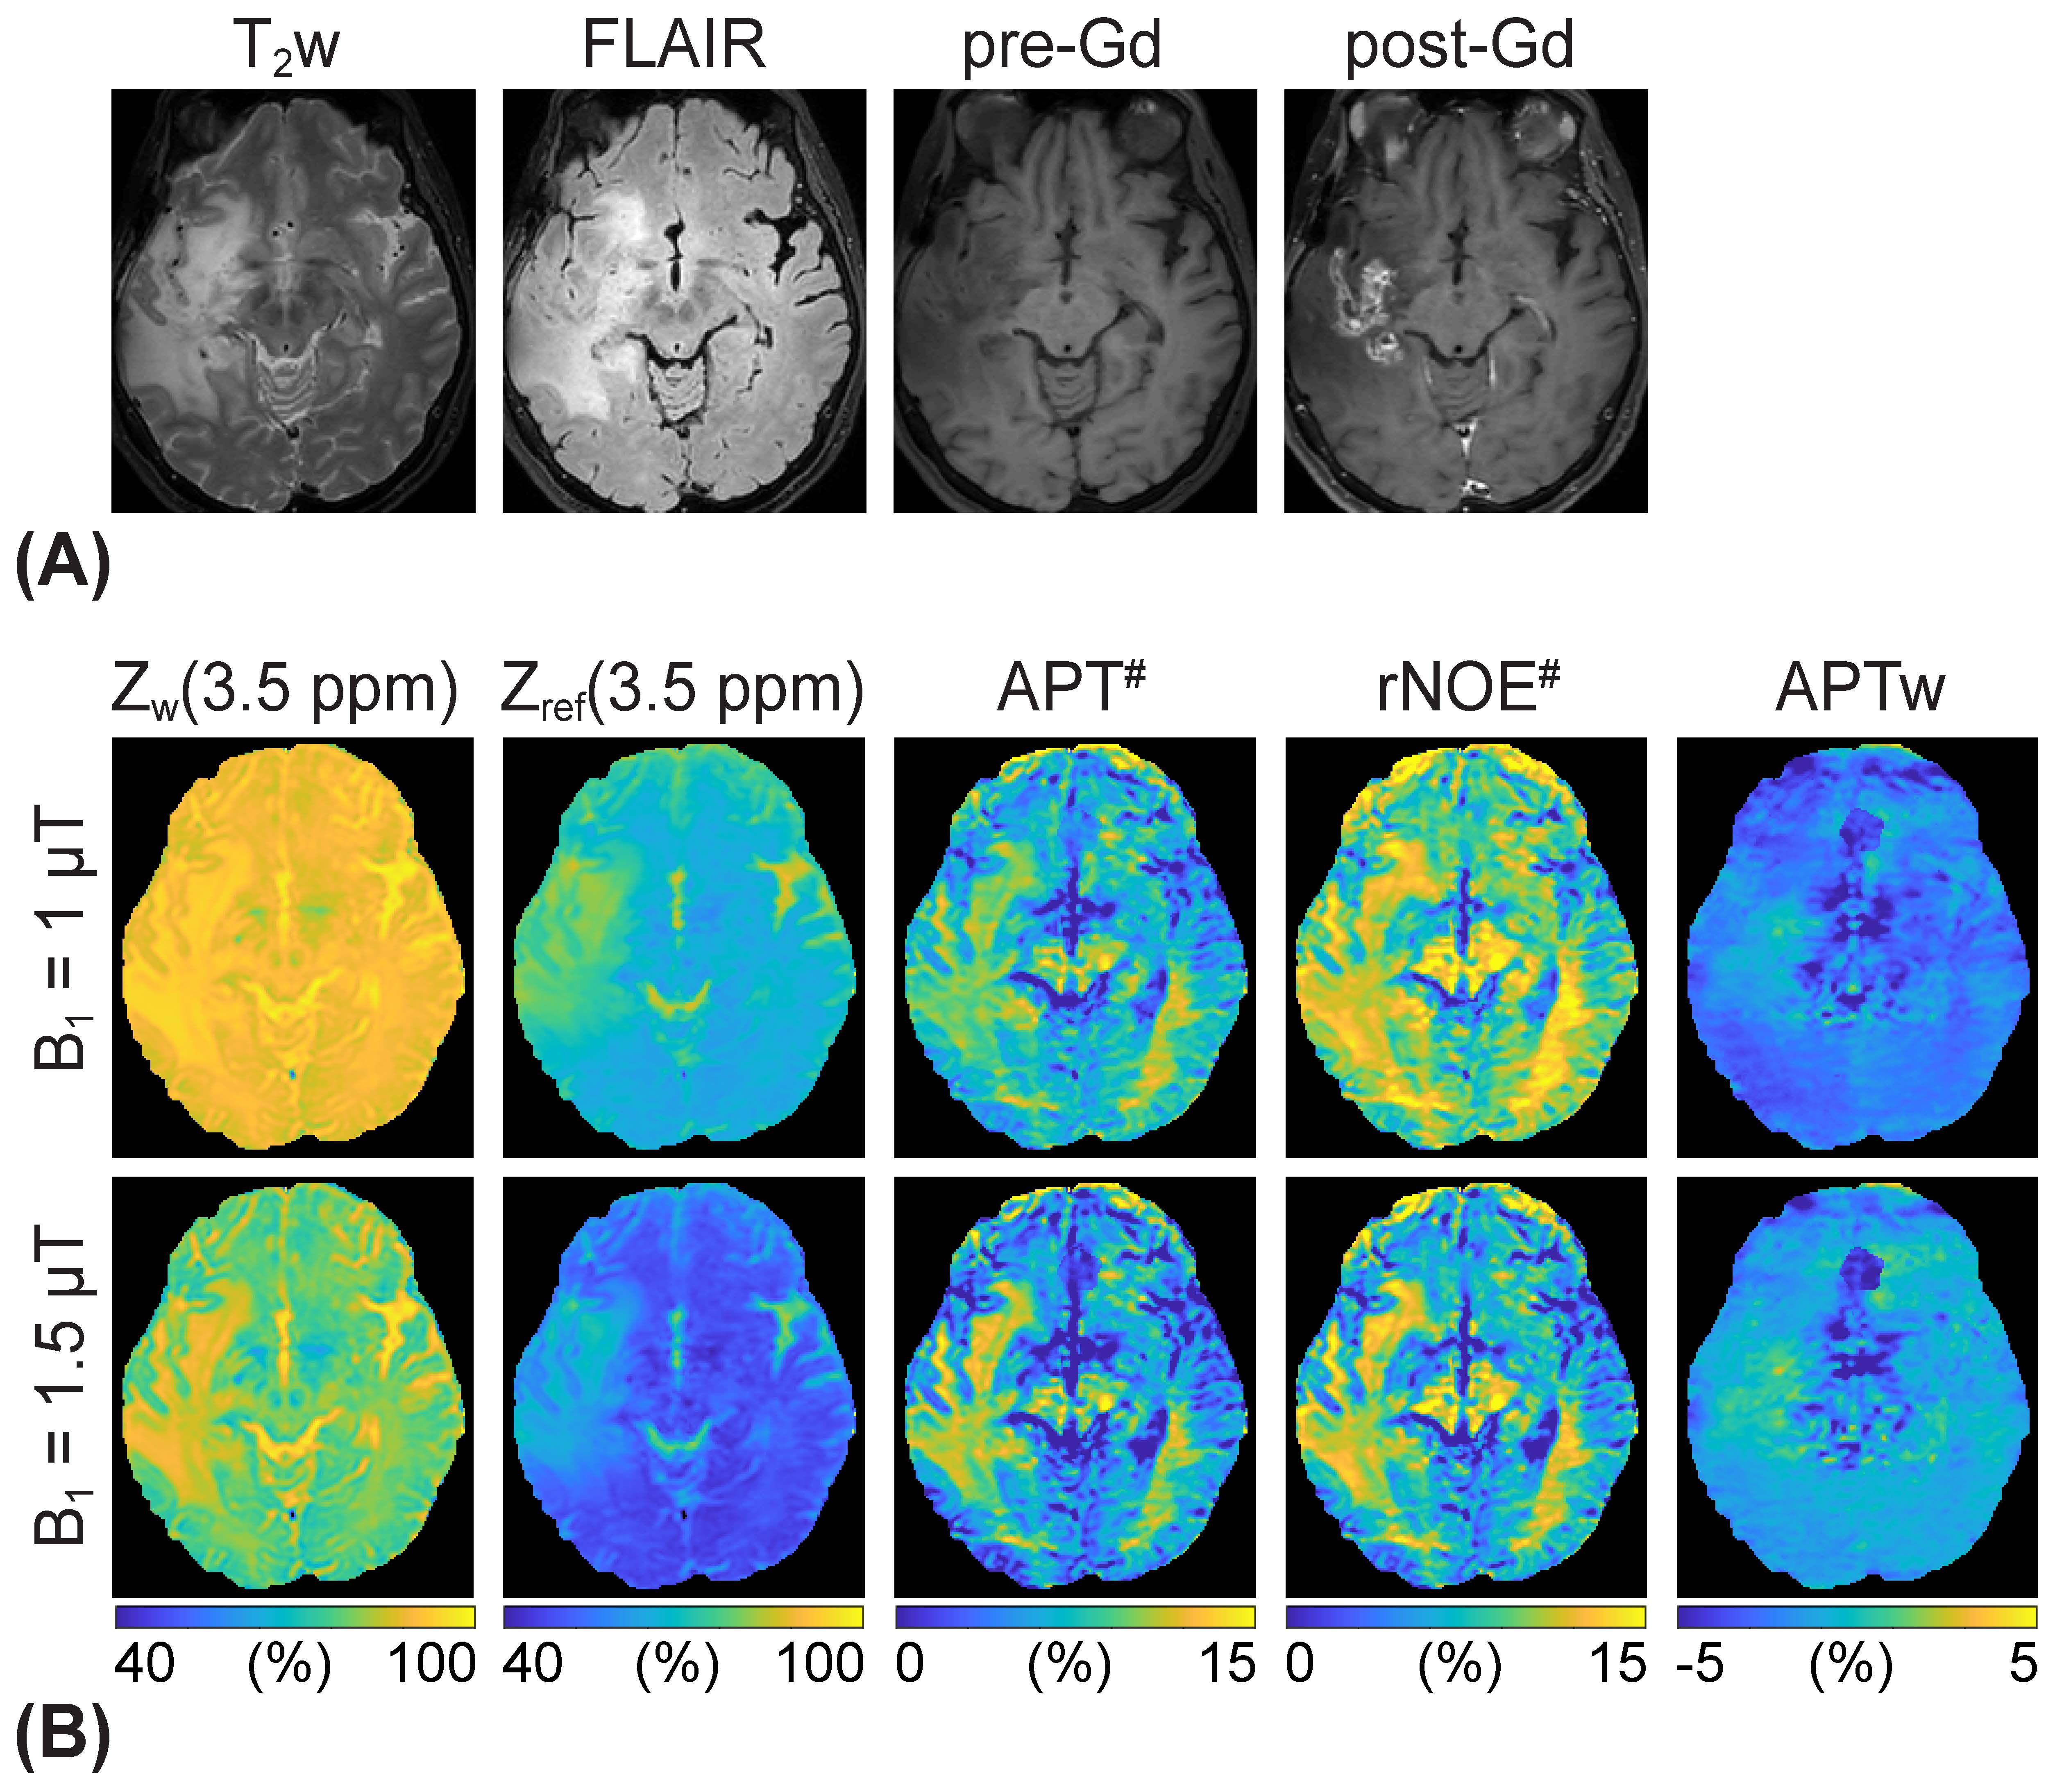
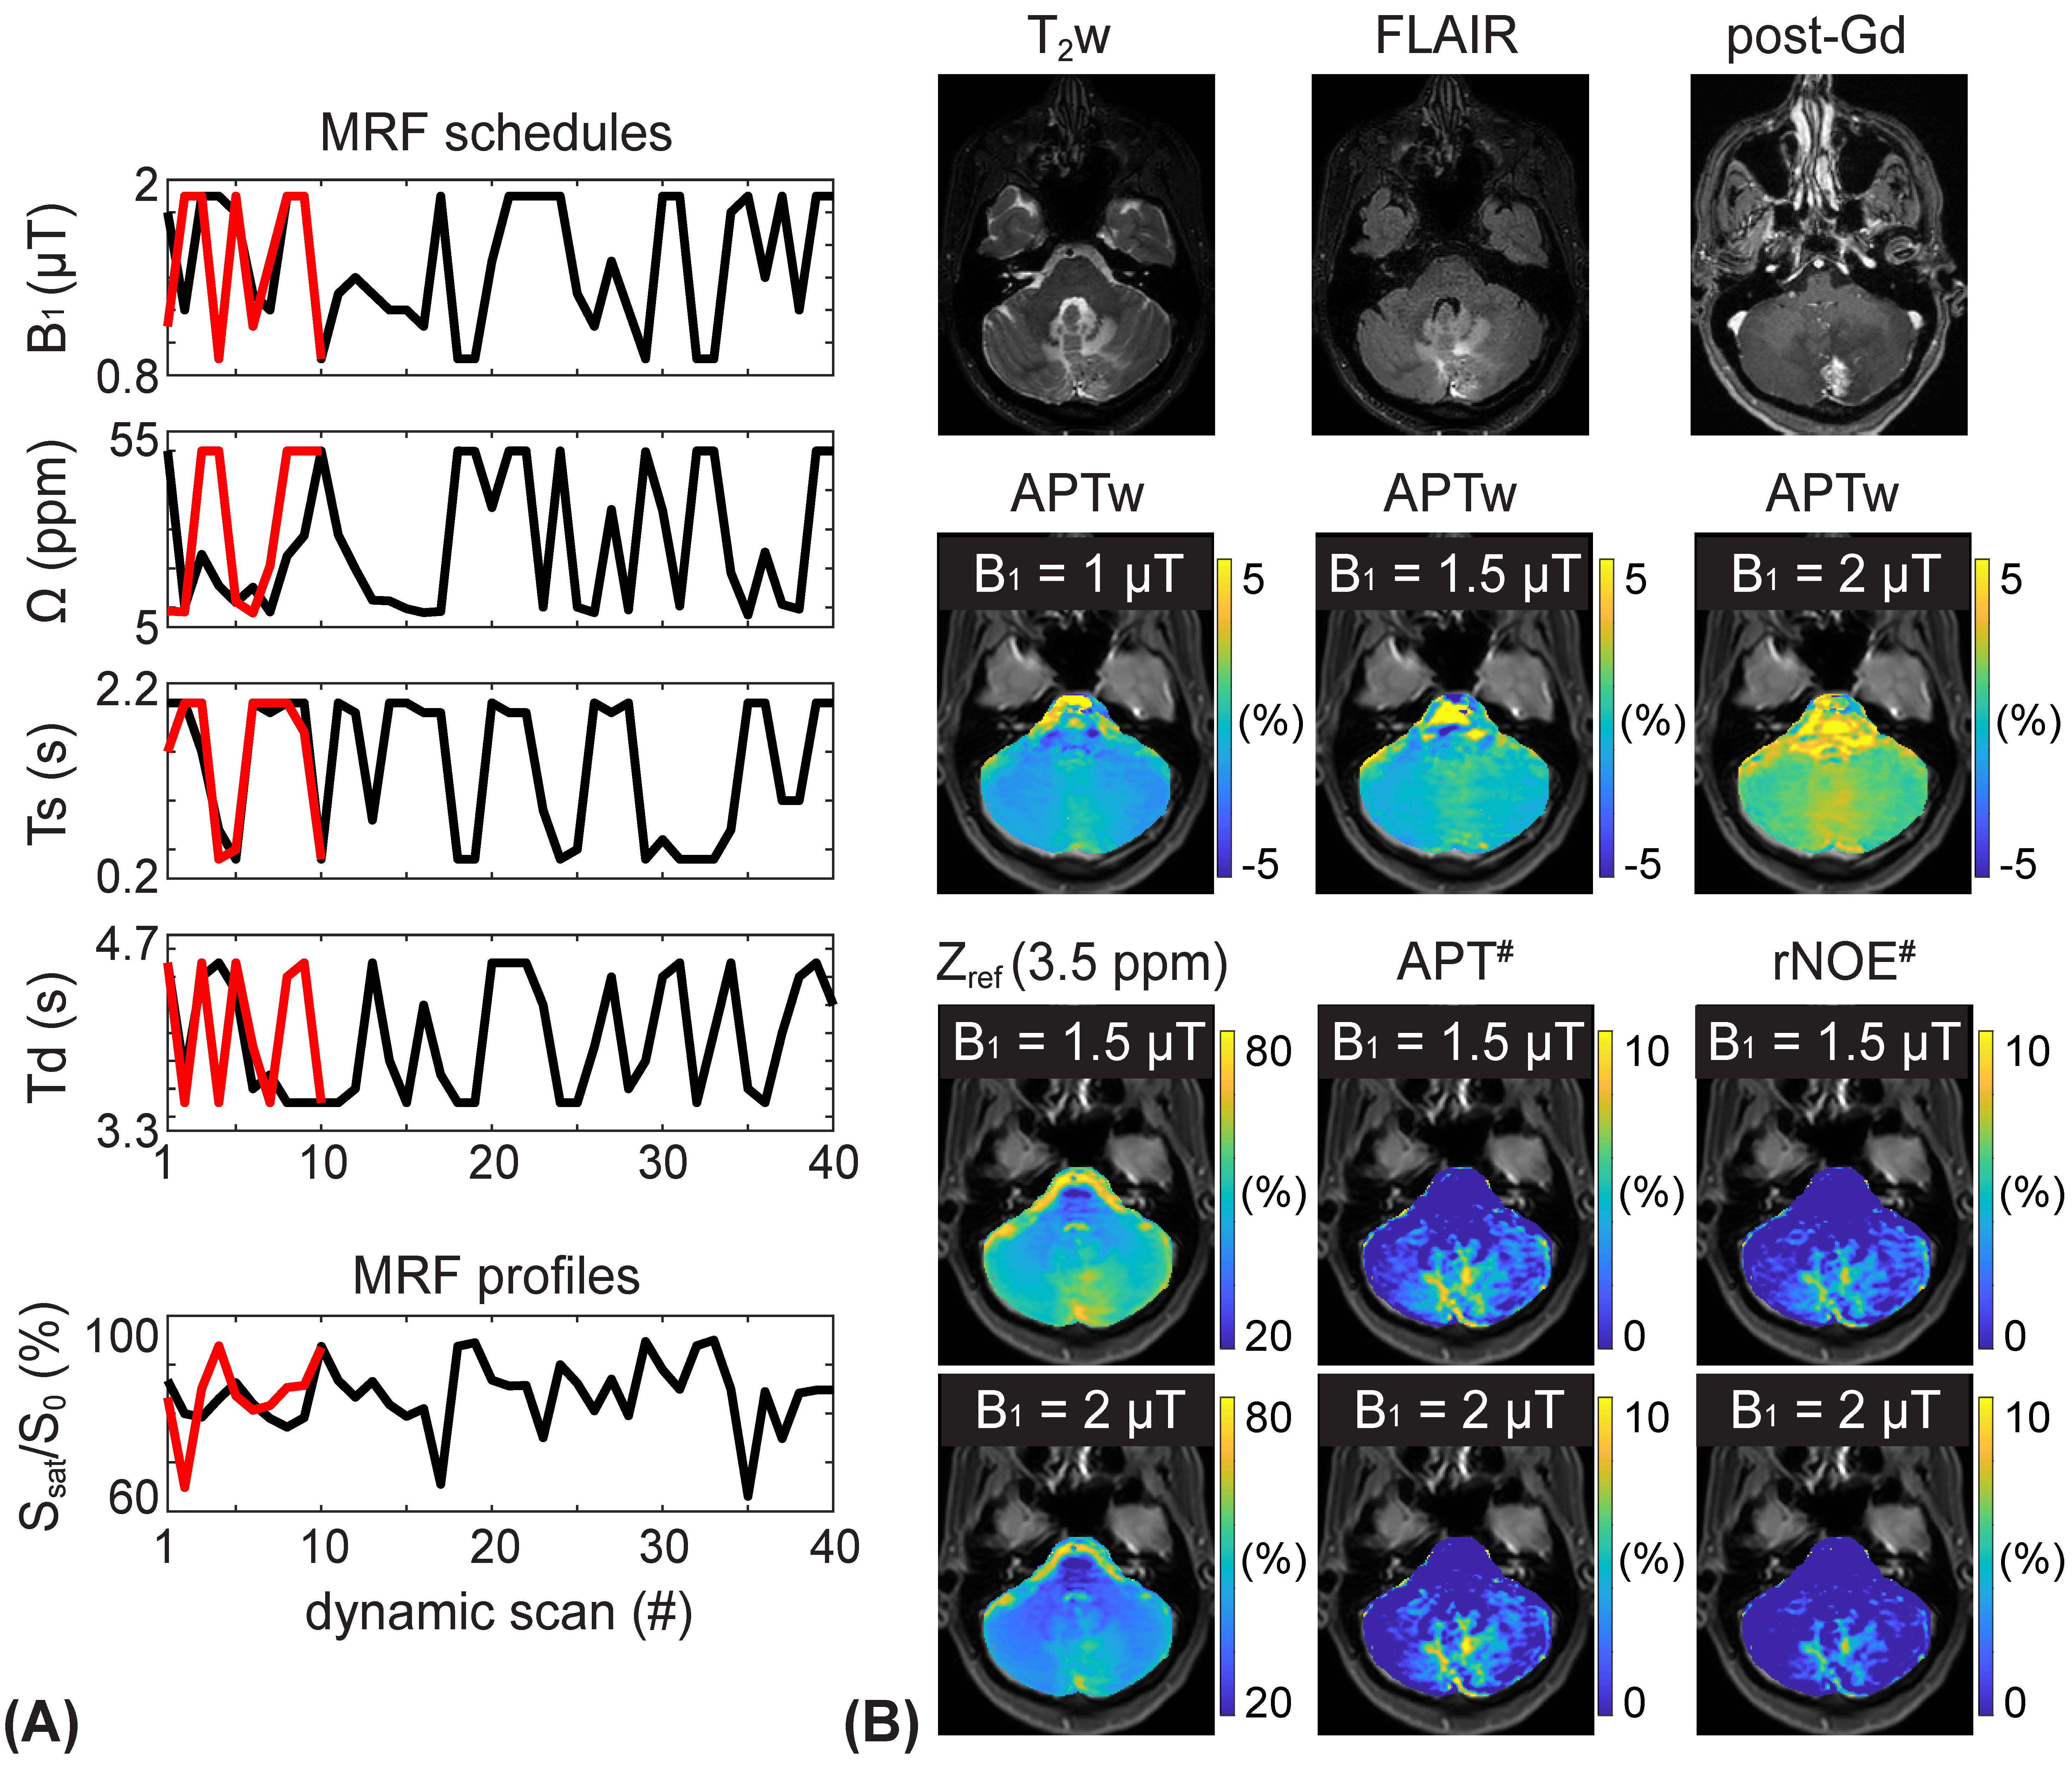
To solve an inverse problem of Bloch equations, a recurrent neural network was designed to learn the non-linear relation between a high-dimensional MRF space and a low-dimensional tissue parameter space. The reconstruction framework was trained to estimate high-fidelity tissue parameters and MTC signal intensities (Fig. 1A). The size of training dataset was 40 million. Ten patients with high-grade brain tumors (glioblastoma, mean age 62 years) were scanned at 3T after informed consent was obtained in accordance with IRB requirements. MRF images were acquired using a fat-suppressed 3D fast spin-echo sequence with optimized MRF schedules consisting of varied RF saturation strength (B1), frequency offset (Ω), saturation time (Ts), and relaxation delay time (Td)10. The MRF reconstruction framework estimated free water T1 relaxation time (T1w), MTC exchange rate (kmw), concentration (M0m), T2 relaxation time (T2m), and MTC signal intensities at ±3.5 ppm corresponding to RF saturation B1 of 1, 1.5, and 2 µT that further are used for APT and NOE image calculation. Water Z-spectra (Zw) and MTC Z-spectra (Zref) were estimated by solving two-pool Bloch equations with the estimated tissue parameters and scan parameters. Water (water#) and MTC (MTC#) signal contributions at 3.5 ppm were calculated as follows: water# = 1 – Zw(3.5ppm); MTC# = Zw(3.5ppm) – Zref(3.5ppm). Corresponding APT# and NOE# images were calculated as Zref(±3.5 ppm) – Zlab(±3.5 ppm) where Zlab are acquired images. For statistical analysis, four ROIs were in: tumor core (enhancing tumor region on post-gadolinium T1w, GdCE); normal appearing white matter (NAWM); edema (hyperintense on T2w) and necrosis (hypointense non-enhancing tumor region on post-Gd T1w).Results and Discussion
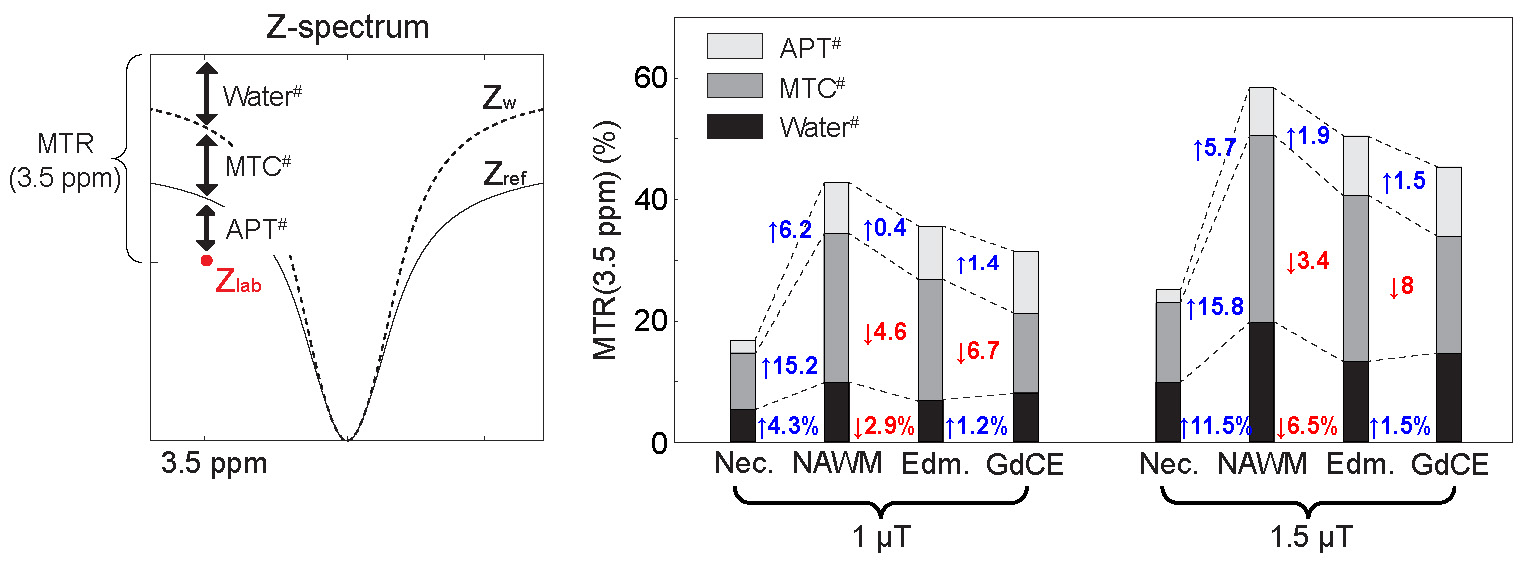
The application of the varied RF saturation parameters increased the spatiotemporal incoherence and generated unique signal patterns from different tissues (Figs. 1B-C). Quantitative tissue parameter maps were obtained from patients with glioblastoma using the deep-learning MRF reconstruction (Fig. 2). Distinct features of the water and MTC-related parameters were observed in the tumor compared to the normal tissue. Furthermore, water and MTC baseline images were synthesized by solving the Bloch equations. The water effect was higher in the tumor core and edema than the normal tissue and the MTC (= 1 - Zref) effect increased at a higher B1 (Fig. 3). Overall APT# intensities of the tumor core and edema were higher than those of the normal tissue at B1 of 1 and 1.5 µT. However, the APT# image at 1.5 µT was more sensitive for tumor localization. The NOE# signals were larger than the APT# signals so that APTw signals became negative. By learning-based optimization of MRF schedule (red lines in Fig. 4A)11, four-fold reduction in scan time (1:05 min for nine slices with a resolution of 1.8 x 1.8 x 4 mm3) was achieved without compromising reconstruction accuracy. The APT# contrast between GdCE or edema and normal tissues became more pronounced at 2 µT because the APT# signal of the normal tissue was decreased. In addition, the APTw image became positive at 2 µT mostly due to the reduced NOE# contribution. As shown in Fig. 5, the dominant contribution to the saturation effect at 3.5 ppm was from water and MTC effects, but 25-30% of the saturated signal in the GdCE (13-20% for the normal tissue) was due to the amide proton transfer effect. The APT# signal of the GdCE were significantly higher than that of the normal tissue at all RF saturation strengths (10.1% vs 8.3% at 1 µT, 11.2% vs. 7.8% at 1.5 µT, p < 0.05) while the APT# signals seemed slightly lower in the edema than in the GdCE, but the differences were statistically not significant. As a function of RF saturation strengths increasing from 1 to 1.5 µT, the ROI-average water and MTC effects were greatly increased from 7.3% to 13.7% and from 16.6% to 22.9%, respectively. However, the APT effect was increased by only 0.4% probably due to the lower concentration of amide protons compared to water and semisolid MTC pools.Conclusions
The RF saturation-encoded MRF allowed for quantitative measures of water and semisolid macromolecule components within a short scan and reconstruction times. The quantitative parameter estimation enabled us to linearly separate signal contributions on an acquired saturation signal at APT frequency offset. While free water and semisolid macromolecules are the main contributors in the measured Z-spectra at 3.5 ppm, significant APT contrast between Gd-enhanced region and normal tissues was observed.Acknowledgements
This work was supported in part by grants from the National Institutes of Health.References
1. Zhou J, Tryggestad E, Wen Z, Lal B, Zhou T, Grossman R, Wang S, Yan K, Fu D-X, Ford E, Tyler B, Blakeley J, Laterra J, van Zijl PCM. Differentiation between glioma and radiation necrosis using molecular magnetic resonance imaging of endogenous proteins and peptides. Nature Med 2011;17:130-134.
2. Zhou J, Heo HY, Knutsson L, van Zijl PCM, Jiang S. APT-weighted MRI: Techniques, current neuro applications, and challenging issues. J Magn Reson Imaging 2019;50(2):347-364.
3. Jiang S, Zou T, Eberhart CG, Villalobos MAV, Heo HY, Zhang Y, Wang Y, Wang X, Yu H, Du Y, van Zijl PCM, Wen Z, Zhou J. Predicting IDH mutation status in grade II gliomas using amide proton transfer-weighted (APTw) MRI. Magn Reson Med 2017;78(3):1100-1109.
4. Paech D, Windschuh J, Oberhollenzer J, Dreher C, Sahm F, Meissner JE, Goerke S, Schuenke P, Zaiss M, Regnery S, Bickelhaupt S, Baumer P, Bendszus M, Wick W, Unterberg A, Bachert P, Ladd ME, Schlemmer HP, Radbruch A. Assessing the predictability of IDH mutation and MGMT methylation status in glioma patients using relaxation-compensated multipool CEST MRI at 7.0 T. Neuro Oncol 2018;20(12):1661-1671.
5. Zaiss M, Windschuh J, Goerke S, Paech D, Meissner JE, Burth S, Kickingereder P, Wick W, Bendszus M, Schlemmer HP, Ladd ME, Bachert P, Radbruch A. Downfield-NOE-suppressed amide-CEST-MRI at 7 Tesla provides a unique contrast in human glioblastoma. Magn Reson Med 2017;77(1):196-208.
6. Park JE, Kim HS, Park SY, Jung SC, Kim JH, Heo HY. Identification of Early Response to Anti-Angiogenic Therapy in Recurrent Glioblastoma: Amide Proton Transfer-weighted and Perfusion-weighted MRI compared with Diffusion-weighted MRI. Radiology 2020:191376.
7. van Zijl PCM, Lam WW, Xu J, Knutsson L, Stanisz GJ. Magnetization Transfer Contrast and Chemical Exchange Saturation Transfer MRI. Features and analysis of the field-dependent saturation spectrum. Neuroimage 2018;168:222-241.
8. Heo HY, Lee DH, Zhang Y, Zhao X, Jiang S, Chen M, Zhou J. Insight into the quantitative metrics of chemical exchange saturation transfer (CEST) imaging. Magn Reson Med 2017;77(5):1853-1865.
9. Zaiss M, Xu J, Goerke S, Khan IS, Singer RJ, Gore JC, Gochberg DF, Bachert P. Inverse Z-spectrum analysis for spillover-, MT-, and T1 -corrected steady-state pulsed CEST-MRI - application to pH-weighted MRI of acute stroke. NMR Biomed 2014;27:240-252.
10. Kim B, Schar M, Park H, Heo HY. A deep learning approach for magnetization transfer contrast MR fingerprinting and chemical exchange saturation transfer imaging. Neuroimage 2020;221:117165.
11. Kang B, Kim B, Park H, Heo HY. Learning-based optimization of acquisition schedule for magnetization transfer contrast MR fingerprinting. NMR Biomed 2022;35(5):e4662.
Figures