0904
Fluid-Suppressed APTw is more accurate than Leakage-Corrected rCBV imaging in the distinction between tumor progression and radionecrosis1Department of Neurosurgery, Assistance Publique-Hôpitaux de Paris, Groupe Hospitalier Pitié-Salpêtrière-Charles-Foix, Paris, France, 2Sorbonne University, ICM, Paris, France, 3Department of R&D Advanced Applications, Olea Medical, La Ciotat, France, 4Department of Radiology, Nancy Regional University Hospital Centre, Nancy, France, 5Department of Radiation-Oncology, Assistance Publique-Hôpitaux de Paris, Groupe Hospitalier Pitié- Salpêtrière-Charles-Foix, Paris, France, 6Department of Neurosurgery, Assistance Publique-Hôpitaux de Paris, Groupe Hospitalier Pitié- Salpêtrière-Charles-Foix, Paris, France, 7Siemens Healthcare GmbH, Erlangen, Germany, 8Department of Neuroradiology, Friedrich-Alexander Universität Erlangen-Nürnberg (FAU), Erlangen, Germany
Synopsis
Keywords: CEST & MT, Tumor, APTw Imaging, Perfusion, Metastases, Radionecrosis, Tumor Progression
The distinction between radionecrosis and tumor recurrence is a common diagnostic dilemma, as current advanced multiparametric MRI protocols lack on accuracy. Fluid-Suppressed Amide Proton Transfer weighted (APTw) imaging has strong potentials in brain tumor post-therapeutic assessment. In this study we compare at 3T the diagnostic accuracy of Fluid Suppressed APTw with the most used advanced technique, i.e. the Leakage-Corrected relative Cerebral Blood Volume imaging obtained by DSC perfusion in 22 pre-irradiated metastases. Results show that Fluid-Suppressed APTw metrics can clearly make a distinction between these two pathologies, in contrast to Leakage-Corrected rCBV contrast.Introduction
Stereotactic radiosurgery (SRS) is an effective therapy for brain metastases1,2. After SRS, radiation-induced enhancing lesions occur frequently, mimicking neoplastic recurrence. The distinction between tumor progression and radionecrosis currently relies on Dynamic Susceptibility Contrast (DSC) perfusion, despite its limitations3. Amide Proton Transfer weighted (APTw) imaging4 enables to measure the chemical exchange saturation transfer (CEST) contrast between mobile peptide/protein amide hydrogen protons and bulk-water ones. This molecular technique promises to help in the assessment of treatment response, as tumor hypercellularity increases APTw signal intensity compared with lower cellular density of therapeutic remnants5. Recent works have introduced new post-processing metrics which allow to correct the increase of APTw signal intensity which occurs in liquid components in brain6. Fluid-suppressed (F.S.) APTw metric is useful to mitigate hemosiderin and cystic post-therapeutic remnants, which is frequently encountered in previously irradiated tumors, possibly leading to false positives in APTw images. In our previous work7, it was shown how F.S.APTw metrics led to an improved discrimination between metastasis recurrence and radionecrosis, compared to the asymmetry-based APTw metric. The aim of this study is to compare the diagnostic accuracy of the F.S.APTw imaging and DSC perfusion relative Cerebral Blood Volume (rCBV) imaging in the context of this common clinico-radioligical dilemma.Methods
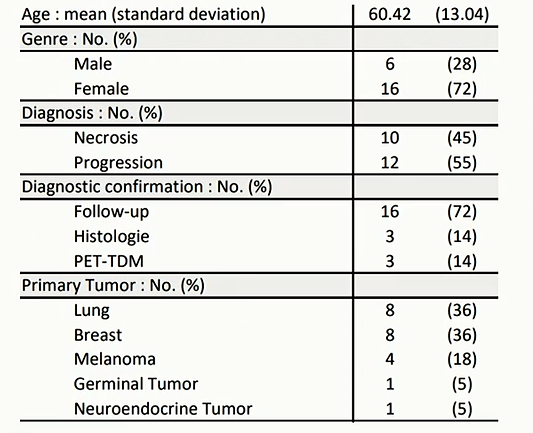
Patient Population:Twenty-two subjects (see Table1 for more details) were prospectively recruited with the inclusion criteria of an enlarging lesion after focal single dose of Gamma-Knife SRS for brain metastasis. Among 22 cerebral lesions, 10 (45%) showed to be radionecrosis and 12 (55%) tumoral progression. Diagnosis of tumor progression or radionecrosis was assessed by either (i) histological examination or (ii) at least 6 months imaging follow-up or (iii) CT-PET imaging.
Magnetic Resonance Imaging Acquisitions:
Patient MRI data were acquired on a 3 Tesla MR scanner (MAGNETOM Skyra, Siemens, Erlangen, Germany) with a 64-channel head and neck coil. The APTw protocol (WIP816B, 3:07 minutes,1.7x1.7x5 mm3, 12 slices) was performed with a 3D snapshot-GRE sequence8, setting a B1 mean value of 2.22 μT and a Duty Cycle of 55%. The WASAB1 protocol9 (WIP816B, 2:03 minutes) was performed for simultaneous B0 and B1 mapping. DSC perfusion was acquired after a single dose of gadolinium-chelated contrast agent (0.1 mmol/kg) and a low flip angle (1:30 minutes, 1.8x1.8x3mm3, 30 slices). Structural axial 3D FLAIR, susceptibility imaging and axial 3D T1 spin echo sequences before and after contrast injection were also acquired.
Data Post-Processing:
Olea Sphere 3.0 software (Olea Medical, La Ciotat, France) was used to (i) post-process APTw, WASAB110 and DSC perfusion data, (ii) calculate F.S. APTw and leakage-corrected rCBV (L.C.rCBV) maps, (iii) co-register F.S. APTw and L.C.rCBV maps with structural sequences, (iv) delineate regions of interest (ROIs) in the lesion and in the contralateral normal appearing white matter (cNAWM). ROIs were drawn by a neuroradiologist with a two year of neuro-oncologic expertise. The following formula was used for the calculation of Fluid-Suppressed APTw map6 voxelwise:
$$F.S.APT_w = (Zlab-Zref) \cdot (2- 2 \cdot Zref) $$
where Zlab (Z-Spectrum label) is the Area Under the Curve (AUC) of the linear interpolation of B0-corrected Z-Spectra between 3 and 4 ppm (from water frequency), Zref (Z-Spectrum reference) the AUC between -4 and -3 ppm. $$$\Delta\omega$$$=3.5 ppm is considered as the resonance frequency of amide groups4.
Statistical Analysis:
An independent Student’s t-test was performed in MATLAB, between the two different patient groups (tumor progression and radionecrosis), on:
- the difference between the average F.S.APTw values computed on the ROIs as
$$$\Delta F.S.APT_{W}=F.S.APT_{W}^{lesion}-F.S.APT_{W}^{cNAWM}$$$; - the ratio between the average L.C.rCBV values computed on the ROIs as
$$$\Delta L.C.rCBV=L.C.rCBV^{lesion}/L.C.rCBV^{cNAWM}$$$.
Results
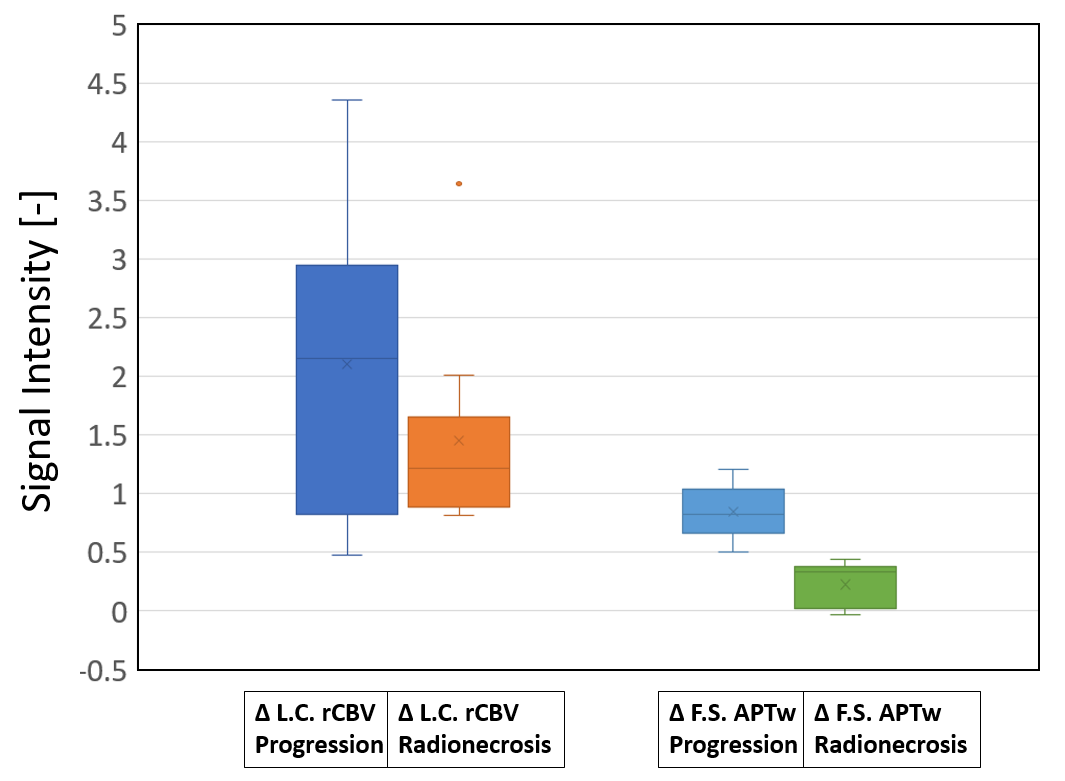
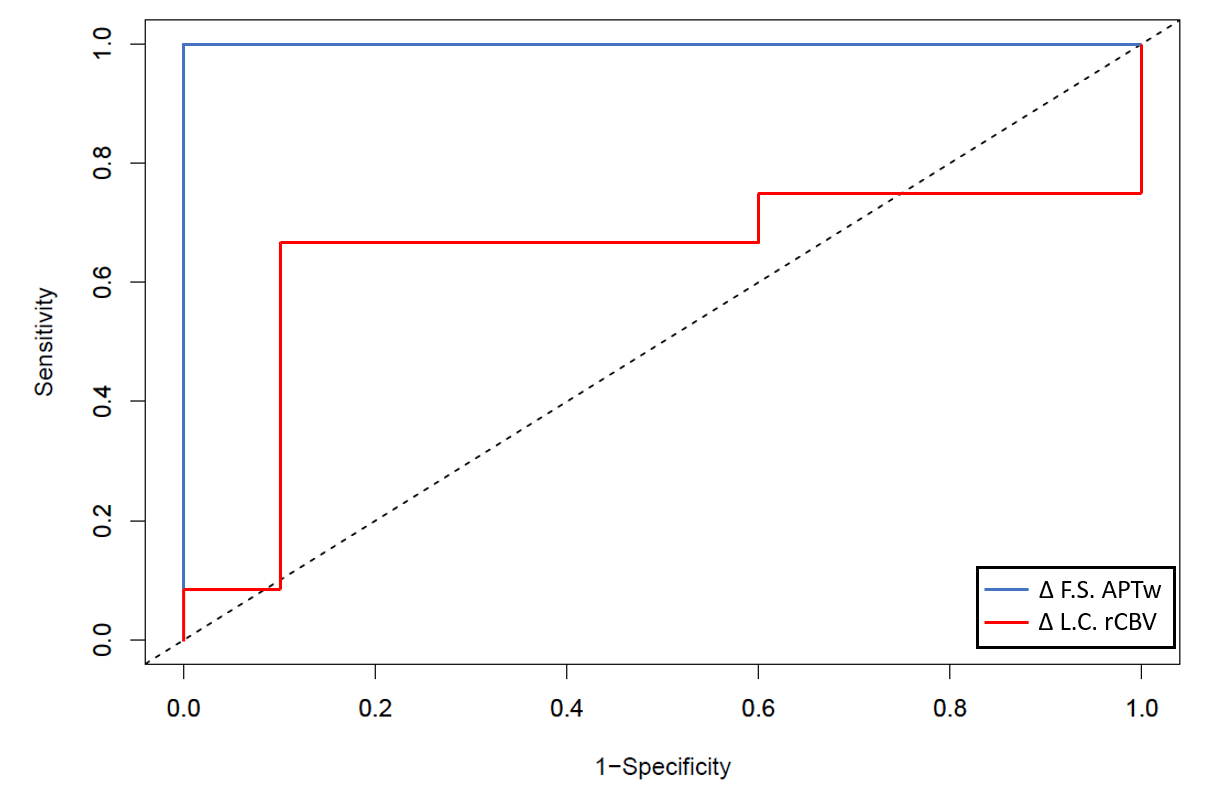
The mean (± std) of ΔF.S.APTw signal intensities (in %) was 0.2267 ± 0.1899 for the radionecrosis group and 0.8436 ± 0.2316 for the tumor progression group. Instead, the mean (± std) of ΔL.C.rCBV values was 1.4504 ± 0.8507 for the radionecrosis group and 2.1021 ± 1.1910 for the tumor progression group. F.S.APTw metric significantly differentiates progression from radionecrosis (p=0.00000148) while rCBV metric does not (p=0.1633). Figure 1 shows the boxplots of ΔF.S.APTw (%) and ΔL.C.rCBV in radionecrosis and tumor-progression group.ROC Curves for ΔL.C.rCBV and ΔF.S.APTw metrics are represented in Figure 2. Area under the ROC Curve were 0.641 for ΔL.C.rCBV metrics (0.506-0.776) and 1 for ΔF.S.APTw metrics (1-1). The optimal cut-off point was 2.08 for ΔL.C.rCBV (in accordance with the previous literature11) and 0.505 for ΔF.S.APTw.
ΔL.C.rCBV metric discriminated cerebral lesions with a sensitivity of 66.7% and specificity of 90%. ΔF.S.APTw metric instead with a sensitivity of 100% and specificity of 100%.
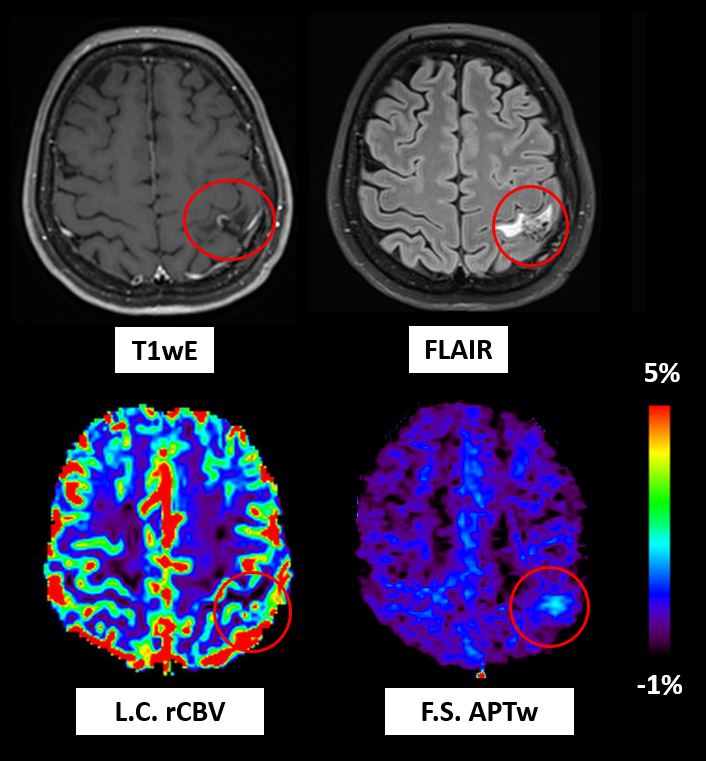
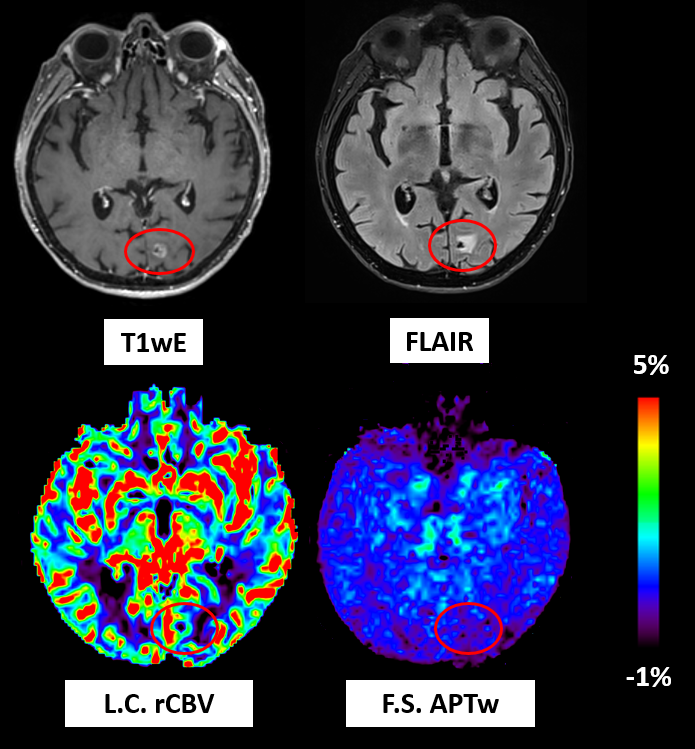
In Figure 3 and Figure 4 are presented two clinical examples showing the added value of F.S.APTw imaging compared to L.C.rCBV, respectively in tumor progression and radionecrosis.
Discussion and Conclusion
This work supports the clinical importance of adding F.S.APTw imaging in post-therapeutic assessment of brain tumor. In this preliminary study, F.S.APTw metrics were more accurate than L.C.rCBV ones in the distinction between tumor recurrence and radio-induced tissue changes in brain metastasis. Despite the encouraging results of the F.S.APTw metric, these must be explored on a larger patient cohort. Higher Duty-Cycle (90%) for APTw imaging12 and new metric for suppressing fluid contrast13 will be tested in our future studies.Acknowledgements
No acknowledgement found.References
1- Suh JH, Kotecha R, Chao ST, Ahluwalia MS, Sahgal A, Chang EL. Current approaches to the management of brain metastases. Nature reviews. Clinical oncology. 2020 May;17(5):279-99.
2- Valiente M, Ahluwalia MS, Boire A, Brastianos PK, Goldberg SB, Lee EQ, Le Rhun E, Preusser M, Winkler F, Soffietti R. The evolving landscape ofbrain metastasis. Trends in cancer. 2018 Mar 1;4(3):176-96.
3- Pope WB. Brain metastases: neuroimaging. Handbook of clinical neurology. 2018 Jan 1;149:89-112.
4- Ma BO, Blakeley JO, Hong X, Zhang H, Jiang S, Blair L, Zhang Y, Heo HY, Zhang M, van Zijl PC, Zhou J. Applying amide proton transfer‐weighted MRI to distinguish pseudoprogression from true progression in malignant gliomas. Journal of Magnetic Resonance Imaging. 2016 Aug;44(2):456-62.
5- Nichelli L, Casagranda S. Current emerging MRI tools for radionecrosis and pseudoprogression diagnosis. Current Opinion in Oncology. 2021 Nov1;33(6):597-607.
6- Casagranda S, Mancini L, Gautier G, Peter P, Lopez B, Brandner S, de Vita E, Golay X, Bisdas S. Fluid suppression in CEST imaging affects predominantly IDH-mutant 1p/19q retained gliomas with T2-FLAIR mismatch. Abstract #0500 In ISMRM 29th Annual Meeting 2020.
7- Nichelli L, Jacob J, Leclerq D, Benbelkacem F, Lehéricy S, and Casagranda S. Predicting radionecrosis and recurrent disease through Amide Proton Transfer weighted imaging in brain metastases. Abstract #7682 in ISMRM 31th Annual Meeting 2022.
8- Liebig P, Sedykh M, Herz K, Fabian MS, Mennecke A, Weinmüller S, Schmidt M, Dörfler A, Zaiss M. snapshot CEST++: the next snapshot CEST for fast whole-brain APTw imaging at 3T. arXiv preprint arXiv:2207.00261. 2022 Jul 1.
9- Schuenke P, Windschuh J, Roeloffs V, Ladd ME, Bachert P, Zaiss M. Simultaneous mapping of water shift and B1 (WASABI)—application to field‐inhomogeneity correction of CEST MRI data. Magnetic resonance in medicine. 2017 Feb;77(2):571-80.
10- Papageorgakis C, Firippi E, Gy B, Boutelier T, Khormi I, Al-iedani O, Paton B, Lechner-Scott J, Fazlollahi A, Ponsonby AL, Liebig P, Ramadan S, Zaiss M, and Casagranda S. Fast WASAB1 post-processing for simultaneous B0 and B1 mapping for CEST imaging use in clinical routine. Abstract #2717 in ISMRM 31th Annual Meeting 2022.
11- Galldiks N, Kocher M, Ceccon G, Werner JM, Brunn A, Deckert M, Pope WB, Soffietti R, Le Rhun E, Weller M, Tonn JC. Imaging challenges of immunotherapy and targeted therapy in patients with brain metastases: response, progression, and pseudoprogression. Neuro-oncology. 2020 Jan 11;22(1):17-30.
12- Zhou J, Zaiss M, Knutsson L, Sun PZ, Ahn SS, Aime S, Bachert P, Blakeley JO, Cai K, Chappell MA, Chen M. Review and consensus recommendations on clinical APT‐weighted imaging approaches at 3T: Application to brain tumors. Magnetic Resonance in Medicine. 2022 Apr 22.
13- Zaiss M, Casagranda S, Sedykh M, Liebig P, Papageorgakis C, Mancini L, Bisdas, Schmidt M, Dörfler A. Removing fluid artifacts in APTw:
Why spillover correction and fluid suppression are two sides of the same coin. CEST 2022: 9th International Workshop on
Chemical Exchange Saturation
Transfer Imaging.
https://www.cestworkshop.org/_files/ugd/2bce60_62c7650452454f02a292c0fe6c08134c.pdf (page 33).
Figures