0902
Identification of energy metabolism remodeling in a rat model of Huntington’s disease using multi-metabolic CEST imaging1Université Paris-Saclay, CEA, CNRS, MIRCen, Laboratoire des Maladies Neurodégénératives, Fontenay-aux-Roses, France
Synopsis
Keywords: CEST & MT, CEST & MT, gluCEST and glucoCEST
Huntington’s disease (HD) is an inherited neurodegenerative disease characterized by motor, cognitive and psychiatric symptoms. As glutamate has been shown to be a potential biomarker of neurodegenerative diseases, we used Chemical Exchange Saturation Transfer imaging of glutamate (gluCEST) to map cerebral glutamate distribution in a rat model of HD. Modification of glutamate levels observed at 12 months were preceded by decrease of lactate concentration and reduced glycolytic metabolism measured glucoCEST at 4 months, suggesting early remodeling of energy metabolism during asymptomatic stage.Introduction
Huntington’s disease (HD) is an inherited neurodegenerative disease characterized by motor, cognitive and psychiatric symptoms [1]. Atrophy of the striatum is currently the best biomarker of disease progression but there is an urgent need to identify novel functional biomarkers of disease progression to better understand pathological processes. We have already reported that Chemical Exchange Saturation Transfer imaging of glutamate, or gluCEST [2], can be highly valuable to assess metabolic alterations in a mouse model of HD [3] with a high anatomical resolution. In addition, CEST imaging of glucose, or glucoCEST [4], has been proposed as an alternative to 18F-FDG to study energy metabolism using injection of glucose or 2-deoxy-D-glucose (2DG), an analogue similarly transported but with metabolism blocked after the first phosphorylation into 2DG-6-phosphate (2DG6P). In this study, we developed a multi-metabolic CEST protocol to monitor gluCEST and glucoCEST levels in a slowly progressive rat model of HD. Coupled with lactate measurements using 1H-MRS, we highlighted potential energy metabolism remodeling that occurred during the asymptomatic stage.Methods
Rat model: Transgenic rats were obtained using a human Bacterial Artificial Chromosome containing 97 CAG/CAA repeats were used (BACHD [5]). Two cohorts were compared: Wild Type (n=6) and BACHD (n=7) rats. Animals were scanned at 2, 4, 6 and 12 months old.GluCEST: GluCEST images were acquired on a horizontal 11.7T Bruker magnet using TSE sequence preceded by a continuous wave saturation pulse (Tsat=1s, B1=5µT) applied at frequencies ranging from -5 to 5ppm by 0.5ppm steps. B0 inhomogeneity was corrected using WASSR. GluCEST images were calculated using asymmetric Magnetization Transfer Ratio (MTRasym) at ±3ppm. Variation maps of gluCEST contrast were calculated between WT and BACHD rats as already described [3].
GlucoCEST: A spectroscopic approach based on fully adiabatic LASER localization preceded by a CEST module (Tsat=4s, B1=2µT, δsat=± 2.9ppm) was used to maximize detection sensitivity. GlucoCEST data were only acquired in the left striatum at 4 months after intravenous injection with a 20 % w/w solution of 2DG (1g/kg in 8min). Same voxel was used for metabolic profiles acquisition using 1H-MRS (Fig.1a-c) with LASER sequence preceded by VAPOR module.
Results
Except for lactate, all metabolites measured in 1H-MRS were stable between WT and BACHD animals. Concerning lactate, a significant decrease was measured in BACHD animal as early as 4 months of age (Fig.1d). Mean glutamate level measured in WT rats seemed to decrease over time but it did not reach statistical significance and is mostly associated to normal aging (Fig.2, top line). Interestingly, glutamate levels seemed to be preserved in BACHD rats up to 6 months and then decreased at 12 months (Fig.2, bottom line). This decrease of gluCEST level in BACHD rats compared to WT animals was markedly observed in the striatum and the corpus callosum (Fig.3b-c) and was significant only at 12 months of age (Fig.3a). In order to ensure that gluCEST contrast was not corrupted by confounding effects due to potential modification of endogenous compounds, we also performed APT and NOE CEST imaging but Zspectra were extremely stable between both cohorts at each time points (Fig.4). Finally, glucoCEST kinetics were measured in WT and BACHD animals at 4 months after 2DG injection (Fig.5). As previously reported, both kinetics showed initial increase of glucoCEST signal after 2DG injection corresponding to the transport of 2DG in the intracellular compartment followed by its conversion into 2DG6P by hexokinase [6]. Interestingly, kinetic measured in BACHD animals exhibited shorter plateau duration compared to WT (38 vs 51 min) that can be attributed to reduced glycolytic metabolism.Discussion and conclusion
The decrease of glutamate levels in the brain of WT rats can be associated to normal aging without neuronal alteration, as it has already been reported in healthy young adulthood [7]. This suggests that glutamate level is more likely correlated to a modified metabolic activity than neuronal alteration [8, 9]. Interestingly, BACHD rats exhibited early lactate modifications associated with very different kinetic of glutamate levels variations, especially in the striatum, which is known to be altered in HD, and in the corpus callosum as observed previously in a mouse model of HD [3]. This suggests a reorganization of metabolic fluxes and energy metabolism in BACHD animals with higher avidity for lactate than glucose for energy production. Such interpretation was reinforced by glucoCEST results arguing in favor of reduced glycolytic metabolism in BACHD animals as early as 4 months of age. Note that we cannot fully explain the decrease of 2DG signal observed 40 to 60 min after injection. Such effect was already reported [4] and may correspond to an intracellular phenomenon, namely: degradation of 2DG6P through pentose phosphate pathway [10-11], glycogen conversion [12-13], further metabolism in 2DG-1-P and 2DG-1-6-P2 [14] or passive washout due to osmotic pressure.In this study, we highlighted various evolutions of glutamate and lactate levels in HD rats as compared to control animals, as well as different utilization of energetic substrate using glucoCEST in a progressive rat model of HD. Such results suggest that HD pathology can be characterized by metabolic and energetic adaptations, especially during the asymptomatic stage.
Acknowledgements
This work was supported by a grant from Agence Nationale pour la Recherche (“nrjCEST” project, ANR-18-CE19-0014-01). The 11.7 T scanner was funded by a grant from NeurATRIS: A Translational Research Infrastructure for Biotherapies in Neurosciences (“Investissements d'Avenir”, ANR-11-INBS-0011).References
1. Walker, F.O., Huntington's disease. Lancet, 2007. 369(9557): p. 218-28.
2. Cai, K., et al., Magnetic resonance imaging of glutamate. Nat Med, 2012. 18(2): p. 302-6.
3. Pepin, J., et al., In vivo imaging of brain glutamate defects in a knock-in mouse model of Huntington's disease. Neuroimage, 2016. 139: p. 53-64.
4. Nasrallah, F.A., et al., Imaging brain deoxyglucose uptake and metabolism by glucoCEST MRI. J Cereb Blood Flow Metab, 2013. 33(8): p. 1270-8.
5. Yu-Taeger, L., et al., A novel BACHD transgenic rat exhibits characteristic neuropathological features of Huntington disease. J Neurosci, 2012. 32(44): p. 15426-38.
6. Mathieu-Daudé, Y., et al., Deciphering the compartmental origin of glucoCEST signal using diffusion-weighted CEST-MRS. Proceedings ISMRM 2022, London.
7. Marsman, A., et al., Glutamate changes in healthy young adulthood. Eur Neuropsychopharmacol, 2013. 23(11): p. 1484-90.
8. Segovia, G., et al., Glutamate-glutamine cycle and aging in striatum of the awake rat: effects of a glutamate transporter blocker. Neurochem Res, 2001. 26(1): p. 37-41.
9. Zahr, N.M., et al., Low striatal glutamate levels underlie cognitive decline in the elderly: evidence from in vivo molecular spectroscopy. Cereb Cortex, 2008. 18(10): p. 2241-50.
10. M. Suzuki, J. D. O’Dea, T. Suzuki, et N. S. Agar, « 2-deoxyglucose as a substrate for glutathione regeneration in human and ruminant red blood cells », Comparative Biochemistry and Physiology Part B: Comparative Biochemistry, vol. 75, no 2, p. 195‑197, janv. 1983, doi: 10.1016/0305-0491(83)90312-7.
11. S.-M. Jeon, N. S. Chandel, et N. Hay, « AMPK regulates NADPH homeostasis to promote tumour cell survival during energy stress », Nature, vol. 485, no 7400, p. 661‑665, mai 2012, doi: 10.1038/nature11066.
12. R. Southworth, C. R. Parry, H. G. Parkes, R. A. Medina, et P. B. Garlick, « Tissue-specific differences in 2-fluoro-2-deoxyglucose metabolism beyond FDG-6-P: a 19F NMR spectroscopy study in the rat », NMR in Biomedicine, vol. 16, no 8, p. 494‑502, 2003, doi: 10.1002/nbm.856.
13. T. Nelson, E. E. Kaufman, et L. Sokoloff, « 2-Deoxyglucose Incorporation into Rat Brain Glycogen During Measurement of Local Cerebral Glucose Utilization by the 2-Deoxyglucose Method », Journal of Neurochemistry, vol. 43, no 4, p. 949‑956, 1984, doi: 10.1111/j.1471-4159.1984.tb12829.x.
14. G. A. Dienel, N. F. Cruz, et L. Sokoloff, « Metabolites of 2-Deoxy-[14C]Glucose in Plasma and Brain: Influence on Rate of Glucose Utilization Determined with Deoxyglucose Method in Rat Brain », J Cereb Blood Flow Metab, vol. 13, no 2, p. 315‑327, mars 1993, doi: 10.1038/jcbfm.1993.40.
Figures
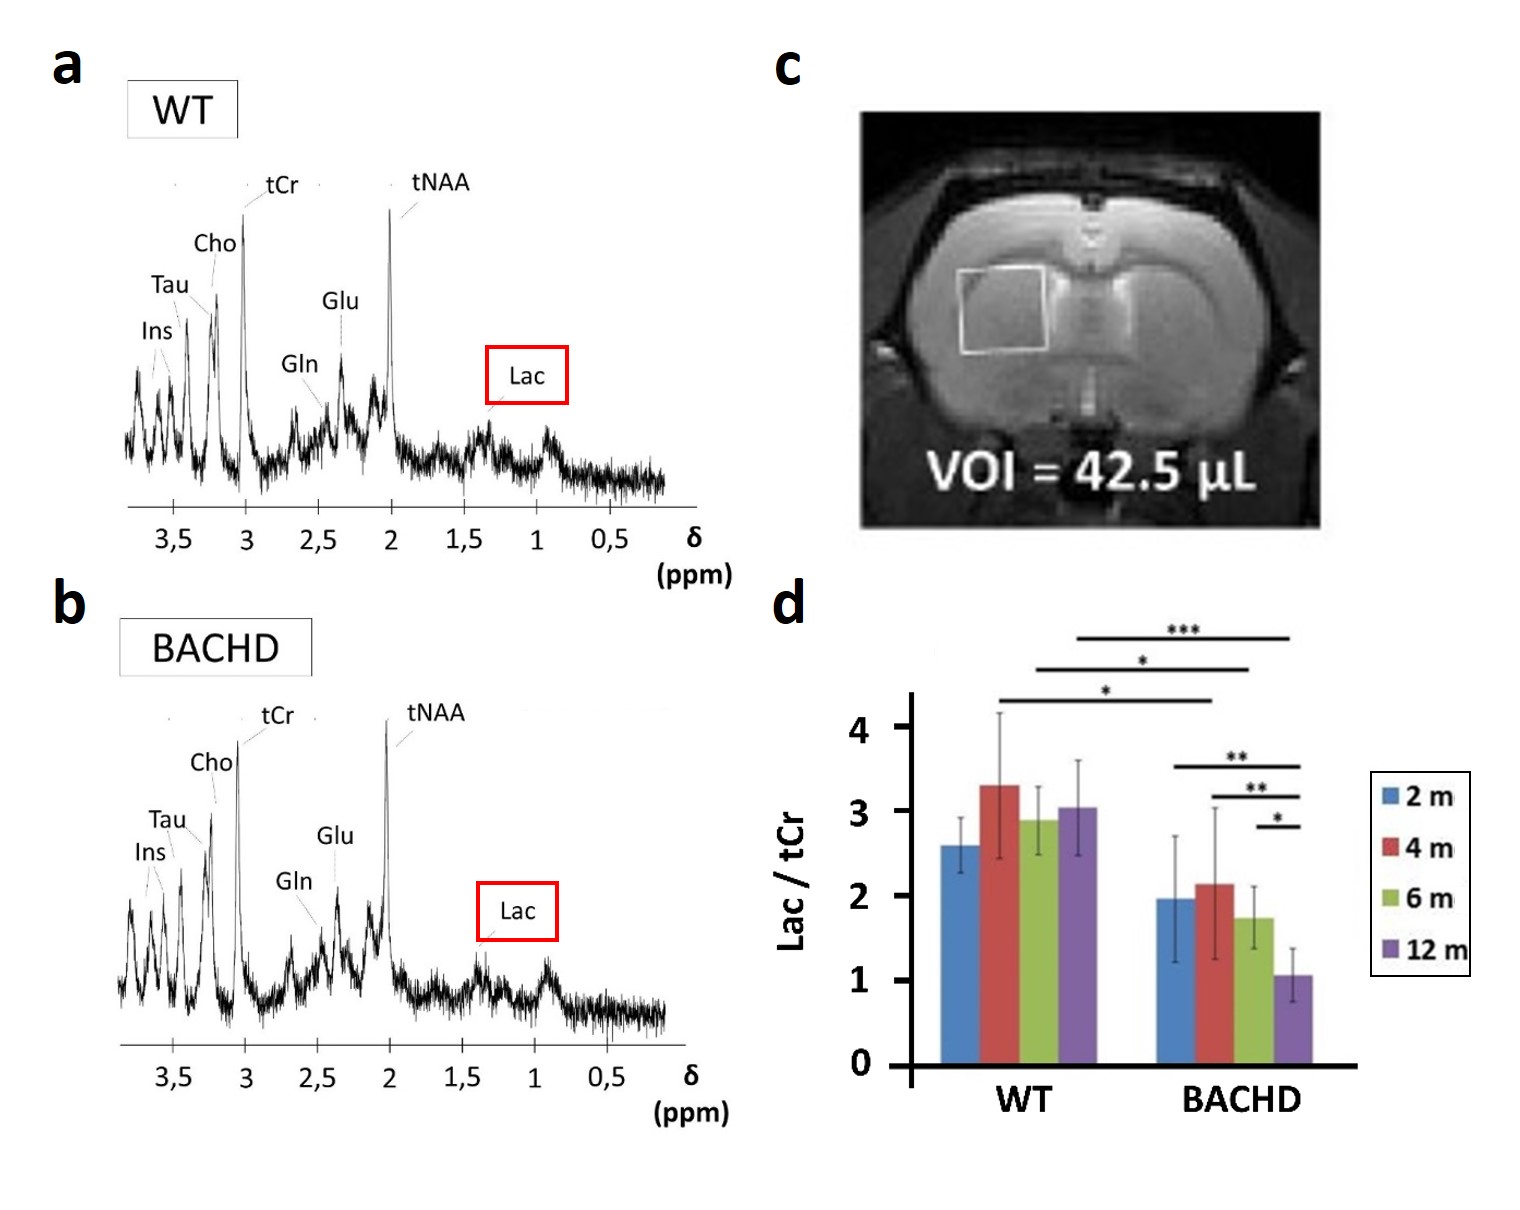
Figure 1: 1H-MRS
Metabolic profiles were measured in WT (a) and BACHD (b) rats in a voxel placed in the left striatum (c). Contrarily to all other metabolites, lactate was decrease in BACHD animals as early as 4 months of age (d).
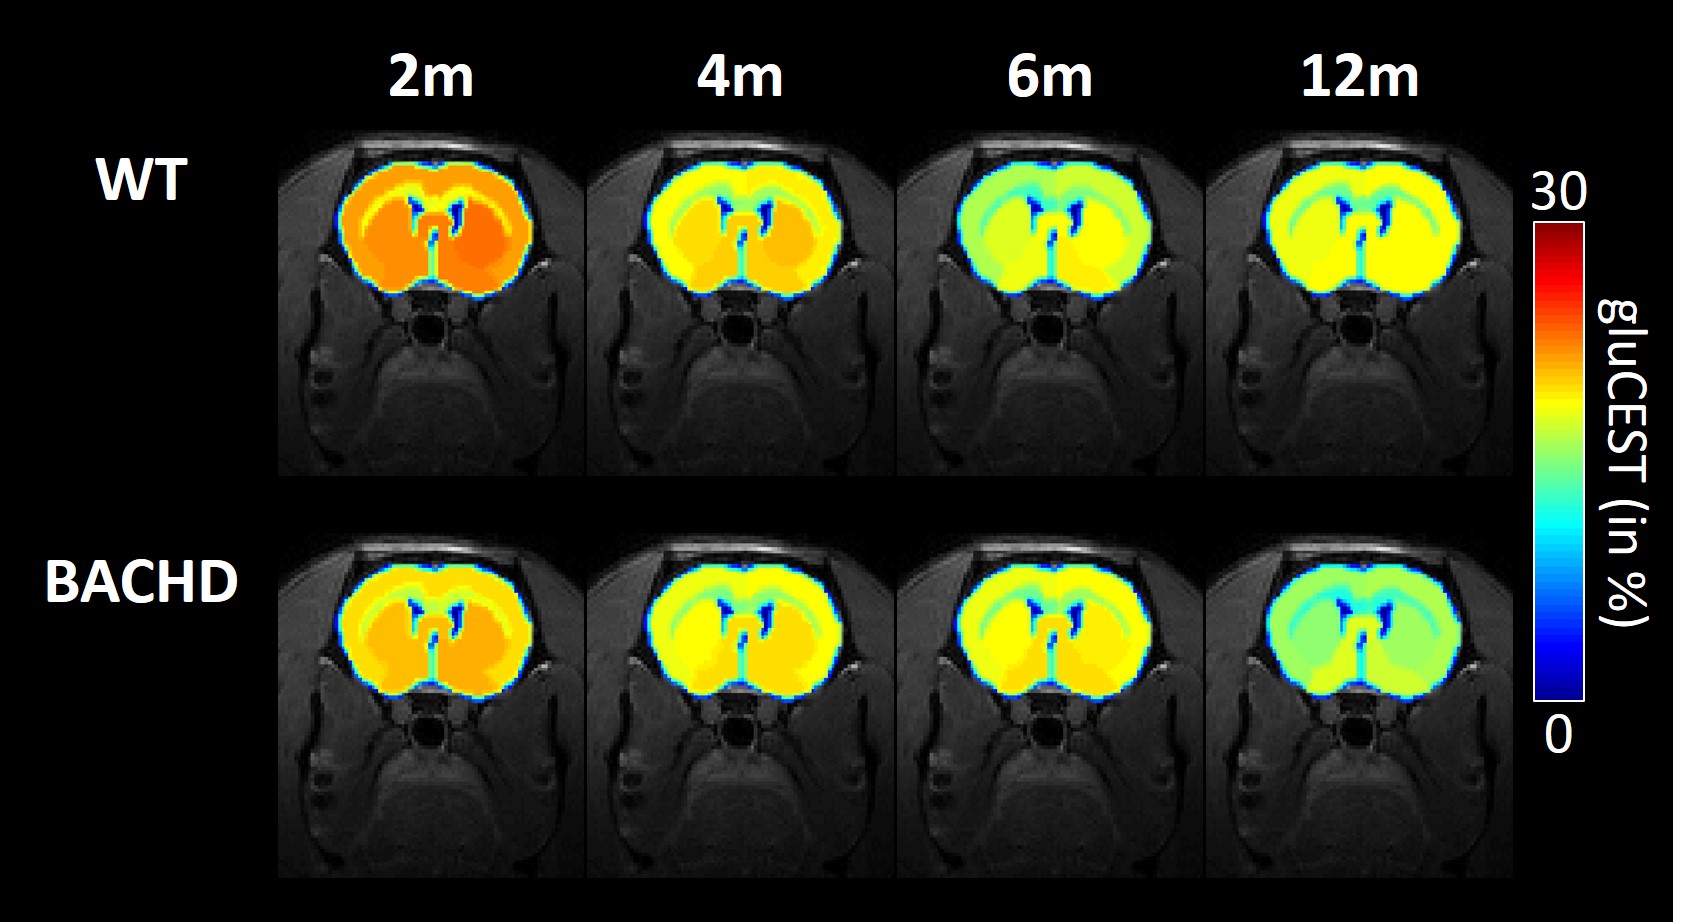
Figure 2: gluCEST imaging
GluCEST maps were measured longitudinally in WT (top line) and BACHD (bottom line) rats.
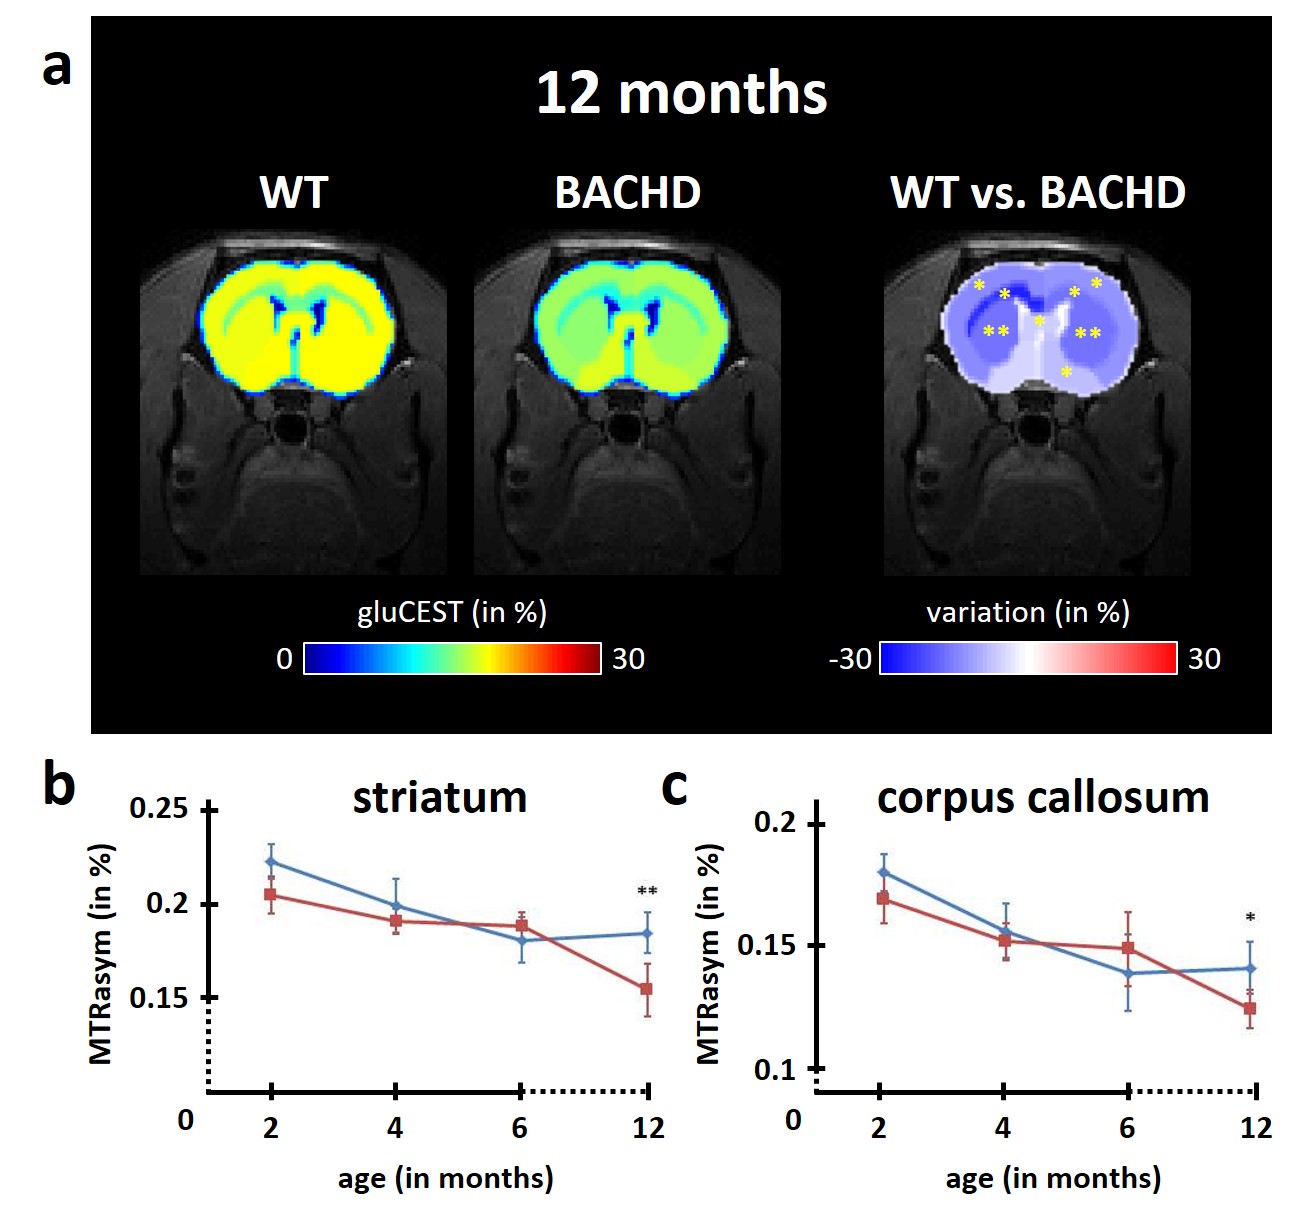
Figure 3: modification of gluCEST levels
Several brain regions showed significant reduction of gluCEST contrast in BACHD rats at 12 months as compared to WT rats (a). The decrease was particularly pronounced in the striatum (b) and the corpus callosum (c), two brain regions already reported to be involved in HD pathology.
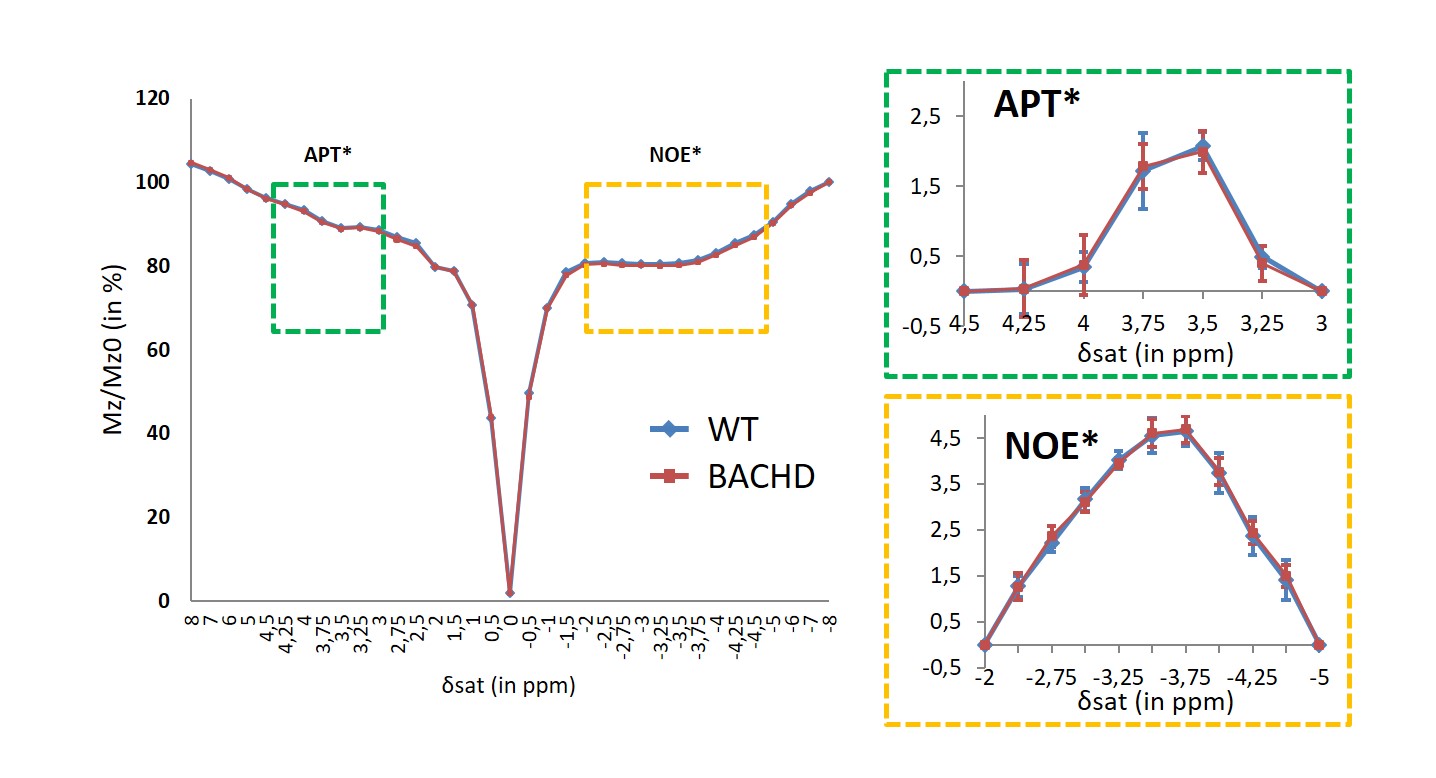
Figure 4: APT and NOE imaging
APT (green dotted box) and NOE (orange dotted box) signals were compared between WT and BACHD rats in order to exclude potential confounding factors to the gluCEST contrast.
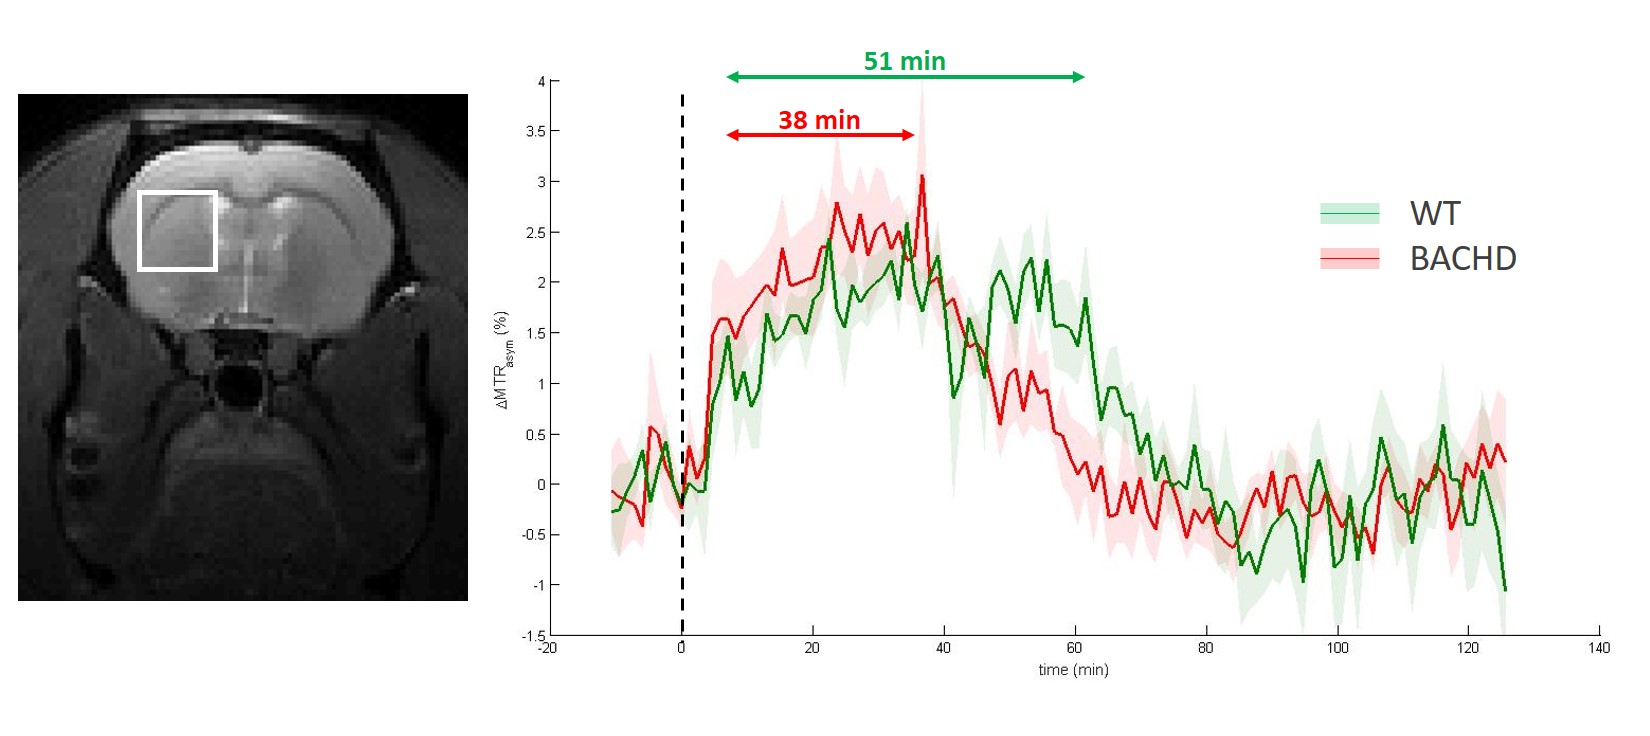
Figure 5: glucoCEST kinetics
GlucoCEST kinetics were measured in the left striatum at 4 months using LASER-CEST sequence after intravenous injection of 2DG (1g/kg). Kinetics measured in WT (green curve) and BACHD (red curve) exhibited different behaviors, especially a shorter plateau duration in BACHD animals that could reflect reduced glycolytic metabolism.