0901
Dynamic glucose enhanced MRI of gliomas: a preliminary clinical application.1Department of Radiology, Zhujiang Hospital, Southern Medical University, Guangzhou,Guangdong, China, 2BioMedical Engineering and Imaging Institute, Icahn School of Medicine at Mount Sinai, New York, NY, United States, 3Russell H. Morgan Department of Radiology and Radiological Science, Johns Hopkins University School of Medicine, Baltimore, MD, United States, 4Philips Healthcare, Guangzhou, China, 5Department of Medical Radiation Physics, Lund University, Lund, Sweden, 6F.M. Kirby Research Center for Functional Brain Imaging, Kennedy Krieger Institute, Baltimore, MD, United States
Synopsis
Keywords: CEST & MT, Contrast Agent, glucose
In this study, we explored the feasibility of dynamic glucose enhanced (DGE) MRI technology in the clinical application of gliomas. 20 glioma patients underwent pre-operative DGE-MRIs before clinical intervention. We observed a significant increase in DGE area under the uptake curve (AUC) signal in tumors compared to the white matter. In some cases, we found enhancement in DGE MRI in histopathological confirmed tumor region that was not enhanced by Gd T1w MRI. These findings provide a new perspective for the further exploration and analysis of the D-glucose delivery, uptake and metabolism in brain tumors.
Introduction
The uptake and metabolic changes of D-glucose are sensitive biomarkers for cellular dysfunction in diseases such as cancer, stroke, Alzheimer's disease and psychosis1-4. However, detecting unlabeled D-glucose in vivo with MRI is a big challenge. Recently, dynamic glucose enhanced (DGE) MRI has showed potential for imaging D-glucose delivery, uptake and metabolism in vivo thereby providing a possibility to improve the diagnosis and prognosis of diseases such as cancer and neurodegenerative diseases 5-7. In these early and limited studies, different tumor regions showed different enhancement patterns, suggesting that the dynamic time curve may contain information about blood-brain barrier (BBB) permeability and other perfusion related parameters 6,8. These findings provide preliminary support for the potential use of D-glucose as an MRI contrast agent and the use of DGE to study tumor and tissue D-glucose delivery and uptake characteristics.In the current study, we performed pre-operative DGE MRI scans on brain tumor patients on a clinical 3.0T MRI. We analyzed the characteristics of DGE MRIs and compared the signal enhancements to the gadolinium (Gd) enhanced MRIs in different tumor regions, for both low- and high-grade gliomas.
Methods
The study was approved by the local institutional review board and informed consent was obtained prior to the study from all participants. Twenty glioma patients underwent a pre-operative DGE MRI protocol in a 3.0T superconducting magnetic resonance scanner (Ingenia 3.0T, Philips Healthcare) before clinical intervention. During the dynamic glucose scan, a brief hyperglycemic state was established by intravenous infusion of 50 mL of 50% w/w D-glucose and DGE images were continuously collected for 15 minutes. The chemical exchange saturation transfer (CEST) preparation was achieved by quasi-continuous wave saturation consisted of a train of sinc-gauss pulses, each 50 ms in duration. Dynamic CEST images were acquired continuously before, during, and after glucose infusion using B1=1.6 mT of 1 s duration at a single frequency of 2 ppm. Four non-saturated (S0) images were acquired by saturating at +1500 ppm at the beginning of the CEST image acquisition before D-glucose infusion. 15 slices with a resolution of 3.3×3.3×4.4 mm3 were acquired using a multi-shot 3D turbo spin echo (TSE) sequence with TR/TE/FA of 3.5s/6.1ms/90°.Area under curve (AUC) images were calculated to retrieve information about glucose delivery and uptake. The differences in AUC2-7min values between glioma core, margin area, edema area and white matter (WM) were compared by Mann-Whitney U test.
Result and discussion
A majority of high grade glioma (HGG) cases showed inhomogeneous hyperintensity in AUC2-7min images, consistent with hyperintensity in post Gd MPRAGE images. Figure 1 shows a representative case of a pathologically confirmed Glioblastoma (Case 1). Low grade glioma (LGG) also showed heterogeneous hyperintensity in the AUC2-7min as presented in Figure 2 (Case 2, pathologically confirmed astrocytoma, WHO 2). In most cases, AUC2-7min images had a slightly higher signal around the tumor rim, which is located between an area of tumor edema and an adjacent normal parenchyma compared to anatomy MRI images. High signal intensity was also present in cystic and necrotic areas, and the signal was relatively homogeneous, indicating that D-glucose can readily enter such liquid-filled spaces. In addition, D-Glucose can be transported into the CSF compartment 9,10.We also performed quantitative analysis of the mean AUC values in different regions of the brain (Figure 3). For DGE-MRI, AUC2-7min mainly reflects the vascular delivery and uptake of glucose into the extravascular extracellular space (EES), due to the fast metabolism in the cells 11. Previous studies have shown that existing micro-vasodilation in brain tissue can provide adequate blood and nutrients in LGG with less proliferation 12.With less formation of new microvessels, the blood-brain barrier appears to remain intact in LGG. In addition, the pH is not as much reduced in LGG EES, further reducing D-glucose signal in CEST acquisitions. HGGs have high proliferative activity and atypical cell structure. The existing microvessels may not meet the demands of tumor proliferation and the resulting hypoxia can cause local vascular hyperplasia13 and express vascular endothelial growth factor (VEGF). This promotes angiogenesis and an increase in microvascular leakage without leading to endothelial cell damage 14. Additionally, lower pH in the EES will increase CEST signal. This could explain the higher signal in the tumor margin and some areas with edema. Therefore, the difference of intensity of signal may due to the different proliferative activity and atypical cell structure, which might promote the uptake, transport and metabolism of glucose. This is consistent with previous results using DGE-MRI 6,8,11.
Conclusion
We found DGE MRI is a feasible technique for the study of brain tumors as part of a clinical exam. In some cases, we found enhancement in DGE MRI in histopathological confirmed tumor region that was not enhanced by Gd T1w MRI, consistent with our hypothesis that D-glucose may be potentially more sensitive than Gd based contrast agents in detecting malignancy due to its smaller size. These findings provide a new perspective for the further exploration of DGE-MRI to give insight into the D-glucose transport, uptake and metabolism of brain tumors.Acknowledgements
Authors are grateful to receive funding support from the Natural Science Foundation of Guandong Province (2022A1515011585); Southern Medical University clinical research project (LC2016ZD028); the National Institutes of Health grant RO1 EB019934 and R00 EB026312; the Swedish Research Council grant 2019-03637; the Swedish Cancer Society grant CAN 2018/550 and 21 1652 Pj; Swedish Brain Foundation grant number FO2021-0328.
References
1. Weise CM, Chen K, Chen Y, Kuang X, Savage CR, Reiman EM. Left lateralized cerebral glucose metabolism declines in amyloid-β positive persons with mild cognitive impairment. NeuroImage Clinical. 2018;20:286-296.
2. Croteau E, Castellano CA, Fortier M, et al. A cross-sectional comparison of brain glucose and ketone metabolism in cognitively healthy older adults, mild cognitive impairment and early Alzheimer's disease. Experimental gerontology. 2018;107:18-26.
3. Butterfield DA, Halliwell B. Oxidative stress, dysfunctional glucose metabolism and Alzheimer disease. Nature reviews Neuroscience. 2019;20(3):148-160.
4. Regenold WT, Phatak P, Kling MA, Hauser P. Post-mortem evidence from human brain tissue of disturbed glucose metabolism in mood and psychotic disorders. Molecular psychiatry. 2004;9(8):731-733.
5. Xu X, Chan KW, Knutsson L, et al. Dynamic glucose enhanced (DGE) MRI for combined imaging of blood-brain barrier break down and increased blood volume in brain cancer. Magnetic resonance in medicine. 2015;74(6):1556-1563.
6. Xu X, Yadav NN, Knutsson L, et al. Dynamic Glucose-Enhanced (DGE) MRI: Translation to Human Scanning and First Results in Glioma Patients. Tomography. 2015;1(2):105-114.
7. Nasrallah FA, Pages G, Kuchel PW, Golay X, Chuang KH. Imaging brain deoxyglucose uptake and metabolism by glucoCEST MRI. Journal of cerebral blood flow and metabolism : official journal of the International Society of Cerebral Blood Flow and Metabolism. 2013;33(8):1270-1278.
8. Paech D, Schuenke P, Koehler C, et al. T1ρ-weighted Dynamic Glucose-enhanced MR Imaging in the Human Brain. Radiology. 2017;285(3):914-922.
9. Chen L, Wei Z, Chan KW, et al. D-Glucose uptake and clearance in the tauopathy Alzheimer's disease mouse brain detected by on-resonance variable delay multiple pulse MRI. Journal of cerebral blood flow and metabolism : official journal of the International Society of Cerebral Blood Flow and Metabolism. 2021;41(5):1013-1025.
10. Huang J, Lai JHC, Han X, et al. Sensitivity schemes for dynamic glucose-enhanced magnetic resonance imaging to detect glucose uptake and clearance in mouse brain at 3 T. NMR in biomedicine. 2022;35(3):e4640.
11. Knutsson L, Xu X, van Zijl PCM, Chan KWY. Imaging of sugar-based contrast agents using their hydroxyl proton exchange properties. NMR in biomedicine. 2022:e4784.
12. Jiang JS, Hua Y, Zhou XJ, et al. Quantitative Assessment of Tumor Cell Proliferation in Brain Gliomas with Dynamic Contrast-Enhanced MRI. Academic radiology. 2019;26(9):1215-1221.
13. Su C, Liu C, Zhao L, et al. Amide Proton Transfer Imaging Allows Detection of Glioma Grades and Tumor Proliferation: Comparison with Ki-67 Expression and Proton MR Spectroscopy Imaging. AJNR American journal of neuroradiology. 2017;38(9):1702-1709.
14. Senger DR, Van de Water L, Brown LF, et al. Vascular permeability factor (VPF, VEGF) in tumor biology. Cancer metastasis reviews. 1993;12(3-4):303-324.
Figures

Table 1: Characteristics of the 20 cases in the study
E, ependymoma; A, astrocytoma; O, oligodendroglioma; IM, imaging diagnosed; AA, anaplastic astrocytoma; AO , anaplastic oligodendroglioma; GB , glioblastoma; IDH, isocitrate dehydrogenase; mut, mutation; wt, wildtype; numbers in parentheses denote the number of cases in each grade.
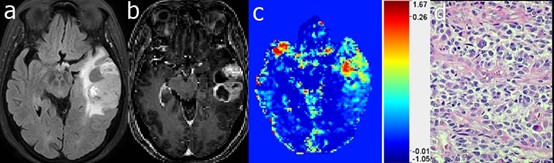
Figure 1. Case 1: A 67-year-old female diagnosed with glioblastoma (WHO grade 4). The mass, located in left temporal, exhibited heterogeneous hyperintensity on FLAIR image (a), MPRAGE image after Gd injection (b), and the DGE AUC2-7min image (c). HE staining (d) showed a dense distribution of tumor cells.
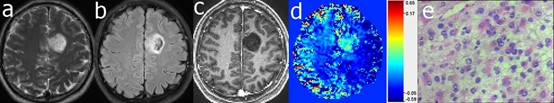
Figure 2. Case 2: A 32 years old male with gemistocytic astrocytoma (WHO grade 2). The mass was located in the left frontal brain, exhibiting hyperintensity on T2w (a) and FLAIR (b) images plus hypointensity on MPRAGE (after Gd injection (c). In the DGE AUC2-7min image (d) the mass exhibits hyperintensity and the H&E staining (e) shows a diffuse distribution of tumor cells.
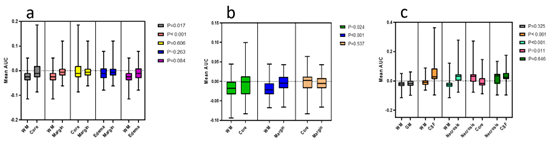
Figure 3. Pairwise comparison between tissue compartments. (a) all cases; (b) low grade glioma cases; and (c) high grade glioma cases.