0899
Relaxation-compensated CEST-MRI at 3 T exhibits regional differences in gray matter and white matter contrasts of glioma patients1Division of Medical Physics in Radiology, German Cancer Research Center (DKFZ), Heidelberg, Germany, 2Faculty of Physics and Astronomy, University of Heidelberg, Heidelberg, Germany, 3Division of Radiology, German Cancer Research Center (DKFZ), Heidelberg, Germany, 4Faculty of Medicine, University of Heidelberg, Heidelberg, Germany, 5Division of Neuroradiology, University Hospital Bonn, Bonn, Germany
Synopsis
Keywords: CEST & MT, Brain
In this study, the APT-weighted (APTwasym) and relaxation-compensated CEST-MRI contrasts of 9 postoperative glioma patients, were analyzed for potential regional differences in gray and white matter. The purpose of this analysis was to identify the influence of the location within the brain on CEST contrasts of tumorous and healthy control tissue, respectively. For relaxation-compensated CEST (MTRRex), (i) differences between gray and white matter and also (ii) regional differences with a decreased contrast inside the frontal lobe were found. On the contrary, the APTwasym was found to be independent of (i) location and (ii) comparable for gray and white matter.
Introduction
Both, asymmetry-based APT-weighted (APTwasym) chemical exchange saturation transfer (CEST) and relaxation-compensated CEST (MTRRex) MRI have already proven to provide valuable information for brain tumor diagnosis at 3T1,2. The purpose of this study was to identify possible regional differences for relaxation-compensated and APTwasym CEST, as partial volume effects and the infiltrative nature of glioma make the identification crucial for the accurate evaluation of edema and whole tumor ROIs. To this end, the contrast values in n=9 postoperative glioma patients were evaluated in gray matter (GM) and white matter (WM) of the frontal, parieto-temporal and occipital region and compared to the values obtained in the contrast enhancement (CE) and whole tumor (WT=CE+edema) regions of interest (ROI).Methods
The n=9 newly diagnosed or relapsing glioma patients were examined as part of an ongoing study and selected by patient age (59.4±3.0years), examination timepoint (after tumor resection and prior to radio-chemotherapy) and field of view placement (>100 voxels per ROI).All measurements were acquired using a 3T whole-body MR scanner (Siemens; MAGNETOM Prisma) with an integrated transmit body coil and a 64-channel receive head/neck coil.
Image readout parameters of the snapshot CEST4 sequence are described in Goerke et al.3 (matrix=128×104×16; resolution=1.7×1.7×3mm3).
Presaturation for APTwasym CEST was performed, in line with the recently published consensus guidelines5, according to Zhou et al.6 (four rectangular RF pulses, B1=2µT). Calculation of the APTwasym contrast was done after a correction for motion and B0-inhomogeneities as follows: $$$APTw_{asym}=Z(-3.5ppm)-Z(3.5ppm)$$$.
For relaxation-compensated CEST, two low-power CEST scans (B1=0.6µT and 0.9µT) and one WASABI7 scan for mapping of B0- and B1-inhomogeneities were acquired. The 6-step postprocessing workflow included (i) a co-registration8, (ii) a correction for B0-inhomogeneities, (iii) denoising9, (iv) fitting of the Z-spectra (4-pool Lorentzian; DS, ssMT, Amide and rNOE), (v) the contrast calculation10 with $$$MTR_{Rex}(\Delta\omega)=\frac{1}{Z_{lab}(\Delta\omega)}-\frac{1}{Z_{ref}(\Delta\omega)}$$$ and (vi) a correction for B1-inhomogeneities11 (reconstructed at B1=0.7µT).
For each patient, a CE and WT ROI was selected by a radiologist. Additionally, GM and WM ROIs were automatically selected in the frontal, parieto-temporal and occipital region of contralateral healthy brain tissue with a home-built segmentation tool. This selection was performed on contrast-enhanced T1w and T2w images using an automated segmentation tool for GM and WM (SPM12) combined with a brain atlas provided by the SPM extension automated anatomical labelling atlas 313.
Results
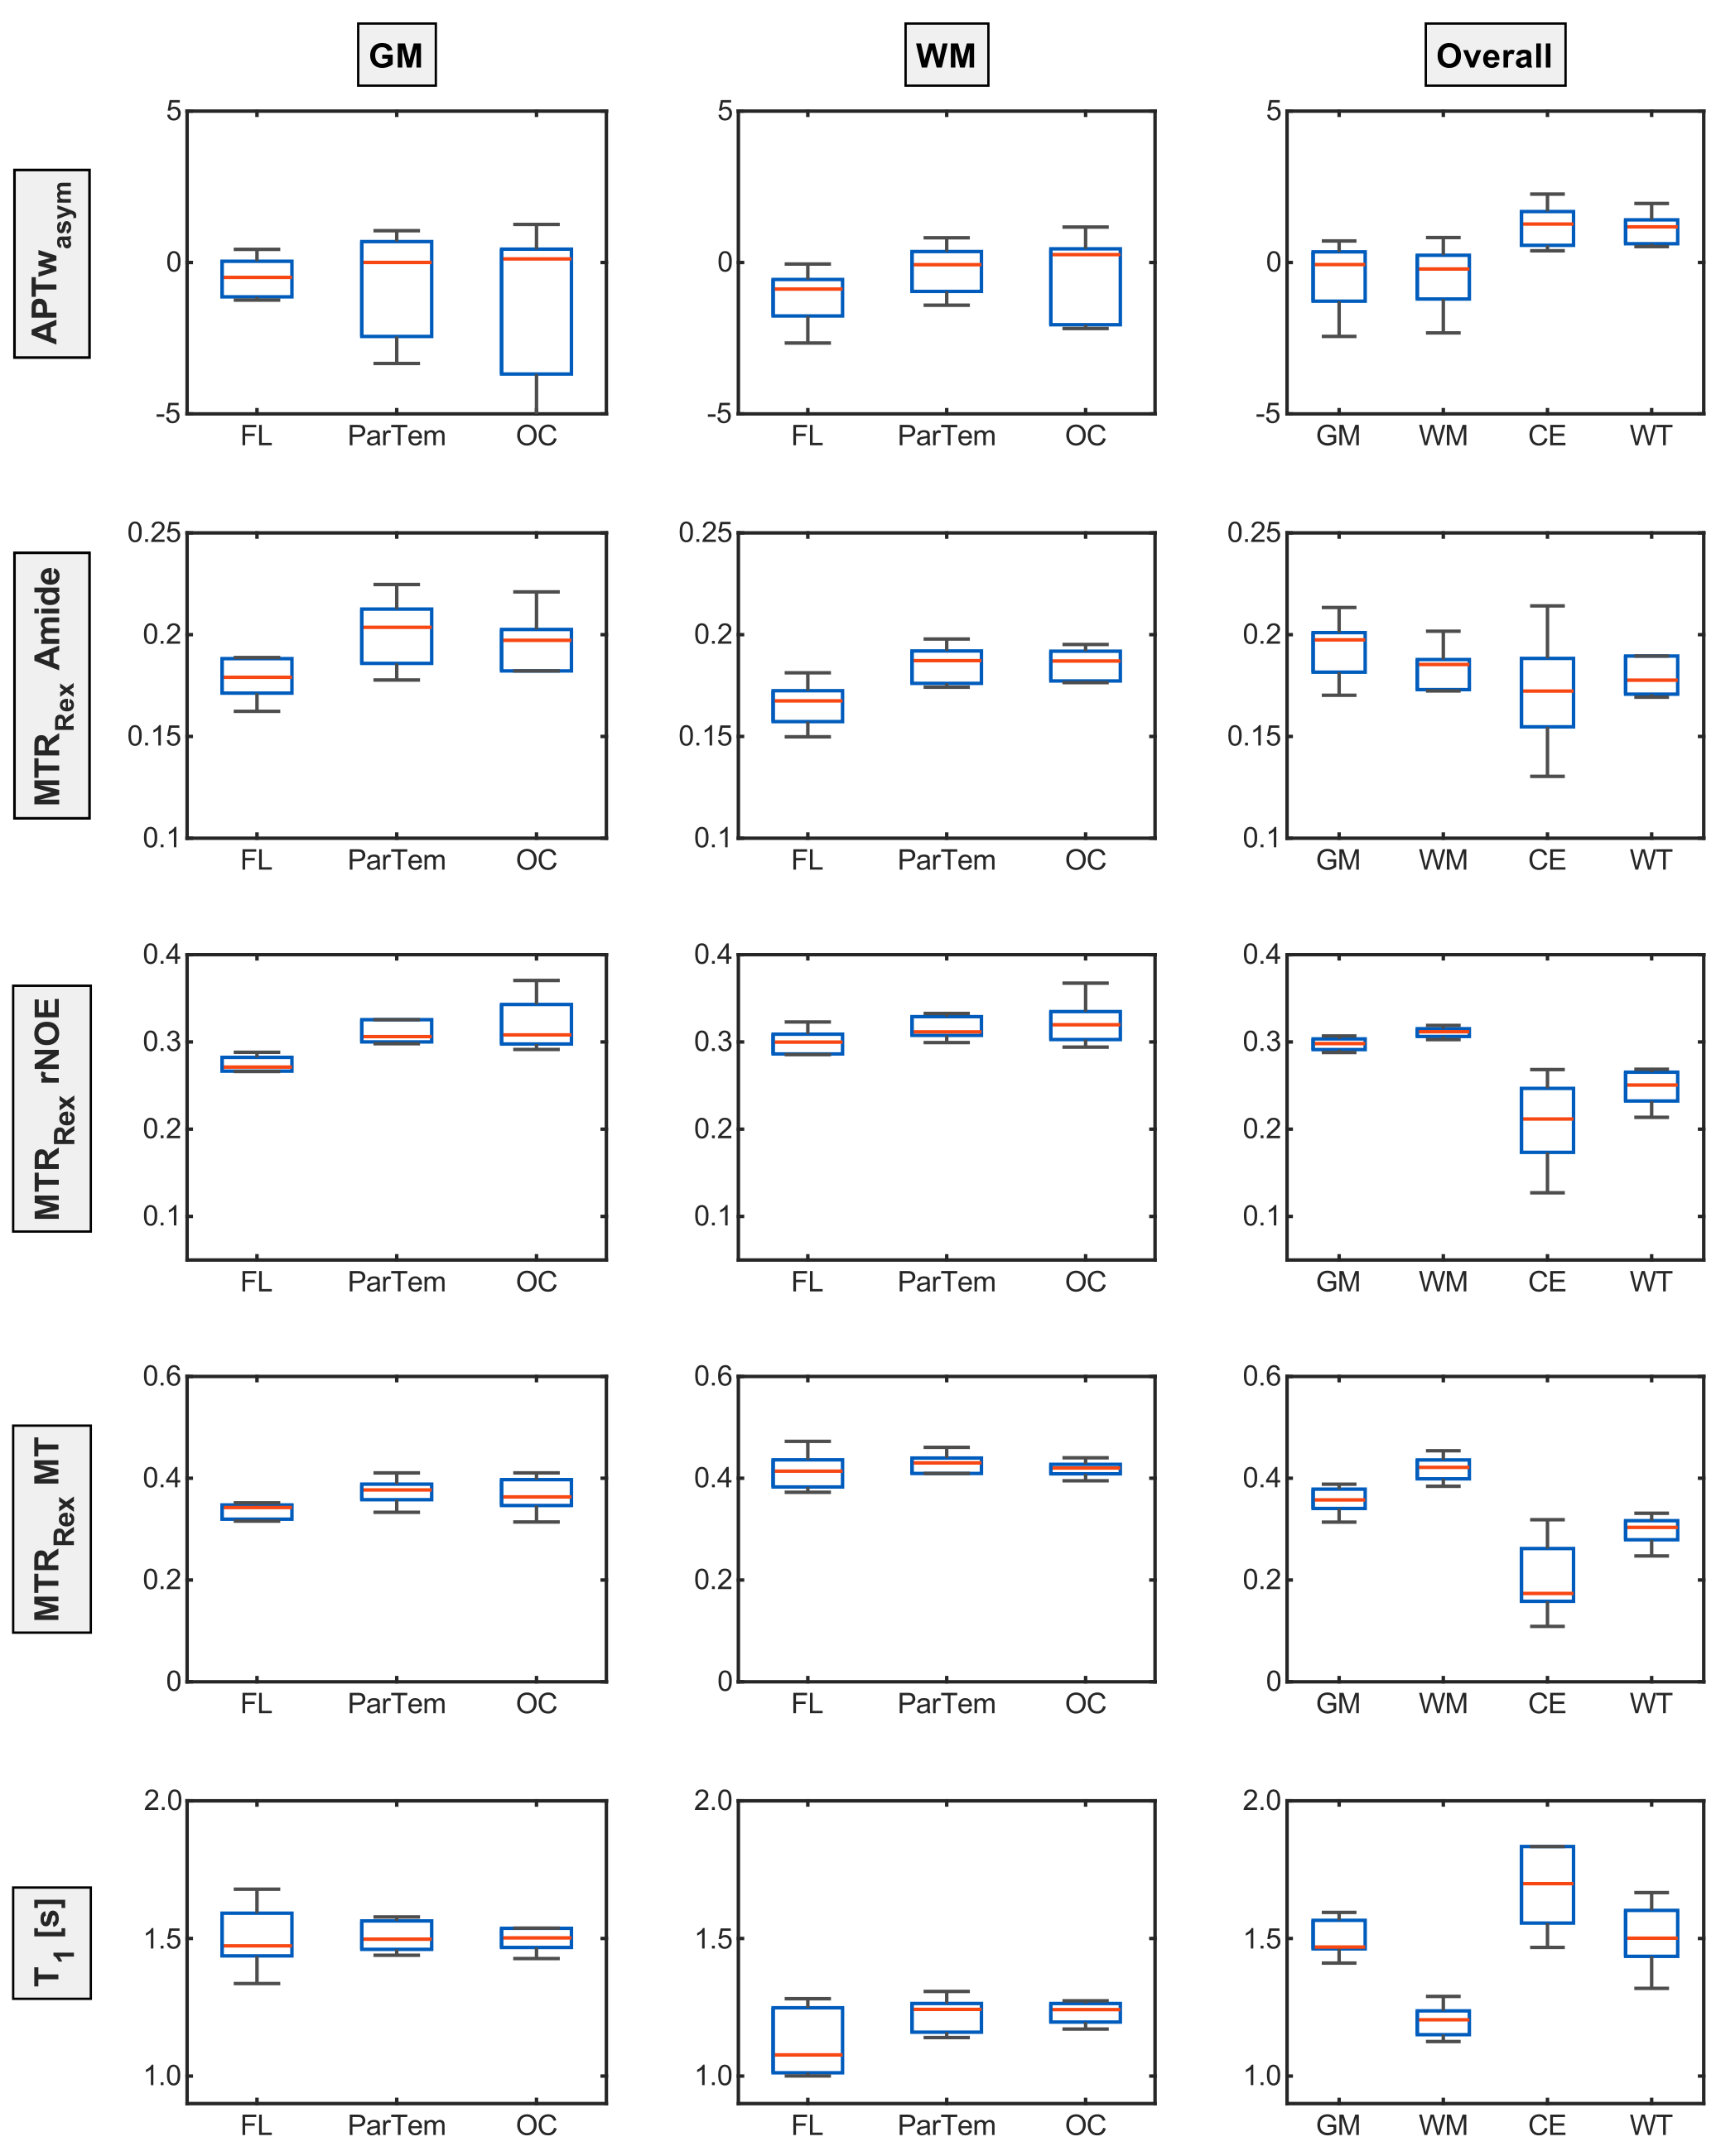
Figure 1 shows the evaluated contrasts of a representative patient of the cohort with a hyperintense GM MTRRexAmide contrast which appears to decrease towards the frontal lobe. On the contrary, the MTRRexrNOE and MTRRexMT both show a hyperintense WM contrast and a clear hypointense CE region, but regional differences are not apparent. The APTwasym contrast does not show any changes between GM and WM or regional deviations but an increased fluctuation in the frontal lobe.These trends are also indicated in the ROI analysis of a representative patient (Figure 2).
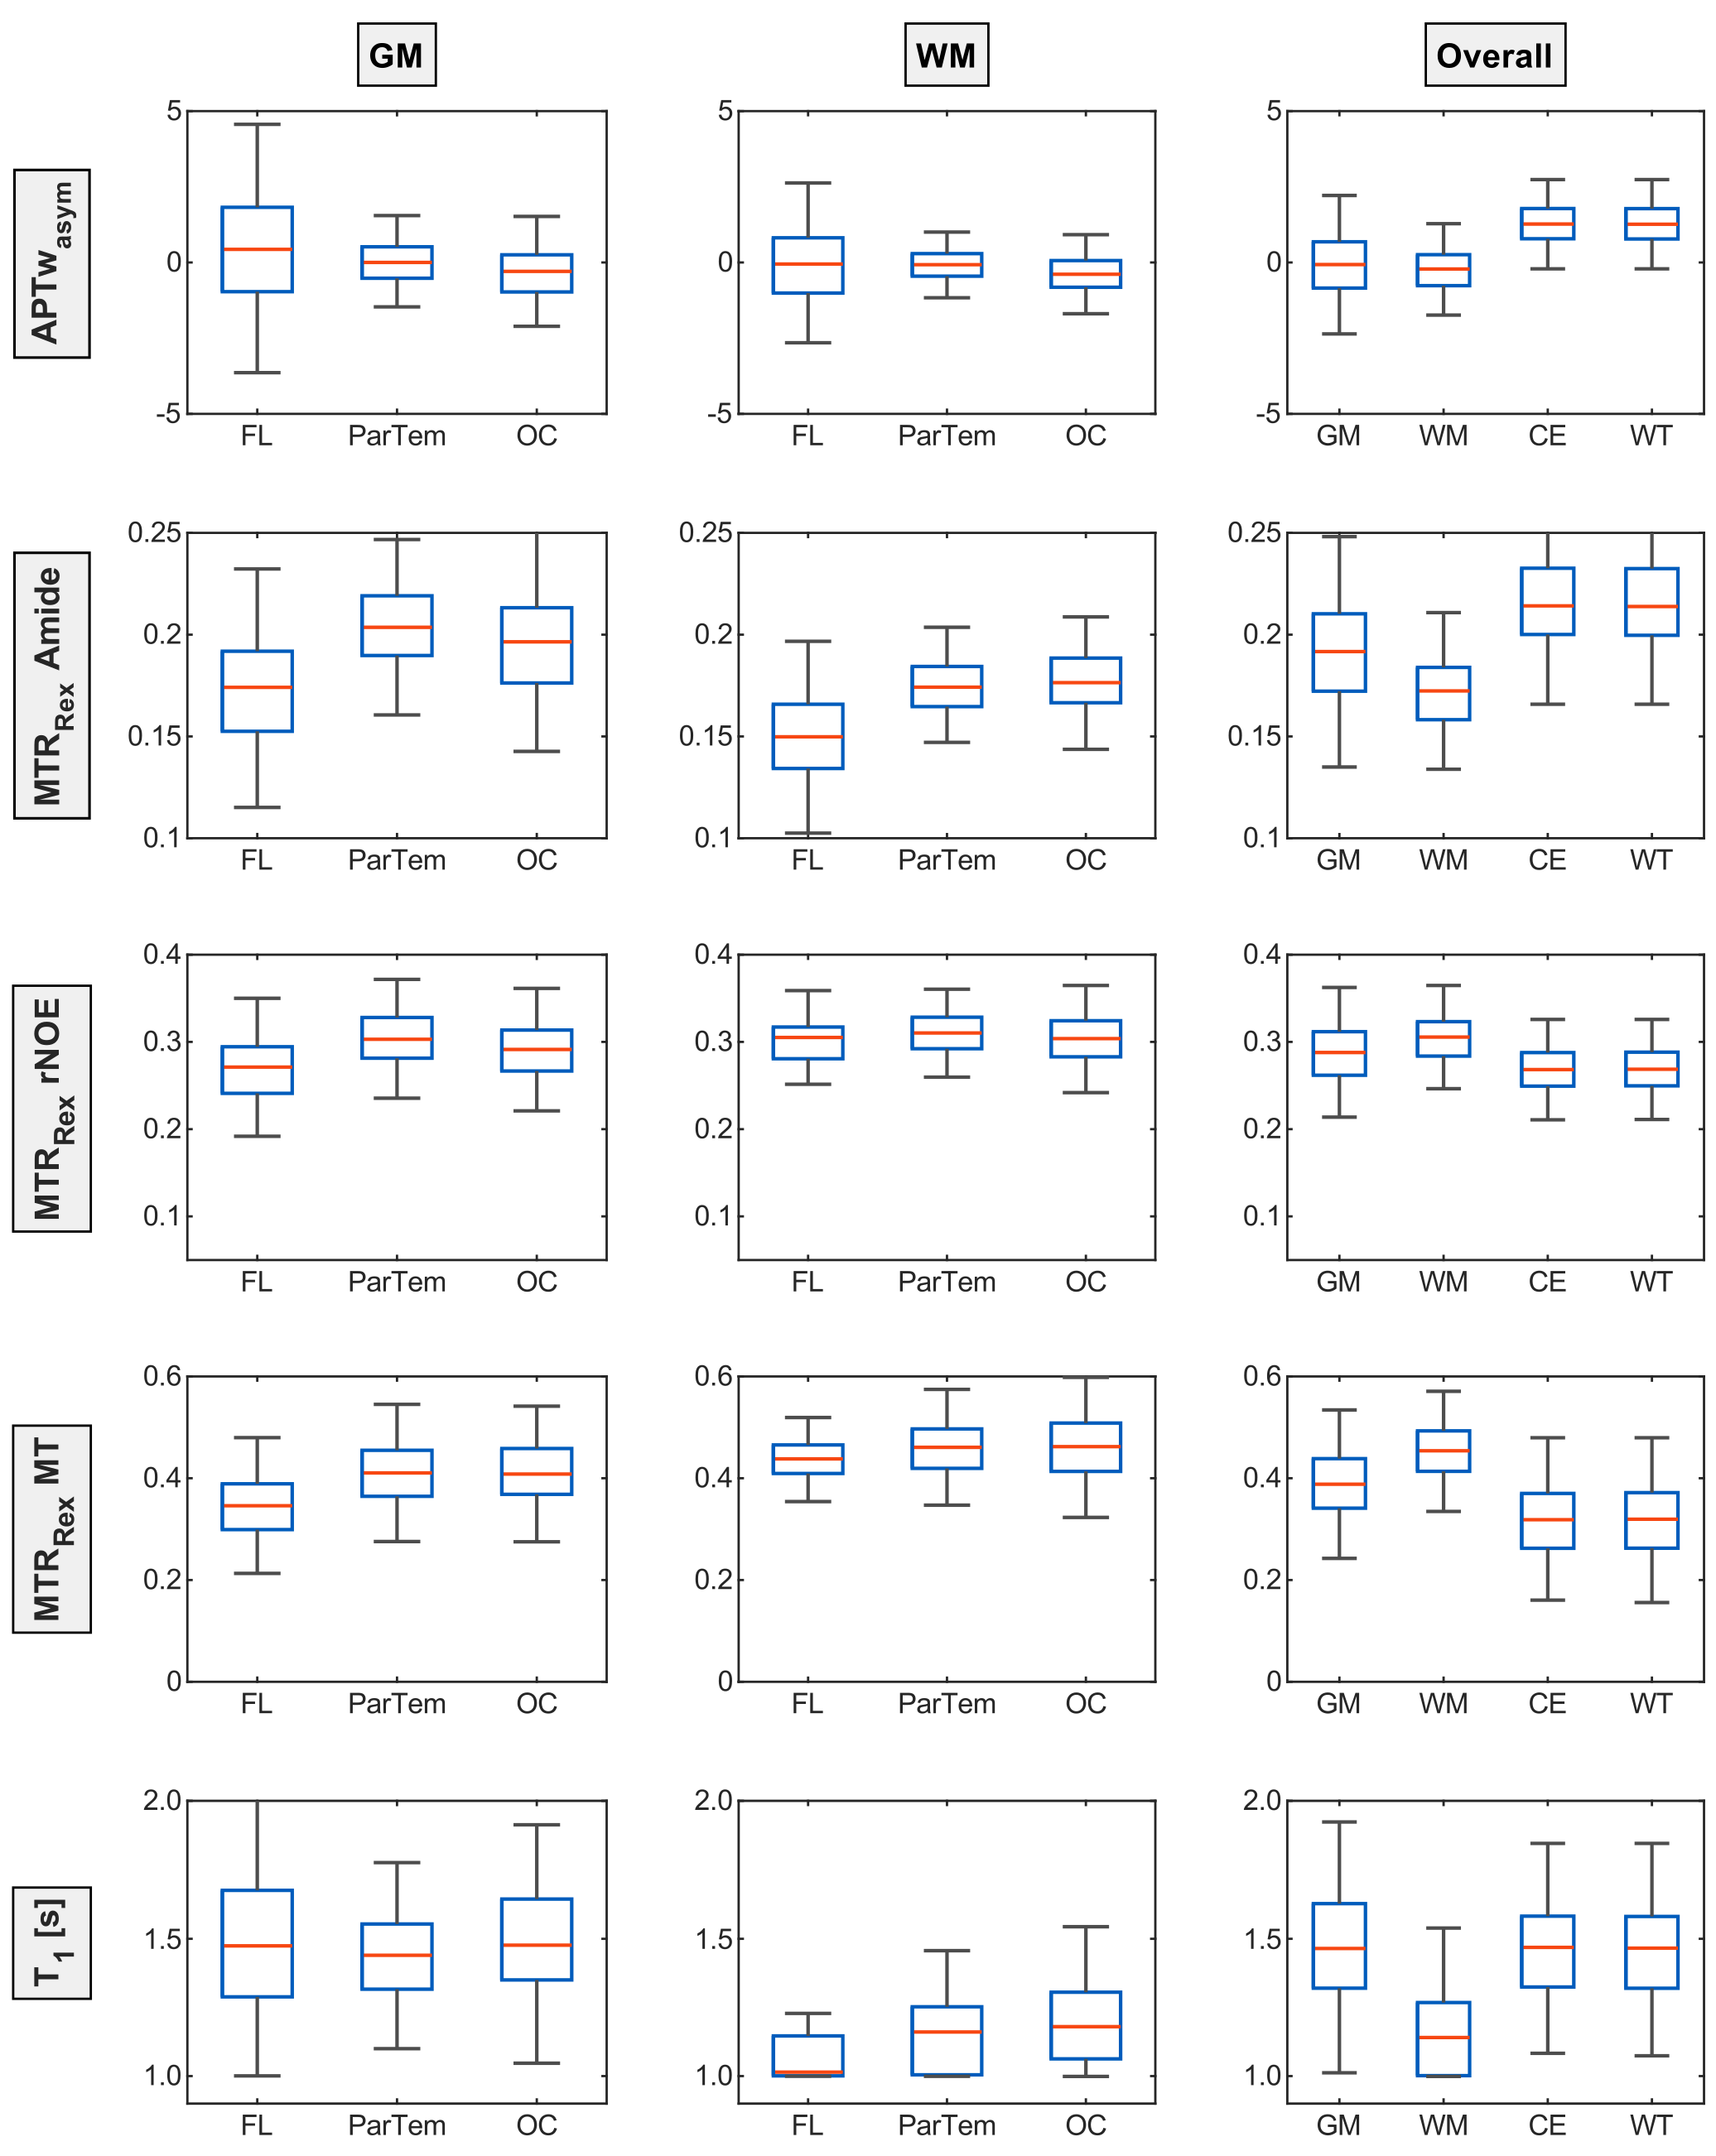
To substantiate these observations, a boxplot analysis based on the median signal values of all patients was performed (Figure 3) hinting towards regional differences for the relaxation-compensated contrasts. Whereas MTRRexMT and MTRRexrNOE only appears to be lower in the GM of the frontal lobe, the MTRRexAmide is lower in both GM and WM. When comparing the overall GM and WM values for the APTwasym no differences are apparent. The MTRRexAmide on the other hand is higher for GM than for WM and an inverted relationship can be observed for the MTRRexrNOE and MTRRexMT. Finally, the APTwasym, MTRRexrNOE and MTRRexMT were found to differentiate between tumor tissue and GM/WM, as expected.
Discussion
A signal drop inside the frontal lobe ROIs was observed for the relaxation-compensated contrasts. The constant T1 values for the different GM and WM ROIs (Figure 2 and 3) indicate that these observed regional differences of the relaxation-compensated contrasts are not T1 related, but could be related to a lower neuron density in the frontal lobe. These findings, and the ability to differentiate between GM and WM, were not observed for the APTwasym, which might be due to the higher signal variability between patients. The large contrast deviations for the CE could be explained by the different glioma types of the patients (3 astrocytomas and 6 glioblastomas). To minimize age-related effects only a small cohort was selected but an analysis with an extended patient cohort is necessary to add statistical value and will be performed in future work.Finally, this work confirmed some previously known effects like the increased MTRRexMT inside the WM compared to GM or the increased MTRRexAmide in GM.
Conclusion
This analysis was able to show potential regional differences for the relaxation-compensated contrasts inside the human brain and was a necessary step towards the better understanding of the APTwasym and the relaxation-compensated contrasts in brain tissues. Our findings showed, that due to the infiltrative nature of glioma a similar analysis focusing on the tumor tissue contrast depending on its localization is needed to accurately evaluate patient data. Additionally, it was indicated that a consistent placement of control tissue ROIs for relaxation-compensated CEST is of high importance. Finally, the results suggested that the relative contributions to the APTwasym contrasts might differ in different brain tissues and regions, which will be thoroughly analyzed in future work.Acknowledgements
We gratefully thank the German Research Foundation (DFG project number: 445704496) for the financial support. Additionally, we cordially thank the medical technical radiology assistants from the German Cancer Research Center (DKFZ) for their help in conducting all the examinations.References
- Zhou j. et al. Differentiation between glioma and radiation necrosis using molecular magnetic resonance imaging of endogenous proteins and peptides. Nat Med. 2011;17:130-134
- Mehrabian H. et al. Differentiation between radiation necrosis and tumor progression using chemical exchange saturation transfer. Clin Cancer Res. 2017;23:3667-3675
- Goerke S, et al. Relaxation-compensated APT and rNOE CEST-MRI of human brain tumors at 3 T. Magn Reson Med. 2019;82:622-632
- Deshmane A, et al. 3D gradient echo snapshot CEST MRI with low power saturation for human studies at 3T. Magn Reson Med. 2019;81(4):2412-23
- Zhou J, et al. Review and consensus recommendations on clinical APTweighted imaging approaches at 3T: Application to brain tumors. Magn Reson Med. 2022; 88: 546- 574
- Zhou J, et al. APT-weighted MRI: Techniques, current neuro applications, and challenging issues. J Magn Reson Imaging. 2019;50(2):347-64
- Schuenke P, et al. Simultaneous mapping of water shift and B1 (WASABI)—application to field‐inhomogeneity correction of CEST MRI data. Magn Reson Med. 2017;77:571-580
- Breitling J, et al. Motion correction for three-dimensional chemical exchange saturation transfer imaging without direct water saturation artifacts. NMR Biomed. 2022;35(7):e4720.
- Breitling J, et al. Adaptive denoising for chemical exchange saturation transfer MR imaging. NMR Biomed. 2019;32:e4133
- Zaiss M, et al. Inverse Z‐spectrum analysis for spillover‐, MT‐, and T1‐corrected steady‐state pulsed CEST‐MRI application to pH‐weighted MRI of acute stroke. NMR Biomed. 2014;27:240-252
- Windschuh J, et al. Correction of B1-inhomogeneities for relaxation-compensated CEST imaging at 7 T. NMR Biomed. 2015;28:529-537
- Ashburner J, et al. Unified segmentation NeuroImage. 2005;26:839-851
- Rolls E.T., et al. Automated anatomical labelling atlas 3 NeuroImage. 2020;206:116-189
Figures
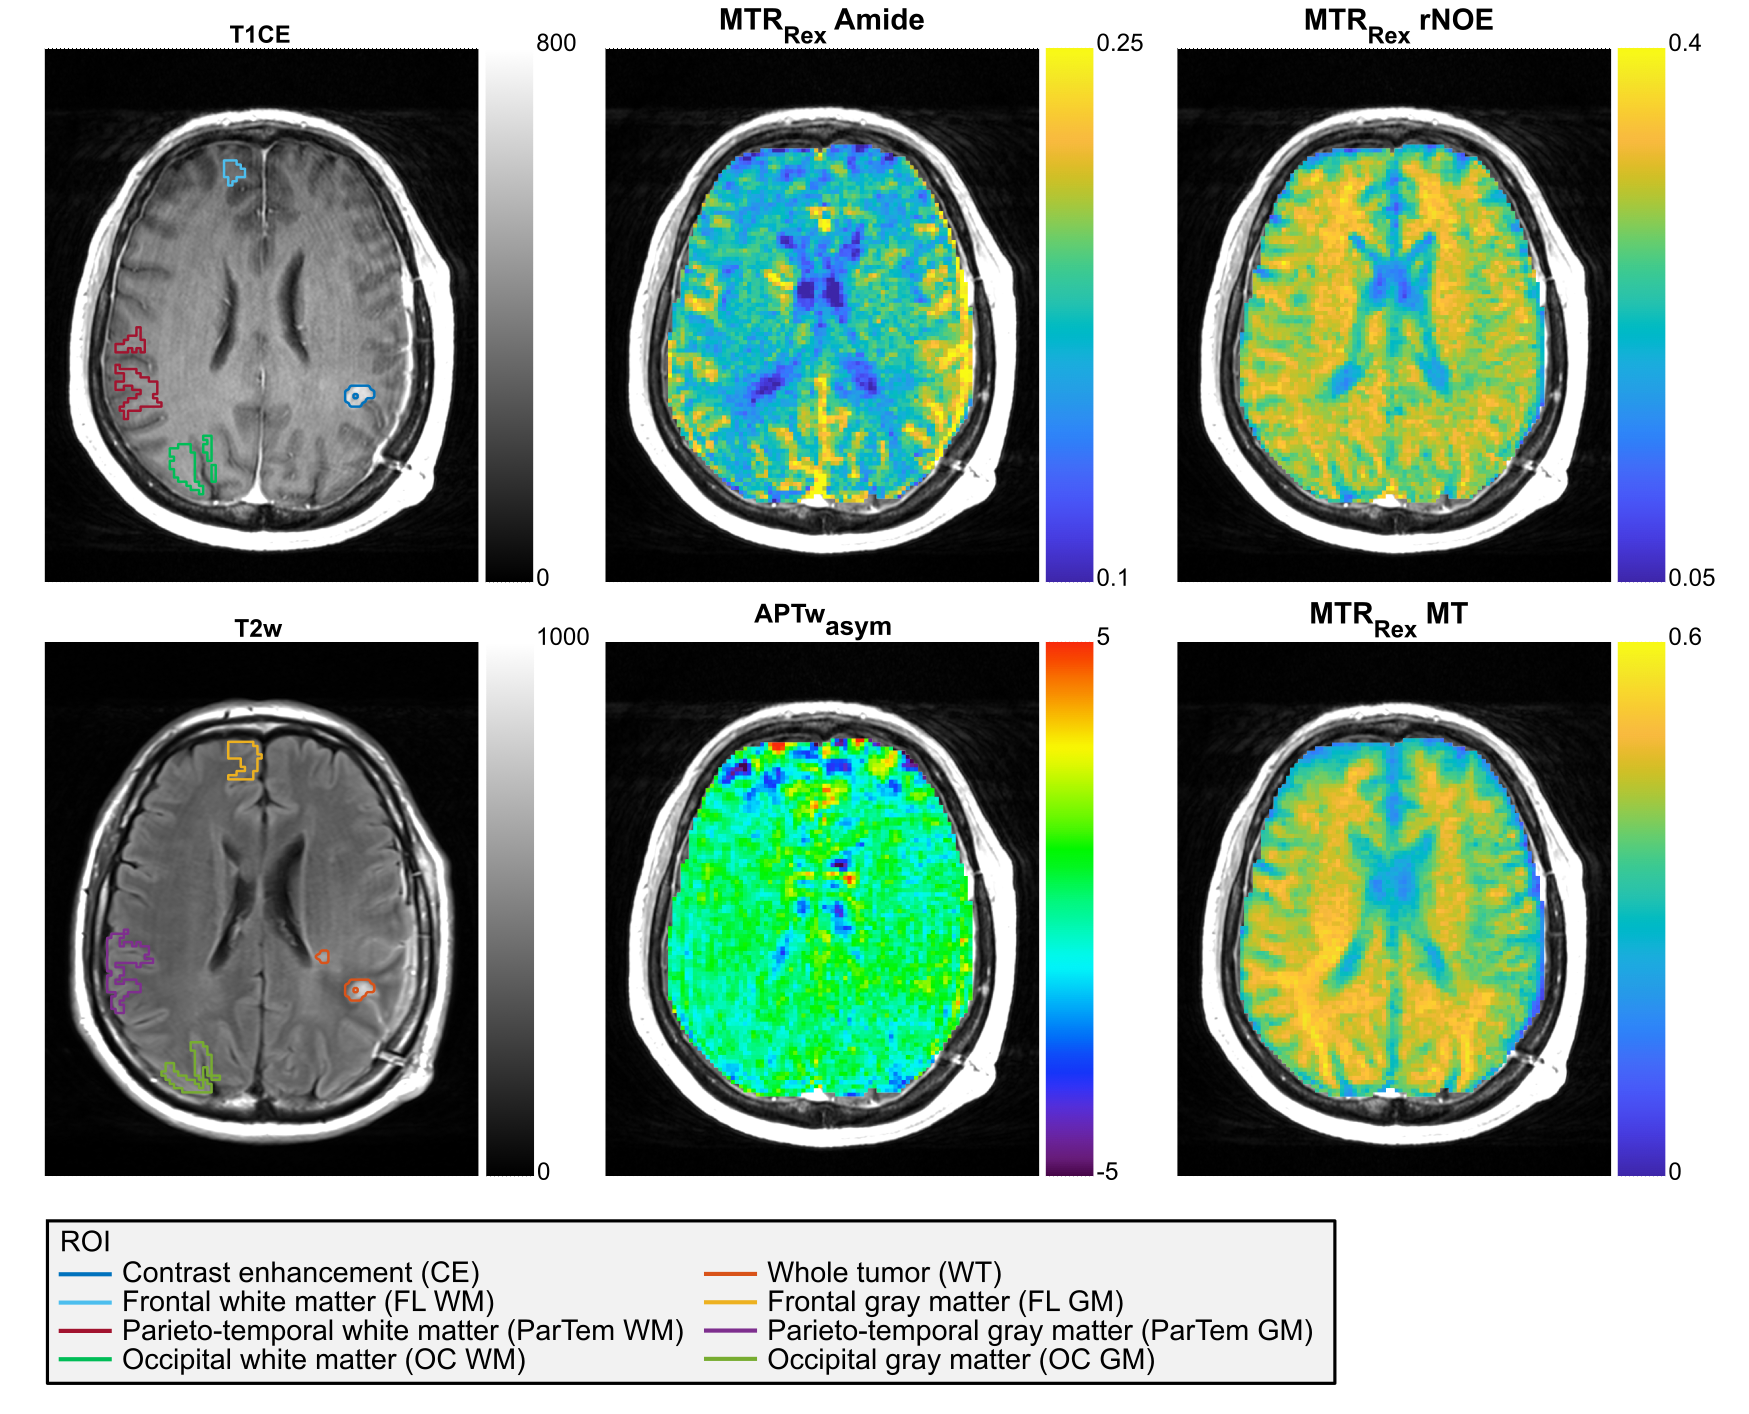
CE and WT (Edema + CE) ROIs and the contralaterally automatically selected WM (top T1CE) and GM (bottom T2w) ROIs are shown for a representative glioma patient (Slice 10 of 12). Furthermore, the conventional APTwasym signal as well as the relaxation-compensated contrasts (MTRRex) for the isolated APT, rNOE and MT are displayed. The patient shows a hyperintense GM MTRRexAmide contrast which appears to decrease towards the frontal lobe. MTRRexrNOE and MTRRexMT both show a hyperintense WM contrast and a clear hypointense CE region, but regional differences are not apparent.