0896
Combining Hyperpolarized Magnetic Resonance and Positron Emission Tomography to Interrogate Prostate Cancer Metabolism
Jose Santiago Enriquez1,2, Prasanta Dutta1, Ryan C Armijo1, Muxin Wang1, Jenny Jie Han1, Peter Shepherd3, Daniel Frigo1,2, Mark Titus3, Federica Pisaneschi1, and Pratip Bhattacharya1,2
1Cancer System Imaging, UT MD Anderson Cancer Center, Houston, TX, United States, 2UT MD Anderson Cancer Center UT Health Science Center Houston Graduate School of Biomedical Sciences, Houston, TX, United States, 3Genitourinary Medical Oncology, UT MD Anderson Cancer Center, Houston, TX, United States
1Cancer System Imaging, UT MD Anderson Cancer Center, Houston, TX, United States, 2UT MD Anderson Cancer Center UT Health Science Center Houston Graduate School of Biomedical Sciences, Houston, TX, United States, 3Genitourinary Medical Oncology, UT MD Anderson Cancer Center, Houston, TX, United States
Synopsis
Keywords: PET/MR, Cancer, Prostate Cancer, Metabolic Imaging, Hyperpolarized MR
Many advanced prostate cancer patients receiving anti-androgens (Enzalutamide) as the first line of treatment, develop resistance which relapses into metastatic castrate-resistant prostate cancer (mCRPC). Treatment options for mCRPC patients are limited and continue to pose a significant oncological challenge with an alarming low survival rate of only 28%. The overarching goal of this research is thus to develop personalized metabolic imaging modality to target treatment strategies of different metabolic sub-types of prostate cancer by targeting pyruvate-to-lactate metabolism by hyperpolarized [1-13C]-pyruvate MR and fatty acid oxidation by 18F-FPIA PET.Introduction
There is an unmet clinical need for robust imaging biomarkers to distinguish indolent from aggressive prostate cancer (PCa).1 Many advanced and aggressive prostate cancer patients receiving anti-androgens (Enzalutamide) as the first line of treatment, develop resistance which relapses. It is growing recognition that dysregulated cell metabolism is a key driver for PCa progression and resistance to therapy. Two pathways that are commonly involved in PCa are glycolysis and the fatty acid metabolism. Therefore, comprehensive metabolic imaging and metabolomics study were performed on Enzalutamide sensitive/resistant, Androgen Receptor dependent (AR+) and AR independent (AR-) patient derived xenograft (PDX) tumors. To interrogate the dysregulated metabolism on both pathways, [1-13C]-pyruvate hyperpolarized magnetic resonance spectroscopy (HP-MRS) and [18F]-fluorodeoxyglucose positron emission tomography (18F-FDG-PET) for glycolysis, and [18F]-fluoro-pivalic acid positron emission tomography (FPIA-PET) for fatty acid metabolism were employed. 1H Nuclear Magnetic Resonance (NMR) spectroscopy and liquid chromatography with tandem mass spectrometry (LC-MS-MS) were employed for validation purposes.Methods
[1-13C]-labeled pyruvic acid was hyperpolarized using a commercial DNP HyperSense polarizer following standard protocol.2 Anatomical MRI and 13C-MRS were obtained on different PCa PDX mouse models at two different time points using a Bruker 7T scanner. These PDX models included 183-A (AR+, Enzalutamide Sensitive), 180-30 (AR+, Enzalutamide Sensitive), 274-4 (AR+, Enzalutamide Resistant), 144-4 (AR-) and 114-B (AR-). The time points imaged were before and after 7 days of treatment with Enzalutamide. High-resolution 1H-NMR spectroscopy on PDX tissue samples were performed on a 500 MHz spectrometer coupled with cryogenic temperature probe. Simultaneously, 18F-FPIA was synthesized and purified as reported and PET images were acquired on the same models on an Albira trimodal PET/SPECT/CT image station.3Results/Discussion
AR (+/-) PCa-PDX tumors that are sensitive and resistance to Enzalutamide were employed in this in vivo metabolic imaging study. The dynamic metabolic flux ratio, lactate-to-pyruvate (Lac/Pyr) was determined in vivo and used as a treatment response marker. The Lac/Pyr ratios were significantly higher in resistant tumors compared to sensitive tumors (p<0.01) as shown in Figure 1. Also observed, the Enzalutamide sensitive group had a lower Lac/Pyr ratio after treatment, while the Enzalutamide resistant group had a higher Lac/Pyr ratio after treatment. A significant difference in [18F]-FDG uptake between these two cohorts of AR (+/-) mice was also observed, higher uptake on the AR+ mice compared to the AR- group. (Figure 2) After treatment with Enzalutamide, there was also a decrease in uptake, corresponding to the HP-MRS data. This was expected as both Pyruvate and [18F]-FDG interrogate the glycolytic pathway. As for the fatty acid metabolic pathway, PET imaging also revealed that [18F]-FPIA is transported into the tumors (Figure 3), and we are currently exploring how its uptake varies between AR (+/-) PCa-PDX tumors and Enzalutamide resistant/sensitive models. Ex vivo NMR and mass spectrometry-based metabolomics depicted higher lactate levels in drug resistant tumors and validated the in vivo HP-MRS data.Conclusion
Metabolic imaging combining [1-13C]-pyruvate HP-MRS and [18F]-PET presents an exciting opportunity to realize imaging-based personalized medicine in different AR (+/-) PCa-PDX preclinical models by interrogating glycolysis and fatty acid oxidation pathways.Acknowledgements
This research was funded in part by a grant from Department of Defense (W81XWH-21-1-0763) (PB), Cancer Prevention and Research Institute of Texas (RP220313) (FP), Mike Slive Foundation (PB), Center for Biomedical Imaging (CABI) -QP3 (PB), General Electric Healthcare and CABI MI2 grant (PB), Koch Foundation (PB, MT). This work also was supported by the National Institutes of Health/NCI Cancer Center Support Grant under award number P30 CA016672.References
1. Lin, C., Salzillo, T.C., Bader, D.A., Wilkenfeld, et al. Prostate cancer energetics and biosynthesis. Prostate Cancer. 2019;185-237.
2. Zacharias N et al. Androgen Receptor Signaling in Castration-Resistant Prostate Cancer Alters Hyperpolarized Pyruvate to Lactate Conversion and Lactate Levels In Vivo. Mol Imaging Biol. 2019;21(1):86-94.
3. Witney TH et al. Preclinical evaluation of 3-18F-fluoro-2,2-dimethylpropionic acid as an imaging agent for tumor detection. J Nucl Med. 2014;55(9):1506-12.
Figures
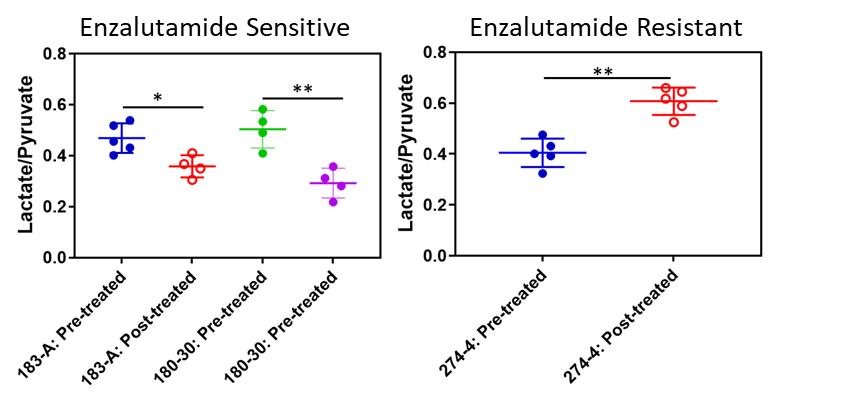
Figure 1. Lactate/Pyruvate 13C HP-MRS spectra and ratios between Enzalutamide resistant/sensitive groups. Each
group was treated with Enzalutamide for 7 days.
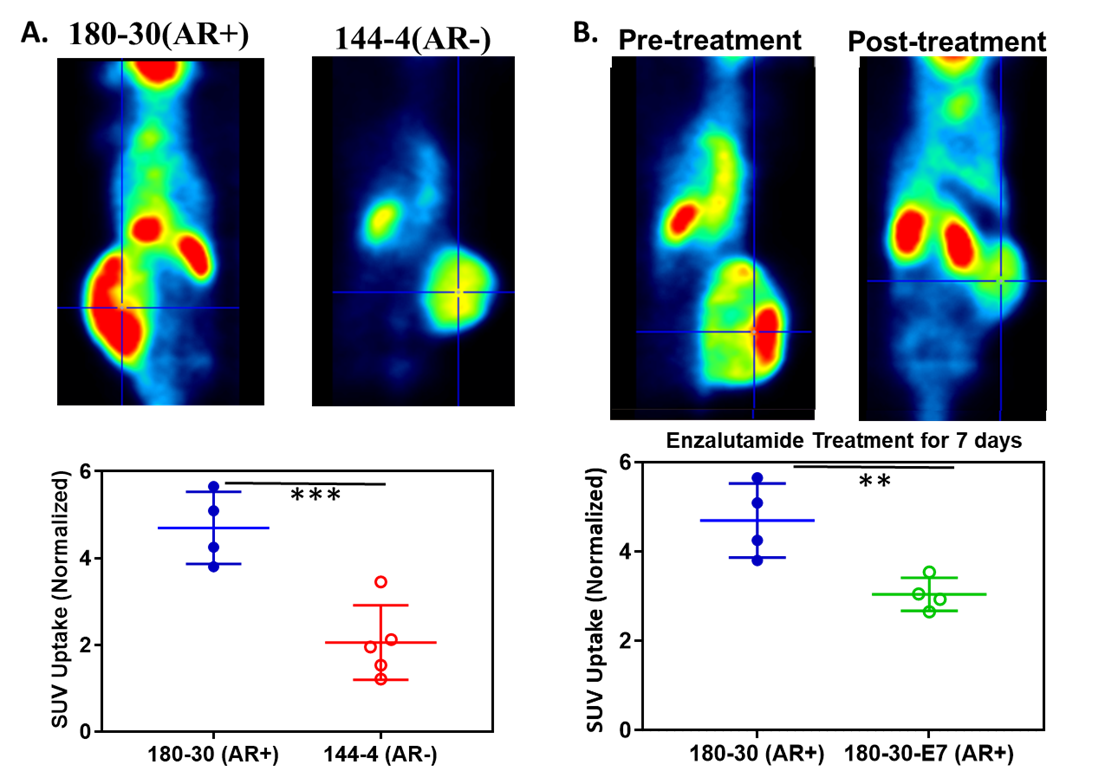
Figure 2. [18F]-FDG uptake in different PDX PCa
Mouse models. A) Uptake difference in model 180-30 (AR+) and 144-4
(AR-). B) Decrease in uptake when the 180-30 model was treated with
Enzalutamide for 7 days.
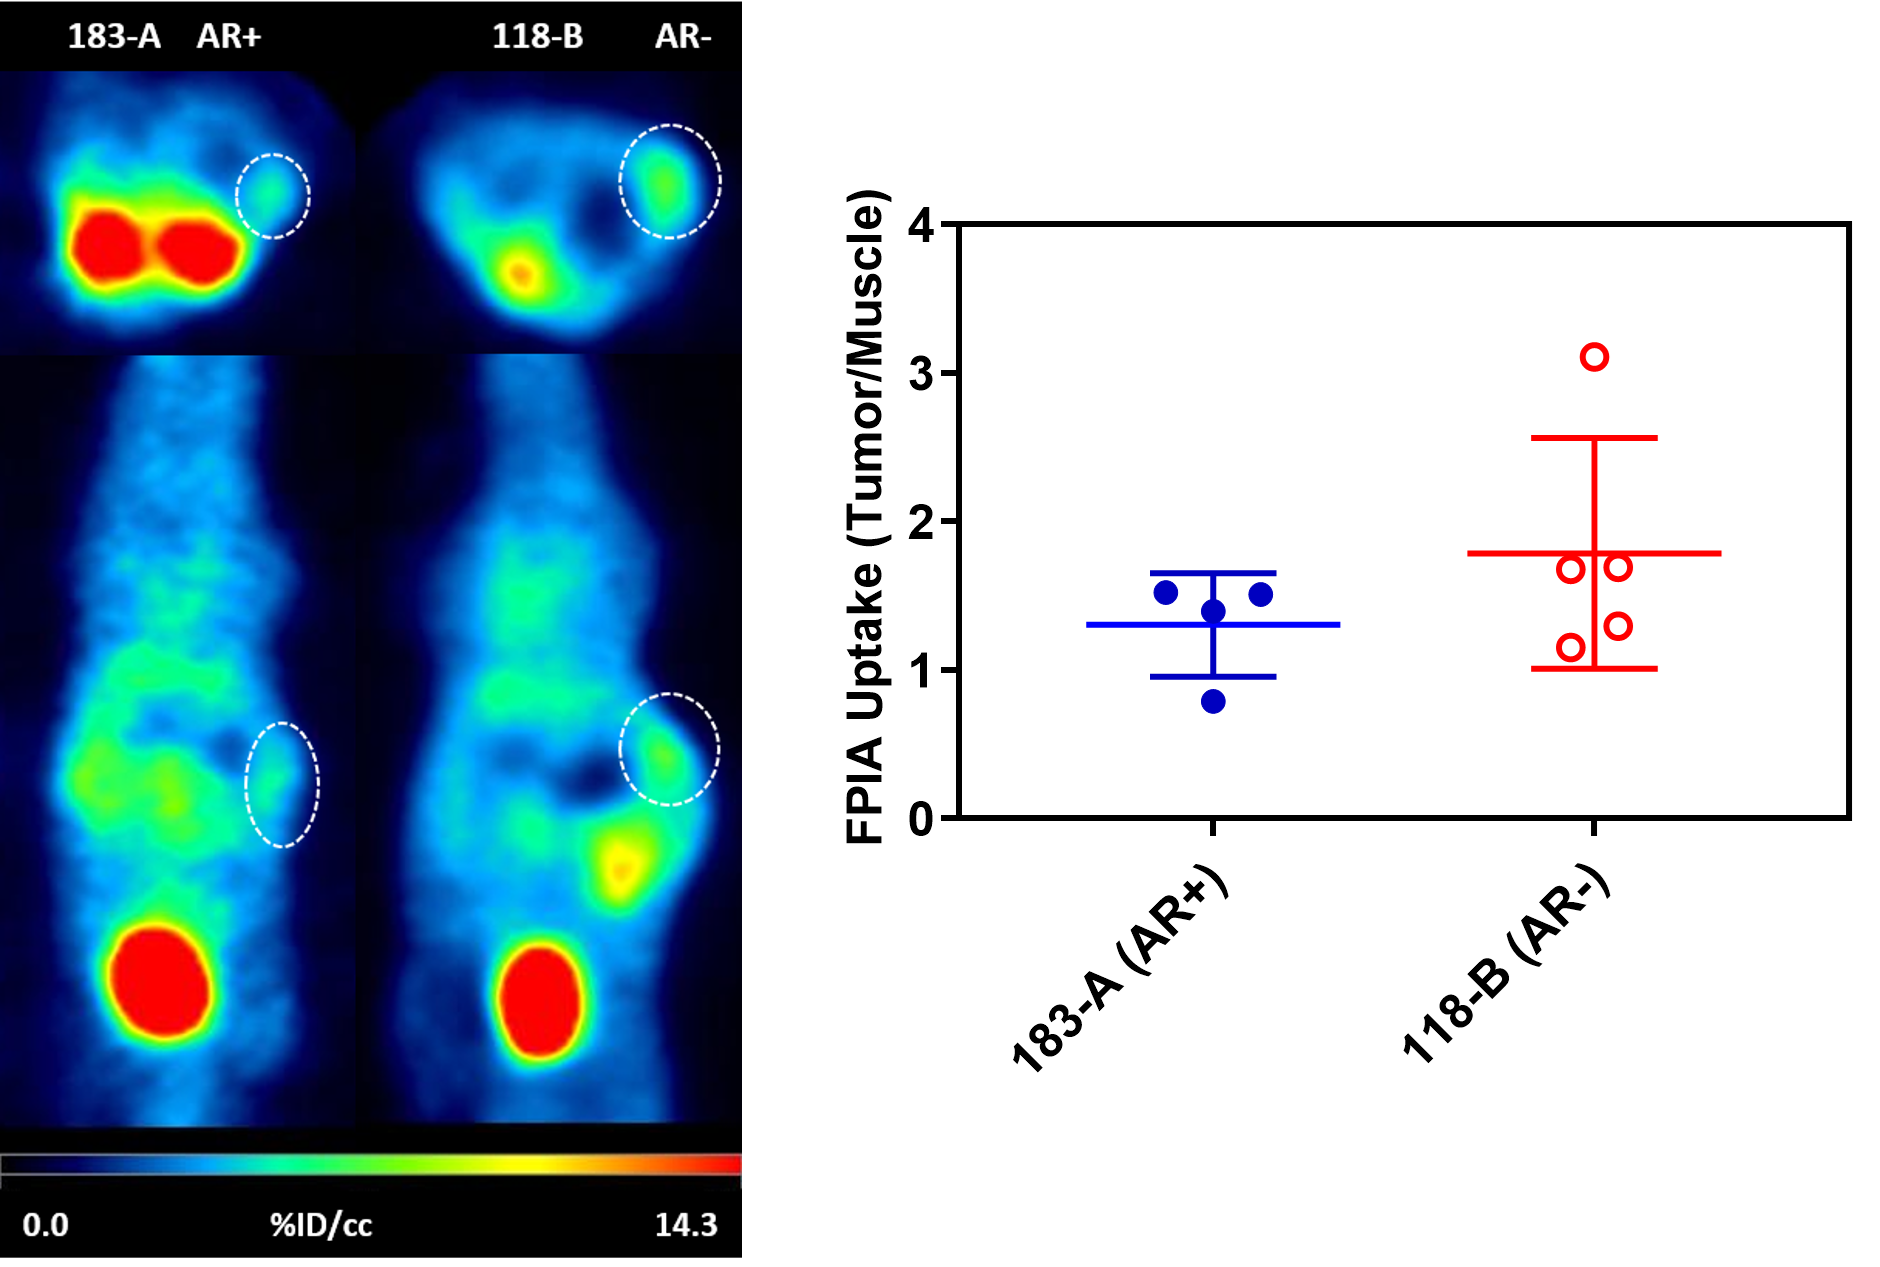
Figure 3. PET uptake of [18F]-FPIA on two
different PCa PDX models, 183-A(AR+) and 118-B(AR-).
DOI: https://doi.org/10.58530/2023/0896