0894
Oxygen-Enhanced MRI Assessment of Radiotherapy-Induced Treatment Effects in Patients with Head and Neck Cancer
Michael J Dubec1,2, John Gaffney3, David L Buckley2,4, Michael Berks1, Anubhav Datta1,5, Damien J McHugh1,2, Ross A Little1, Susan Cheung1, Christina Hague3, Julian C Matthews6, Ananya Choudhury1,3, Marcel van Herk1, Andrew McPartlin7, Geoff JM Parker8,9, and James PB O'Connor1,5,10
1Division of Cancer Sciences, University of Manchester, Manchester, United Kingdom, 2Christie Medical Physics and Engineering, The Christie NHS Foundation Trust, Manchester, United Kingdom, 3Clinical Oncology, The Christie NHS Foundation Trust, Manchester, United Kingdom, 4Biomedical Imaging, University of Leeds, Leeds, United Kingdom, 5Radiology, The Christie NHS Foundation Trust, Manchester, United Kingdom, 6Neuroscience and Experimental Psychology, University of Manchester, Manchester, United Kingdom, 7Radiation Medicine, Princess Margaret Cancer Centre, Toronto, ON, Canada, 8Bioxydyn Ltd, Manchester, United Kingdom, 9Centre for Medical Image Computing, University College London, London, United Kingdom, 10Radiotherapy and Imaging, Institute of Cancer Research, London, United Kingdom
1Division of Cancer Sciences, University of Manchester, Manchester, United Kingdom, 2Christie Medical Physics and Engineering, The Christie NHS Foundation Trust, Manchester, United Kingdom, 3Clinical Oncology, The Christie NHS Foundation Trust, Manchester, United Kingdom, 4Biomedical Imaging, University of Leeds, Leeds, United Kingdom, 5Radiology, The Christie NHS Foundation Trust, Manchester, United Kingdom, 6Neuroscience and Experimental Psychology, University of Manchester, Manchester, United Kingdom, 7Radiation Medicine, Princess Margaret Cancer Centre, Toronto, ON, Canada, 8Bioxydyn Ltd, Manchester, United Kingdom, 9Centre for Medical Image Computing, University College London, London, United Kingdom, 10Radiotherapy and Imaging, Institute of Cancer Research, London, United Kingdom
Synopsis
Keywords: Cancer, Head & Neck/ENT, Tumour Hypoxia, Radiotherapy, OE-MRI, MR Linac
Hypoxia is common to most solid tumours and mediates treatment resistance. Oxygen-enhanced (OE)-MRI can identify, map and quantify hypoxia in multiple tumour types including H&N cancer. We build upon previous work to show that OE-MRI biomarkers: (i) can be deployed on multiple MRI systems; (ii) are repeatable; (iii) can detect cohort level response to radiotherapy; (iv) can identify which individual lesions have significant changes in their oxygenation, hypoxic volume and hypoxic fraction.Introduction
Hypoxia is seen in solid tumours, and its presence and extent, indicates poor prognosis and treatment resistance. Oxygen enhanced (OE)-MRI shows promise as a non-invasive method of quantifying hypoxia1. Our previous work shows that OE-MRI can detect hypoxia modification2, is feasible in the head and neck (H&N) region and is translatable to MR-guided radiotherapy systems3. Both the oxygen-induced change in longitudinal relaxation rate (ΔR1) and the part of the tumour that is perfused but insensitive to oxygen change (oxygen refractory (pOxy-R)) have been used as biomarkers1,2,3,4. Here, we sought to assess radiotherapy-induced treatment effects in patients with H&N cancer at both a cohort and individual level on two MR systems.Methods
Patients with H&N squamous cell cancer were recruited after research ethics approval and written informed consent. Imaging was performed on either a 1.5 T Philips Ingenia MR-RT (diagnostic MR) or a 1.5 T Elekta-Philips Marlin (MR linac) system. Each underwent (chemo)radiotherapy.Patients were imaged on the diagnostic MR (N = 14) and MR linac (N = 5) systems. Imaging included T1 measurement (3D inversion recovery turbo field echo (IRTFE), 3x3x5mm, TI = 100, 500, 800, 1100, 4300ms) and dynamic OE acquisition using the same IRTFE sequence with TI = 1100 ms, temporal resolution = 12s. Oxygen was delivered via a gas blender at a flow rate of 15 l/min and high concentration oxygen mask, alternating between medical air (dynamics 1-25), 100% oxygen (dynamics 26-70), and medical air (dynamics 71-91). Dynamic contrast enhanced (DCE)-MRI was acquired using a T1-FFE Dixon sequence (3x3x5mm, 3.8s temporal resolution) with IV contrast agent injection (Dotarem, 3 ml/s, 0.2ml/kg). A post contrast T1-weighted acquisition with fat saturation permitted lesion volume delineation. A Eurospin TO5 phantom was used to evaluate native T1 measurement repeatability and drift.
Image processing and analysis was carried out in MATLAB (Mathworks). Motion correction was carried out using Elastix5. From 19 patients, a total of 32 lesions including primary tumour and involved lymph node volumes were delineated by a H&N oncologist. T1 maps permitted conversion of signal to ΔR1 (= R1,O2 - R1,air) during oxygen inhalation. DCE-MRI signal and dynamic OE-MRI signal data were combined to identify voxels which were significantly enhancing (p<0.05) between pre- and post-contrast or air and 100% oxygen. Voxels which were identified as enhancing on DCE-MRI but not on OE-MRI data were classed pOxy-R, indicating hypoxia. The pOxy-R volume was also measured. The repeatability coefficient (RC) and within-subject coefficient of variation (wCV) were estimated for each parameter from patients who underwent both pre-treatment scans (N = 12). Paired t-tests assessed change in derived parameters compared to baseline measurements.
Results
T1 measurements acquired in the phantom on both diagnostic and MR linac systems were highly repeatable (Figure 1). Difference in mean T1 value on the diagnostic MRI was 4 (±6) ms (RC = 14 ms, wCV = 1%). In comparison, difference in mean T1 value on the MR Linac was 7 (±7) ms (RC = 18 ms, wCV = 1%). Comparison of the two MRI systems showed difference in mean T1 of 8 (±18) ms (RC = 37 ms, wCV = 2%). ΔR1 time-courses for gels in the Eurospin phantom indicated negligible signal drift on both systems.All imaging was well tolerated. Lesion measurement repeatability (across the two systems) was: RC = 0.016 s-1, wCV = 29% for ΔR1, RC = 0.16, wCV = 15% for pOxy-R fraction, and RC = 7cm3, wCV = 13% for pOxy-R volume (figure 2). A significant increase in ΔR1 was found at the cohort level at both weeks 2 (p < 0.001) and 4 (p = 0.006) of treatment. Significant decreases in pOxy-R fraction were found at weeks 2 (p < 0.001) and 4 (p = 0.004) of treatment, accompanied by significant decreases in pOxy-R volume at weeks 2 (p = 0.002) and 4 (p = 0.03) of treatment (figure 3). The number of lesions exhibiting change greater than measurement RC was determined for each parameter (figure 4; data shown for week 2). Reduction in hypoxia (within 95% CI of RC) was seen in: 11/26 for ΔR1, 15/26 for pOxy-R fraction, 11/26 for pOxy-R volume. 8/26 of whole lesion volume (WLV) reduced, of which 4/8 WLV reductions were independent of hypoxia change. In one case hypoxia was increased following therapy (pOxy-R fraction 1/26).
Discussion and Conclusion
We investigated OE-MRI assessment of changes in lesion hypoxia in patients with H&N cancer following radiotherapy. We show:1. OE-MRI biomarkers can be deployed across multiple MRI systems at 1.5 T.
2. Good repeatability of OE-MRI derived parameters: ΔR1, pOxy-R fraction and pOxy-R volume.
3. Significant cohort level changes in these parameters from pre-treatment to 2 weeks of (chemo)radiotherapy, that were maintained at 4 weeks.
4. Repeatability assessment enables identification of which lesions had significant change in hypoxia.
5. Hypoxic changes were independent of WLV changes.
Overall, we conclude that OE-MRI can monitor changes in lesion hypoxia during therapy1,2. Both the volume of hypoxic lesion and the fraction of hypoxia within the lesion were quantified and may be putative biomarkers for future multi-centre assessment of patients with hypoxic lesions on MR linac systems.
Acknowledgements
This work was supported by funding from the Medical Research Council and Cancer Research UK.References
- O’Connor et al. Oxygen-Enhanced MRI Accurately Identifies, Quantifies, and Maps Tumor Hypoxia in Preclinical Cancer Models. Cancer Res. 2016;76(4):787-95.
- Salem A et al. Oxygen-enhanced MRI Is Feasible, Repeatable, and Detects Radiotherapy-induced Change in Hypoxia in Xenograft Models and in Patients with Non-small Cell Lung Cancer. Clin Cancer Res. 2019;25(13):3818-29.
- Dubec M et al. First-in-human technique translation of OE-MRI for hypoxia imaging onto an MR Linac system in patient with head and neck cancer. Proceedings from ISMRM 2022.
- Little R, et al. Mapping Hypoxia in Renal Carcinoma with Oxygen-enhanced MRI: Comparison with Intrinsic Susceptibility MRI and Pathology. Radiology. 2018; 288(3):739-747.
- Klein S, et al. elastix: a toolbox for intensity-based medical image registration. IEEE Trans Med Imaging. 2010;29(1):196-205.
Figures
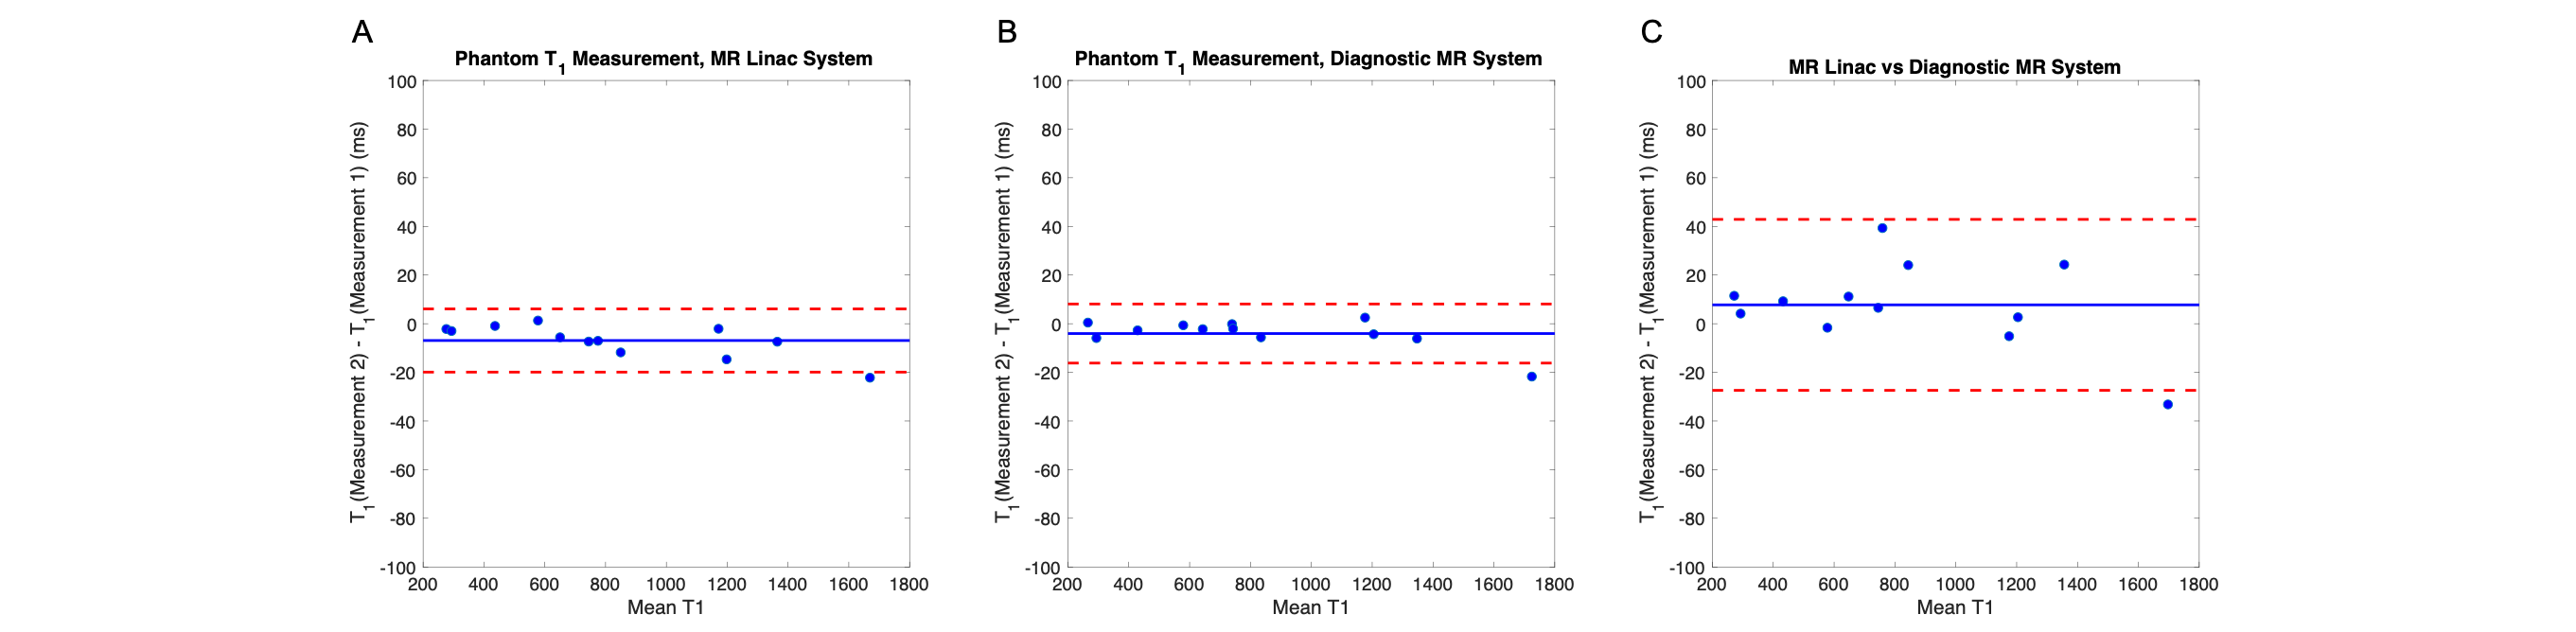
Figure 1. Bland-Altman plots depicting T1 estimates from repeated measurements acquired in a phantom on the (A) diagnostic MR system, (B) MR linac system and (C) between systems.
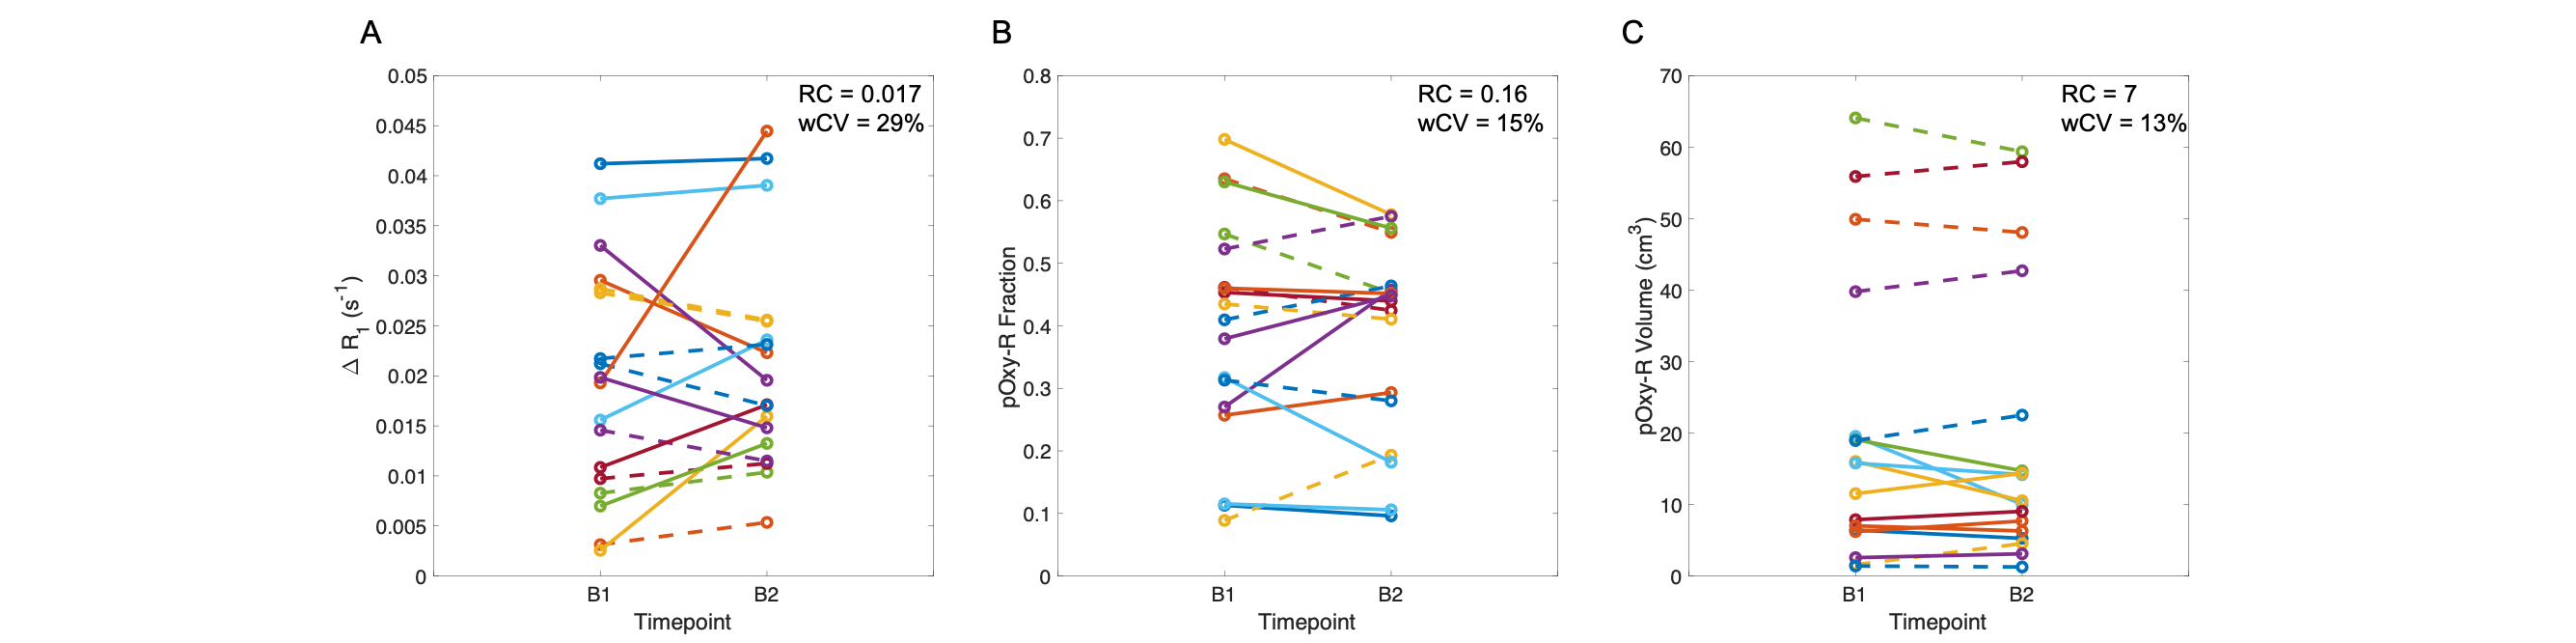
Figure 2. Double-baseline repeatability of (A) ΔR1, (B) pOxy-R fraction and (C) pOxy-R volume, acquired in lesions from 12 patients who underwent pre-treatment double-baseline imaging (primary tumour = solid lines, involved nodes = dashed lines, colour represents patient).
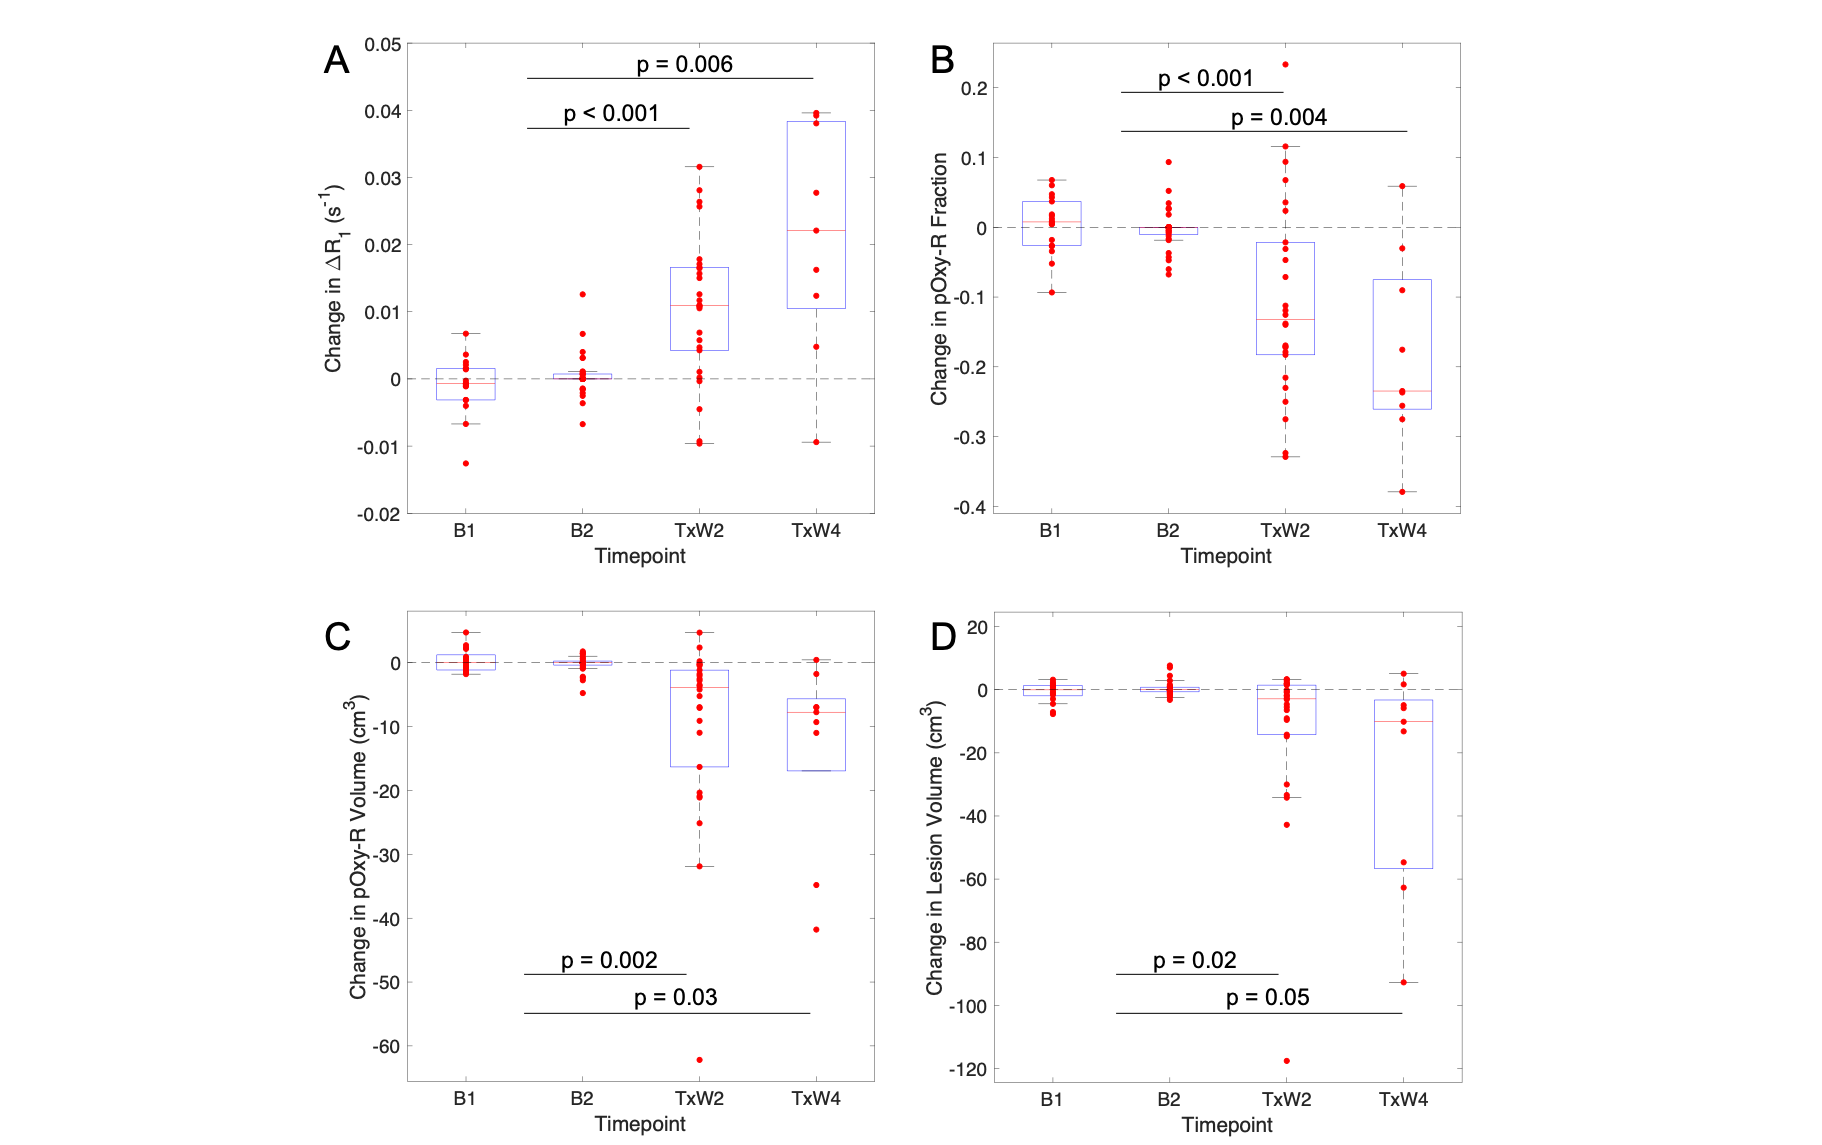
Figure 3. Assessment of treatment effects in patient lesions: (A) ΔR1, (B) pOxy-R fraction, (C) pOxy-R volume and (D) WLV, compared with baseline measurement (note, an average baseline measurement was taken for patients with double-baseline data).
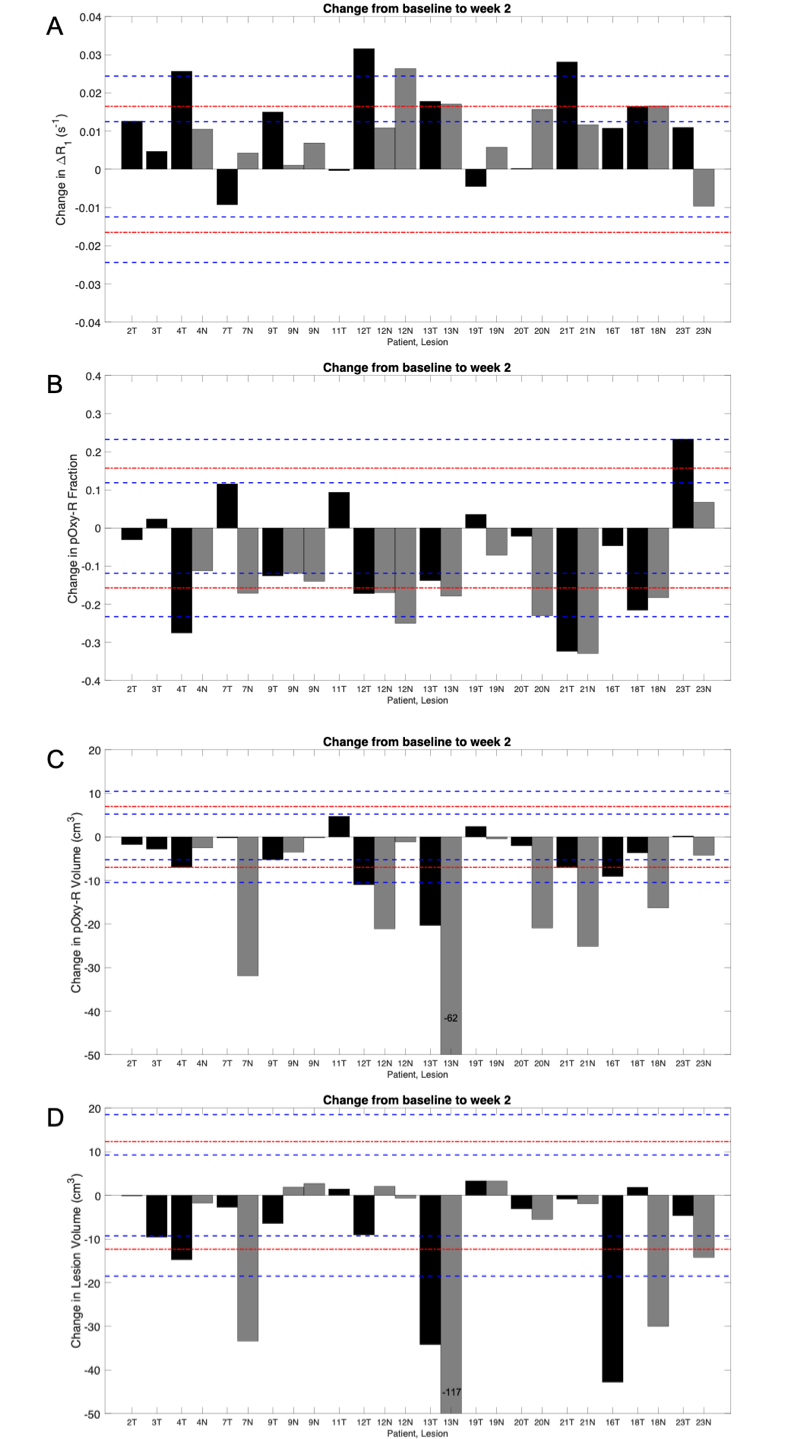
Figure 4. Change from baseline to treatment week 2 for: (A) ΔR1, (B) pOxy-R fraction, (C) pOxy-R volume and (D) WLV. Patient ID and lesion defined on x axis, Black = Primary tumour (T), Grey = lymph node (N). Red line = RC, blue dashed lines = 95% confidence intervals on RC.
DOI: https://doi.org/10.58530/2023/0894