0893
Amide proton transfer image corrected by apparent diffusion coefficient improved diagnostic accuracy in grading brain tumors on a PET/MR system1Department of Clinical Radiology, Graduate School of Medical Sciences, Kyushu University, Fukuoka, Japan, 2Department of Molecular Imaging and Diagnosis, Graduate School of Medical Sciences, Kyushu University, Fukuoka, Japan, 3Department of Radiology Informatics and Network, Graduate School of Medical Sciences, Kyushu University, Fukuoka, Japan
Synopsis
Keywords: Tumors, PET/MR, Amide Proton Imaging, Apparent Diffusion Coefficient, ADC
Amide proton transfer (APT) imaging is useful for grading brain tumors; however, its diagnostic accuracy is compromised by the heterogeneity of the tumor's structure. In this study, we investigated using a PET-magnetic resonance (PET/MR) system whether dividing the APT by the apparent diffusion coefficient (ADC) improves the diagnostic ability of high-grade and low-grade brain tumors by correcting for the effects of tissue structure. The corrected APT (APT/ADC) showed the best diagnostic performance in grading brain tumors compared to APT, ADC, and standardized uptake value (SUV) alone.Purpose
Differentiating between low-grade and high-grade brain tumors is clinically important, since treatment strategies differ substantially depending on tumor grading. Grading of brain tumors by various imaging modalities has been attempted in the past.Amide proton transfer (APT) imaging involves the visualization of the exchange of protons between free tissue water and the amide groups (-NH) of endogenous mobile proteins and peptides.1 Amide proton transfer imaging is useful in grading brain tumors; however, its accurate assessment is compromised by structural inhomogeneity in tumors such as necrotic portion or microcysts of high proteinaceous fluid.2
The PET/MR system enables direct voxel-by-voxel comparison of standardized uptake values (SUV) from fluorodeoxyglucose (FDG)-PET and other functional MR parameters such as the apparent diffusion coefficient (ADC) 3 and APT signal. We previously reported that ADC correction of APT on a PET/MR scanner mitigates the inhomogeneity in tumors and improves the correlation with SUV values in voxel basis.4 However, the ability of ADC-corrected APT in grading brain tumors clinically has not been investigated.
This study aimed to investigate whether ADC-corrected APT improves the grading of brain tumors compared to APT, ADC, or SUV values alone in patients with brain tumors on a PET/MR system.
Methods
<Image Acquisition> We included 19 patients with known brain tumors (eleven high-grade and eight low-grade glioma) in this study and scanned them using an Ingenuity TF PET/MR scanner (Philips Healthcare, Cleveland, OH). The participants underwent FDG-PET imaging with the sampling time of 15 mins, and the images were reconstructed with 23 mm voxels. After PET imaging, we obtained transverse 2D-T2WI to cover the entire tumor volume. We obtained a DWI with a single shot EPI (b = 0 and 1000), and generated an ADC map. Finally, we performed APT imaging with the 3D fast spin-echo Dixon method.5 Briefly, we applied a saturation pulse (duration: 2.0s, power: 2.0μT) at seven different frequency offsets: ± 2.7 ppm, ± 3.5 ppm, ± 4.3 ppm, and -1560 ppm, and repeated the scan three times at +3.5 ppm with echo shifts (ΔTE = 0.4 ms) for Dixon B0 mapping. The APT image corrected by a three-point Dixon-type B0 map was generated. Other parameters were: TR/TE = 3500/5.7 ms, FOV = 212 × 183 mm, acquisition matrix = 116 × 116, voxel size = 1.8 × 1.8 mm, slice thickness = 4.4 mm, slices = 9, and scan duration = 3 m 52 s.<Image Processing> We performed image registration with rigid transformation between the images on an IntelliSpace Portal workstation (version 6.0, Philips Healthcare). The T2WI, ADC map, and FDG-PET image were then resliced and resampled in accordance with the resolution of APT image (1.8 × 1.8 × 4.4 mm). We divided the APT image by the ADC map and generated the APT/ADC maps. On T2WI, we selected the slice with the maximum tumor size and manually drew the region of interest (ROI) along the inner edge of the tumor boundary. The ROI was then copied onto the other images. We recorded the APT signals, SUVs, ADCs, and APT/ADCs on a voxel-by-voxel basis. We compared the SUVmax, the minimum ADC value (ADC min), the 90th-percentile value of the APT signal (APT 90%), and the 90th-ercentile value of the APT/ADC signal (APT/ADC 90%) between the high-grade and low-grade brain tumors using Student’s t-test. We conducted the receiver operating characteristic (ROC) curve analyses to evaluate the diagnostic performance of the parameters in differentiating high-grade from low-grade tumors.
Results and Discussion
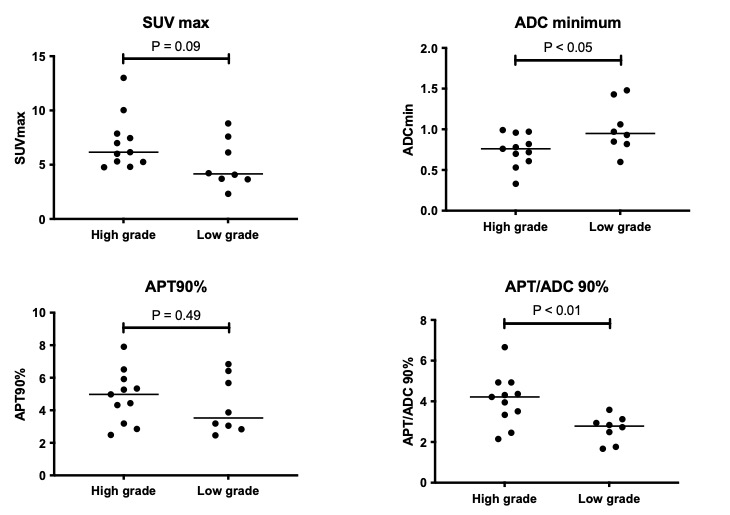
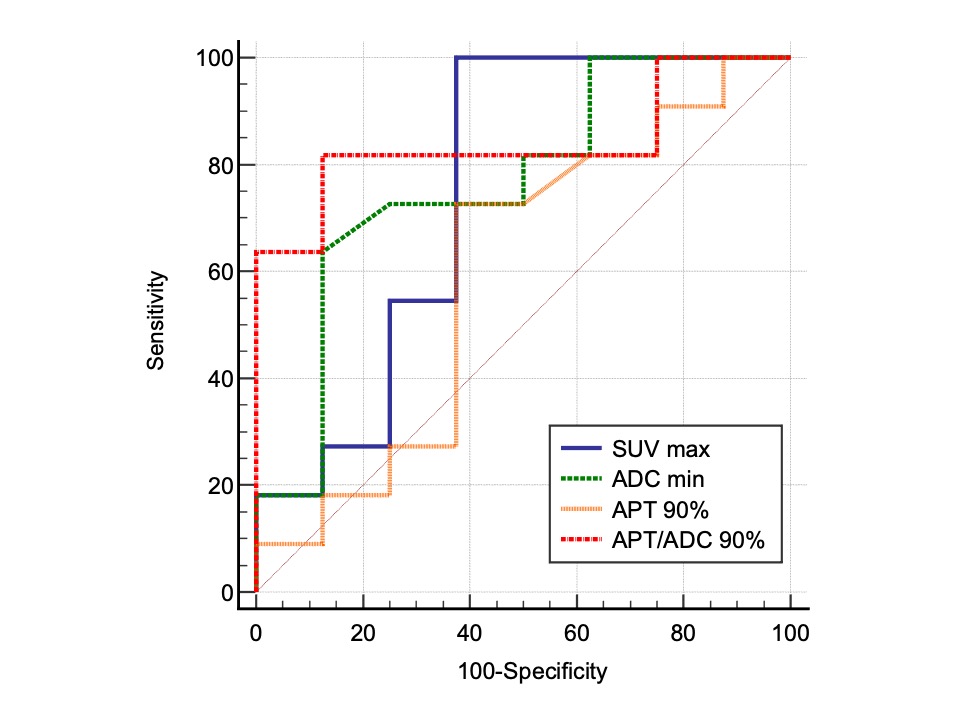
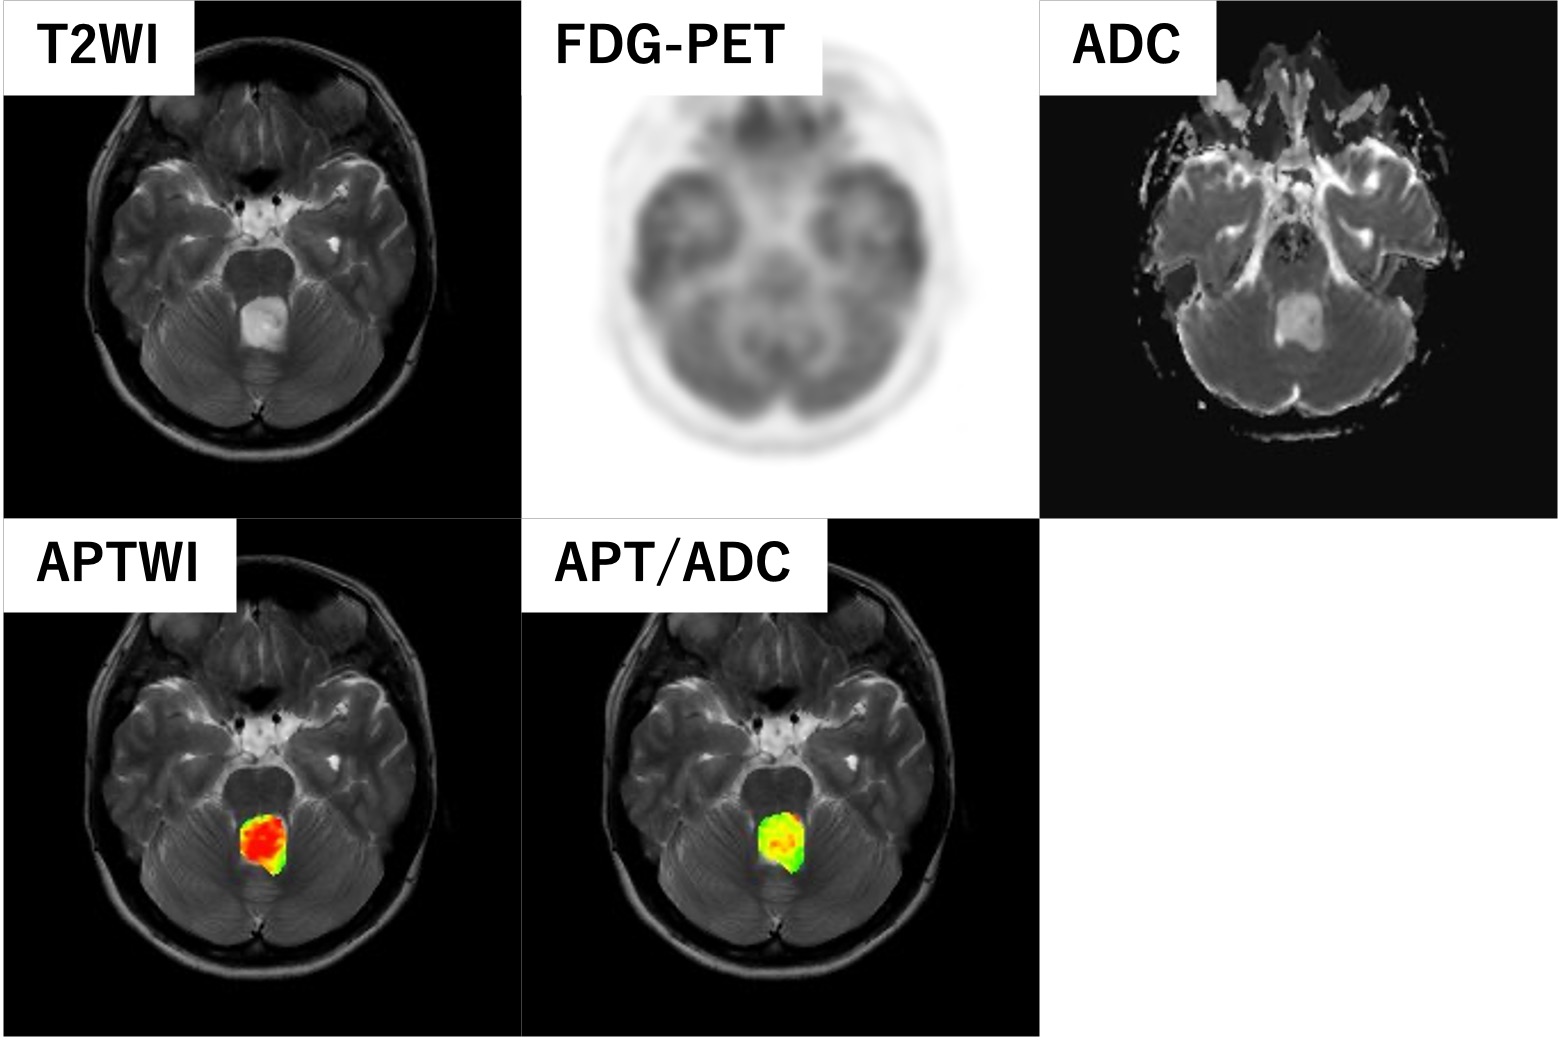
Figure 1 shows comparisons of measured parameters between high-grade and low-grade brain tumors. The ADC min (p < 0.05) and APT/ADC 90% (p < 0.01) showed significant differences between the two groups while the SUV max (p = 0.09) and APT 90% (p = 0.49) were not significantly different. The diagnostic performance of the parameters as determined by the ROC analysis is presented in Figure 2. The APT/ADC 90% showed the highest performance (AUC = 0.84), followed by ADC min (AUC = 0.77). The SUV max (AUC = 0.75), and APT 90% (AUC = 0.60), resulted in low diagnostic performance. The comparisons of ROC curves revealed that the AUC of APT/ADC 90% was significantly higher than that of APT 90% (p < 0.05).A representative case of pilocytic astrocytoma (low-grade tumor) is shown in Figure 3. In this tumor, the APT 90% was above the cutoff value and false positive, but the high ADC value resulted in the APT/ADC 90% being corrected to below the cutoff value, and the tumor was correctly diagnosed as low grade.
Amide proton transfer is determined by both amide-proton concentration and magnetization transfer (MT), or T1/T2,1, 2 which might be affected by structural inhomogeneity in tumors such as microcysts or necrosis with high proteinaceous fluid. The influence of the heterogeneity of the intra-tumor structure on the APT signal could have been corrected by the ADC, which is believed to reflect the tissue structure within the tumor.
Conclusion
Apparent diffusion coefficient-corrected APT showed the best diagnostic performance in grading brain tumors compared to APT, ADC, and SUV alone.Acknowledgements
This study received funding by JSPS KAKENHI Grant Number JP19K08228.
References
1. Vinogradov E, Sherry AD, Lenkinski RE. CEST: from basic principles to applications, challenges, and opportunities. Journal of magnetic resonance (San Diego, Calif: 1997) 2013;229:155-172.
2. Zhou J, Zaiss M, Knutsson L, et al. Review and consensus recommendations on clinical APT-weighted imaging approaches at 3T: Application to brain tumors. Magnetic resonance in medicine 2022;88(2):546-574.
3. Sagiyama K, Watanabe Y, Kamei R, et al. Multiparametric voxel-based analyses of standardized uptake values and apparent diffusion coefficients of soft-tissue tumours with a positron emission tomography/magnetic resonance system: Preliminary results. European radiology 2017;27(12):5024-5033.
4. Sagiyama K, Watanabe Y, Kamei R, et al. Voxel-wise comparison of amide proton transfer (APT) weighted image and fluorodeoxyglucose (FDG)-PET in brain tumors with a PET/MR system. ISMRM 2017
5. Togao O, Keupp J, Hiwatashi A, et al. Amide proton transfer imaging of brain tumors using a self-corrected 3D fast spin-echo dixon method: Comparison With separate B0 correction. Magnetic resonance in medicine 2017;77(6):2272-2279.Figures