0889
Simultaneous PET/MRI can measure extracellular pH in the tumor microenvironment1Department of Cancer Systems Imaging, MD Anderson Cancer Center, Houston, TX, United States, 2Department of Chemistry, Rice University, Houston, TX, United States, 3Department of Molecular Biotechnology and Health Sciences, University of Torino, Torino, Italy, 4Department of Cancer Systems Imaging, UT MD Anderson Cancer Center, Houston, TX, United States
Synopsis
Keywords: PET/MR, Contrast Agent, pH imaging
Acidosis is a useful biomarker for tumor diagnoses and for evaluating early response to anti-cancer treatments. T1-based MRI contrast agents have been developed with a r1 relaxivity that is responsive to extracellular pH (pHe) in the tumor microenvironment. However, the concentration of these agents in the tumor must also be known to determine r1 relaxivity. We have developed PET/MRI co-agents that can be evaluated with simultaneous PET/MRI during pre-clinical studies with mouse models of human cancers. The PET agent reports on the concentration of the agents, which can be used to determine r1 relaxivity and estimate pHe in tumors.INTRODUCTION
Acidosis is a useful biomarker for tumor diagnoses and for evaluating early response to anti-cancer treatments.1 Many T1-based MRI contrast agents have been developed that have a r1 relaxivity that is dependent on pH.2,3 However, to estimate pH from T1-weighted MRI (which measures a change in R1 relaxation rate caused by the agent, or ΔR1), the concentration of the agent ([Gd]) must also be known to determine r1 (where r1 = ΔR1/[Gd]).4 We proposed to use a PET co-agent to determine [Gd], assuming that the [Gd]-to-mCi activity is known at the start of the study (added to a phantom or intravenously injected into a mouse model), and that PET activity can be measured accurately and precisely.5,6 The PET/MRI co-agents can then be monitored during simultaneous PET/MRI to estimate tumor pHe in vivo.METHODS and MATERIALS
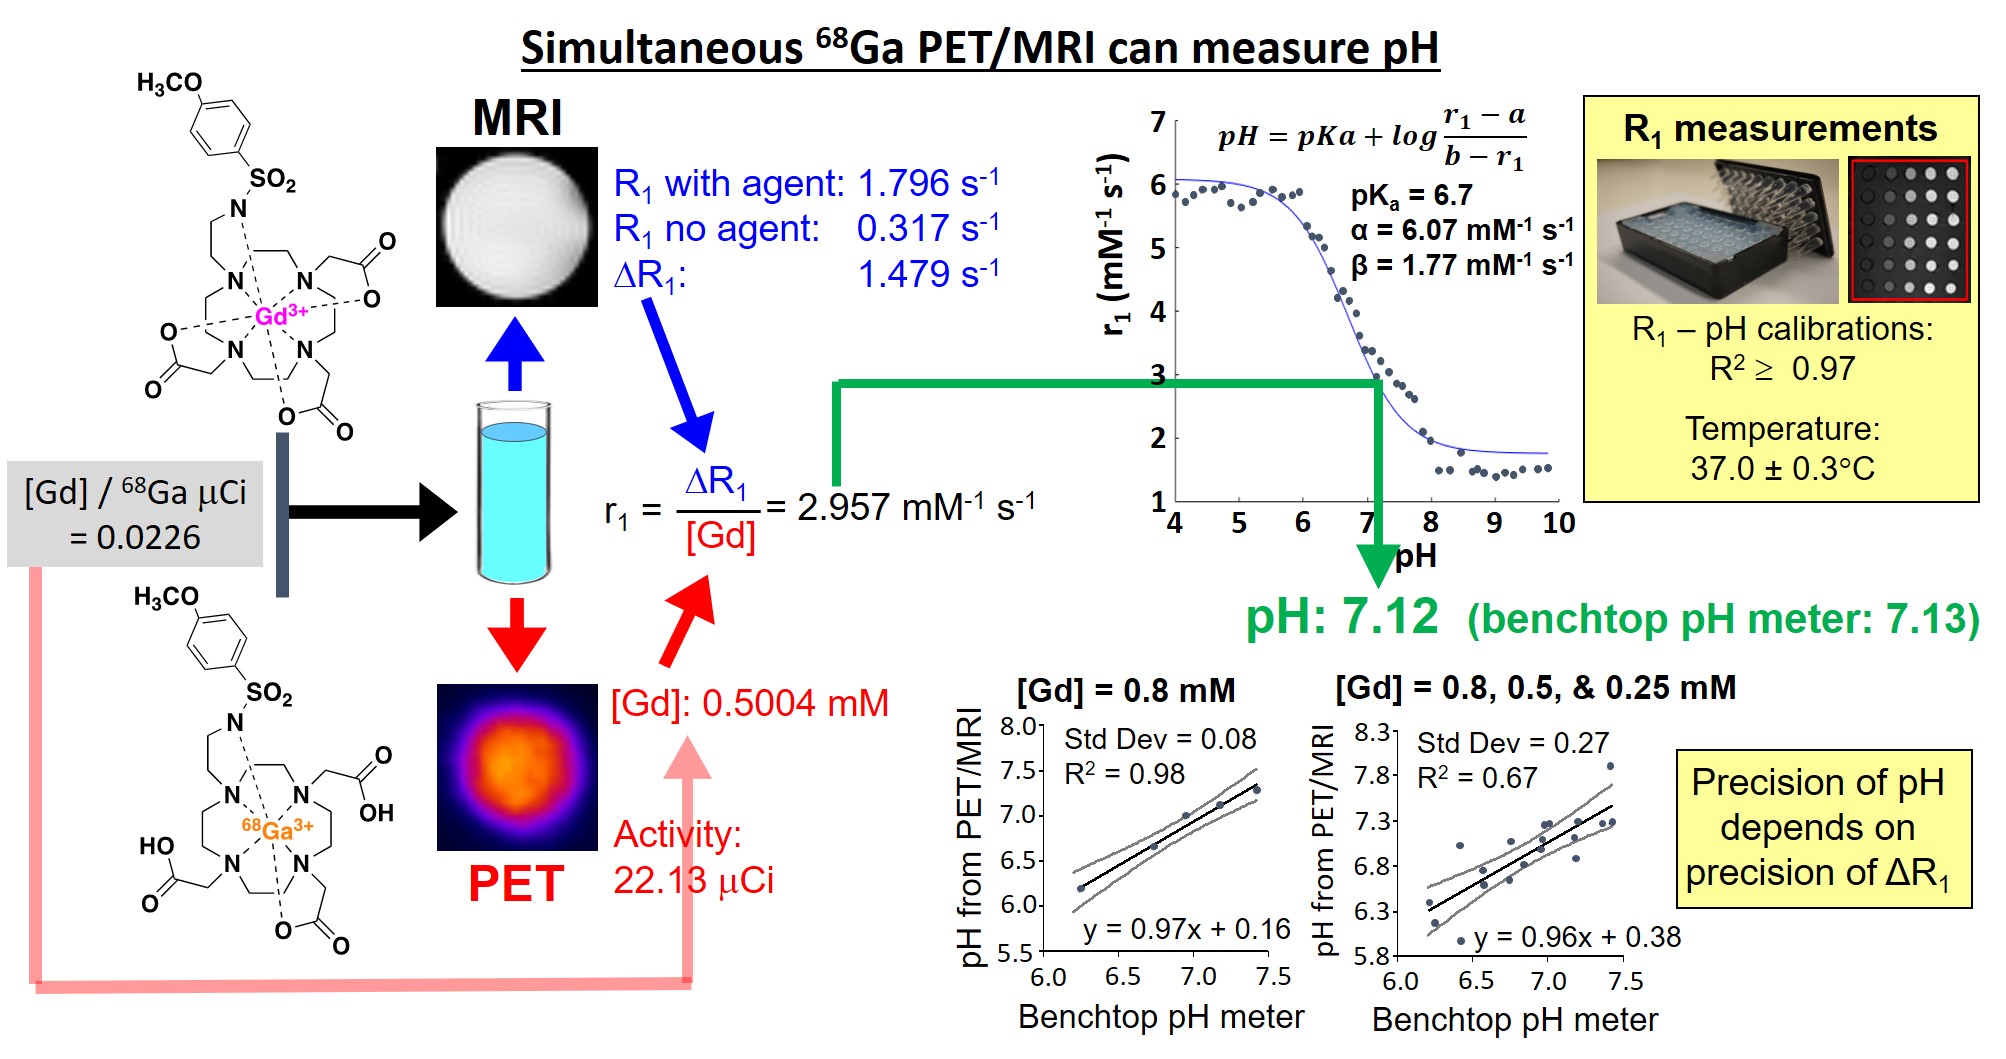
We synthesized a sulfonamide derivative of DO3A that can chelate Gd(III) and 68Ga (Figure 1).6 We also synthesized a variation of the Gd(III) chelate that includes a fluorinated ligand with 19F or 18F isotopes (Figure 3). We determined the r1-pH calibration for the agent using T1 MRI measurements over a range of concentrations and pH values (Figures 1 and 3). We calibrated our PET detector in the MRI magnet so that we could determine [Gd] of the MRI agent based on the detected activity of the PET agent, and we validated our results with ICP-MS. We evaluated the precision of our pH estimates relative to the concentration of our MRI contrast agent. We then used the same workflow to measure tumor pHe in a subcutaneous flank tumor model (Figures 2 and 4). We evaluated the stability of the 68Ga agent using radioHPLC. We validated our in vivo pHe measurements with the 18F/19F co-agents using an in vivo microelectrode.RESULTS and DISCUSSION: Figure 1
We synthesized the Gd-based MRI co-agent in 5 steps with 59% yield, with no evidence of free Gd(III) ion. We synthesized the [Ga68]-Ga-based PET co-agent with the same procedure with 51% yield and 98% radiochemical purity. Both agents were added to a phantom (simulating co-injection in vivo). T1-weighted MRI was used to measure the R1 relaxation rate with and without the agent, to measure ΔR1 caused by the agent. PET activity was measured, which was converted to [Gd] concentration of the MRI agent based on the initial [Gd]-to-mCi activity of the co-agents at “initial injection” into the phantom. The r1 relaxivity was determined from the ratio of ΔR1 to [Gd], which was then converted to a pH estimate based on a pre-determined calibration. Notably, the precision of the pH estimate depended on the [Gd] concentration, indicating hat MRI was the primary source of imprecision.RESULTS and DISCUSSION: Figure 2
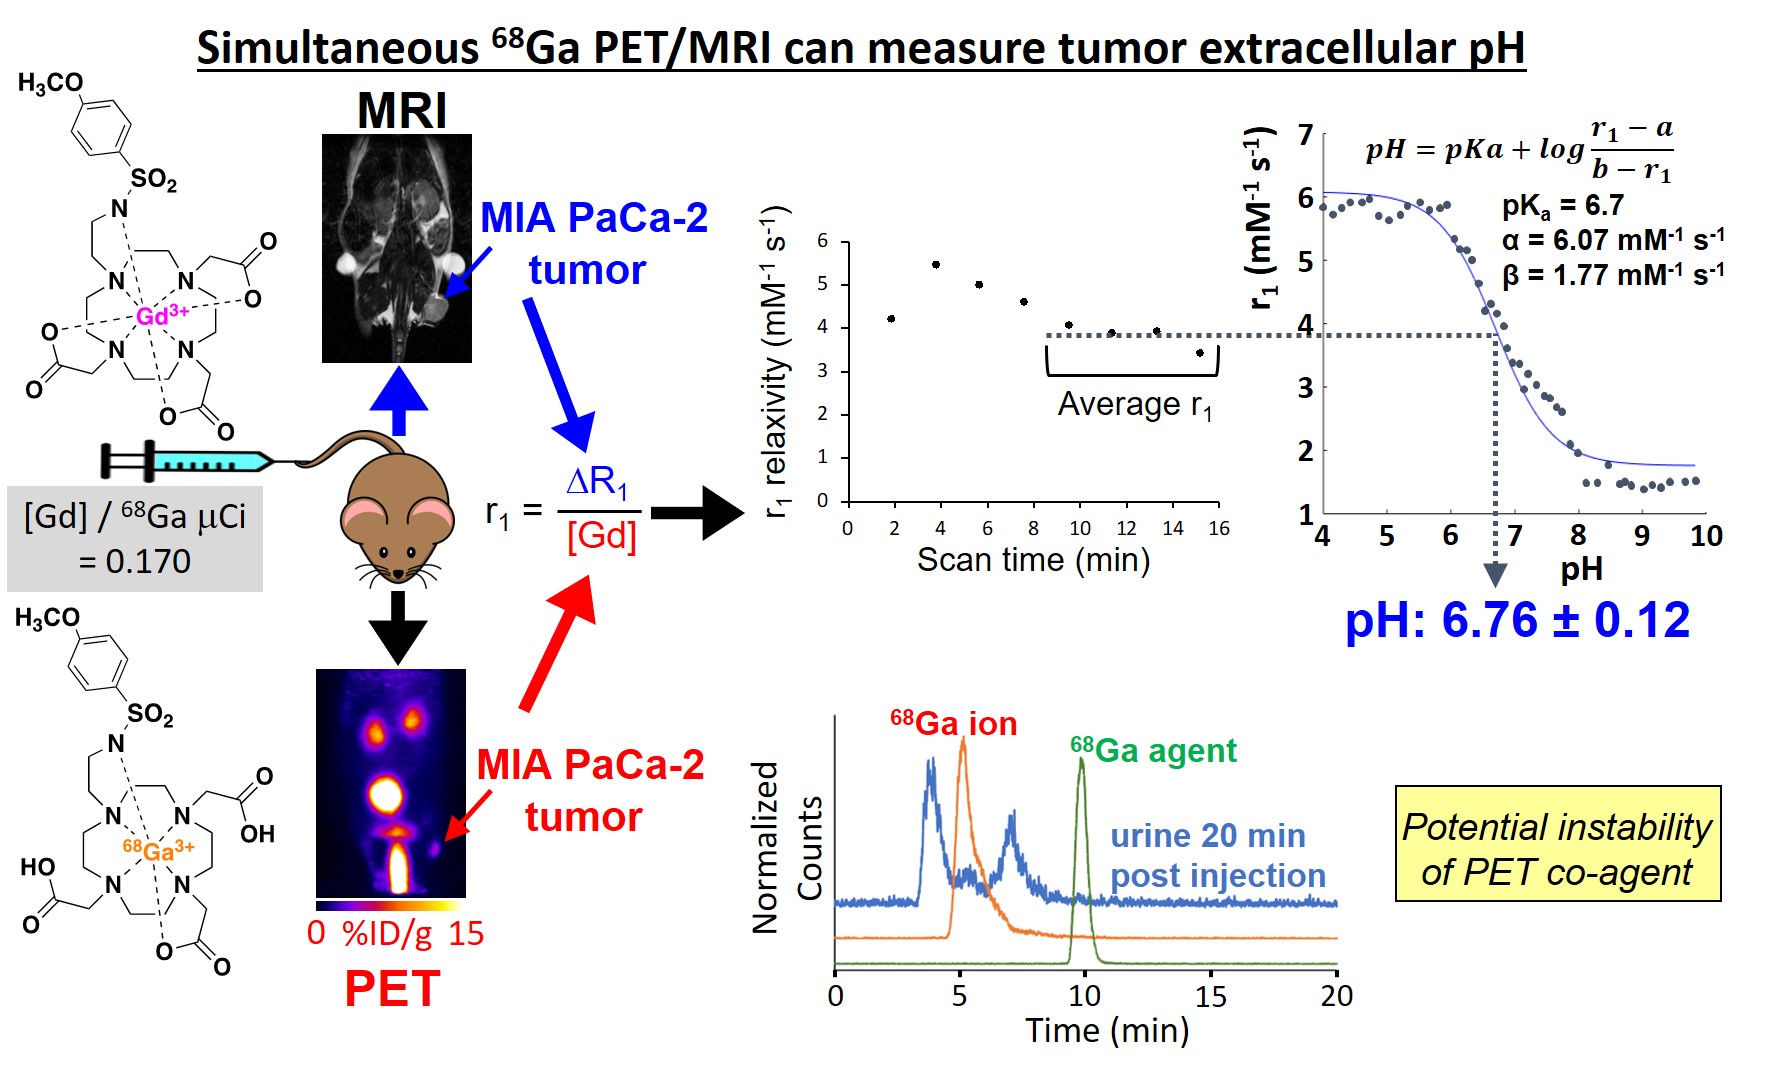
The PET/MRI co-agents tested in Figure 1 were then tested in vivo, in a subcutaneous flank tumor model of 4T1 breast cancer. T1-weighted MRI measured ΔR1. PET measured % injected dose (%ID), which was converted to [Gd] concentration based on our careful calibrations and the known ratio of initially injected [Gd]-to-mCi activity. The r1 was estimated in 2-minute intervals to monitor when the pH estimate was stable, indicating that the MRI agent had reached a sufficiently high concentration for a precise measurement. The pHe measurement showed that the 4T1 tumor was acidic. Unfortunately, the analysis of urine samples indicated that the 68Ga chelate was unstable, compromising the assumption that the PET and MRI co-agents have identical pharmacokinetic delivery and retention in the tumor.RESULTS and DISCUSSION: Figure 3
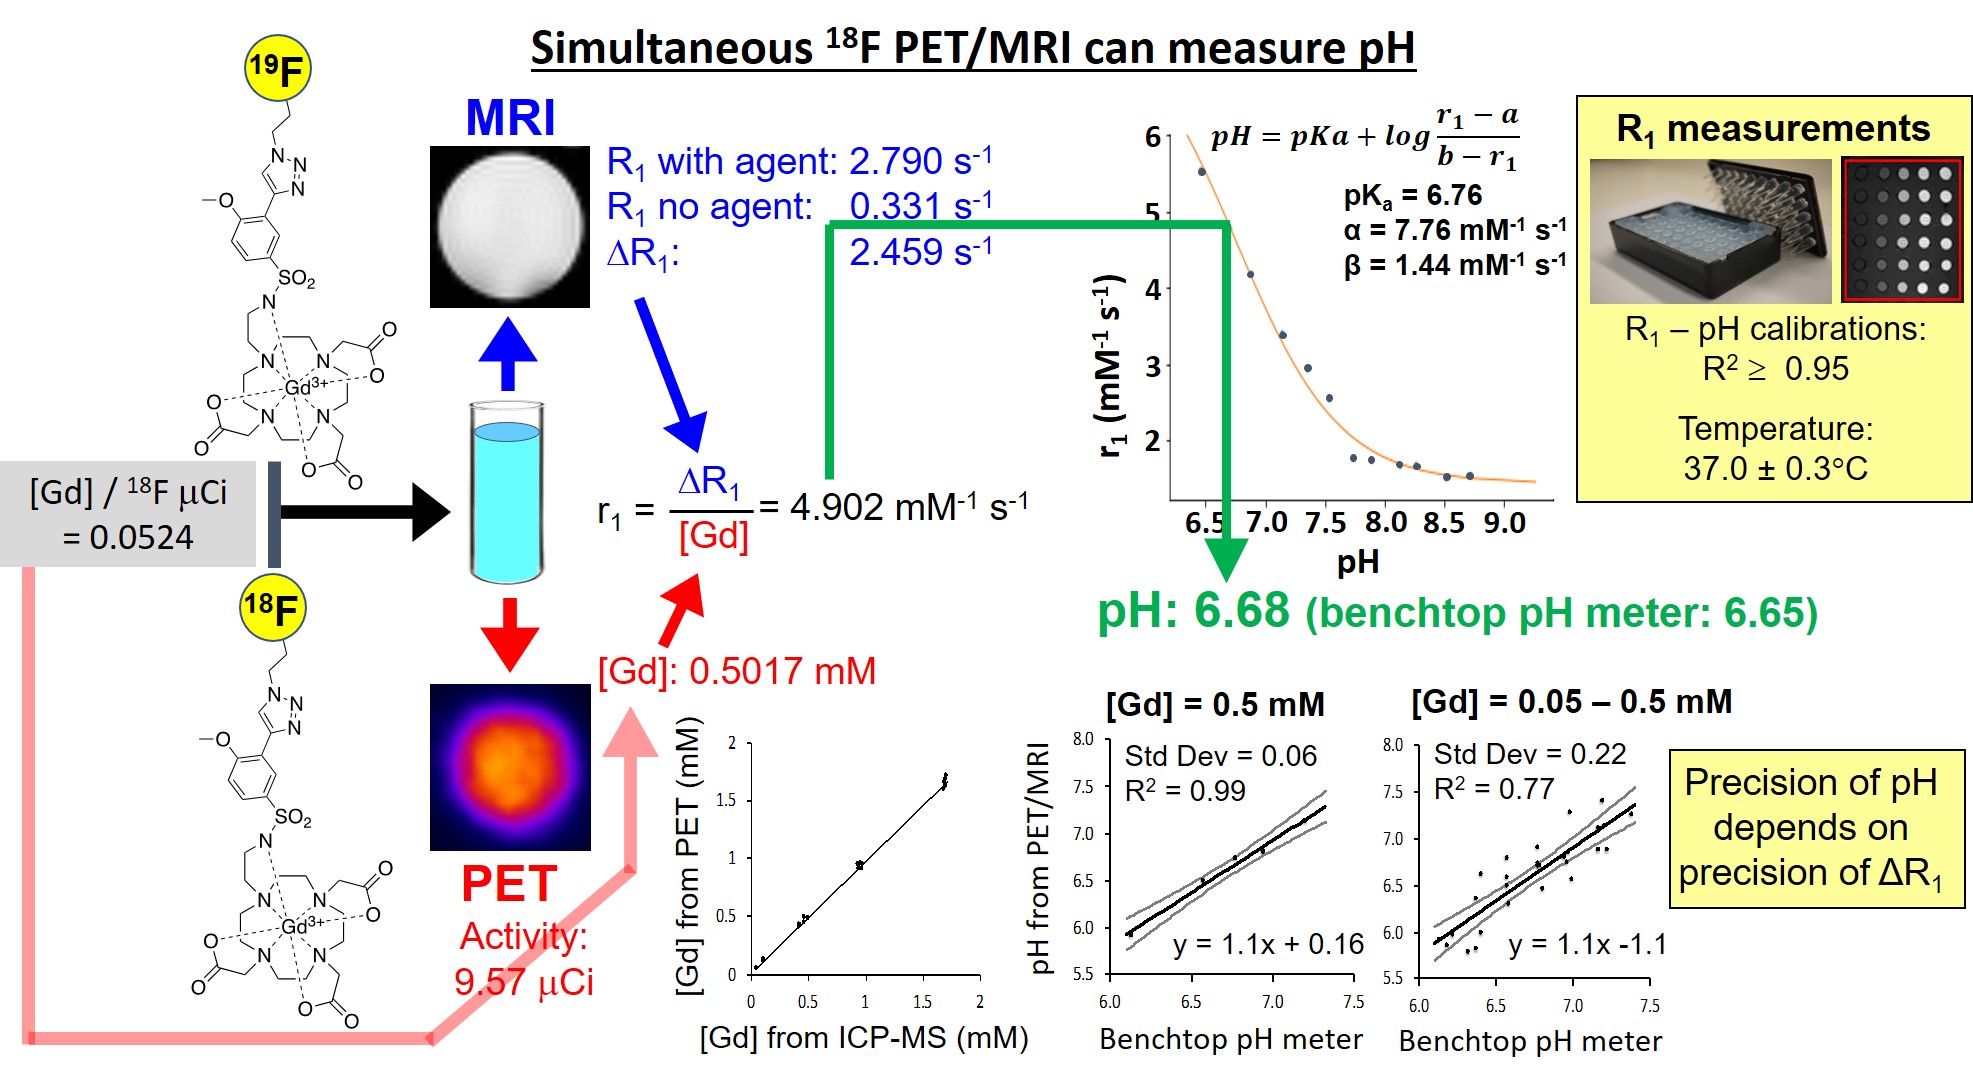
We synthesized a 19F-labeled version of our Gd-based MRI agent shown in Figure 1. We also synthesized a 18F-labeled version for PET. We used the same procedure in Figure 1 to show that the 18F/19F co-agents can measure pH in phantoms (using T1-weighted MRI, and not using 19F MRI). The agent is insoluble at pH < 6.4, so we calibrated R1-pH to a lower limit of pH 6.5. As with Figure 1, the major source of imprecision is due to the MRI component of this measurement.RESULTS and DISCUSSION: Figure 4
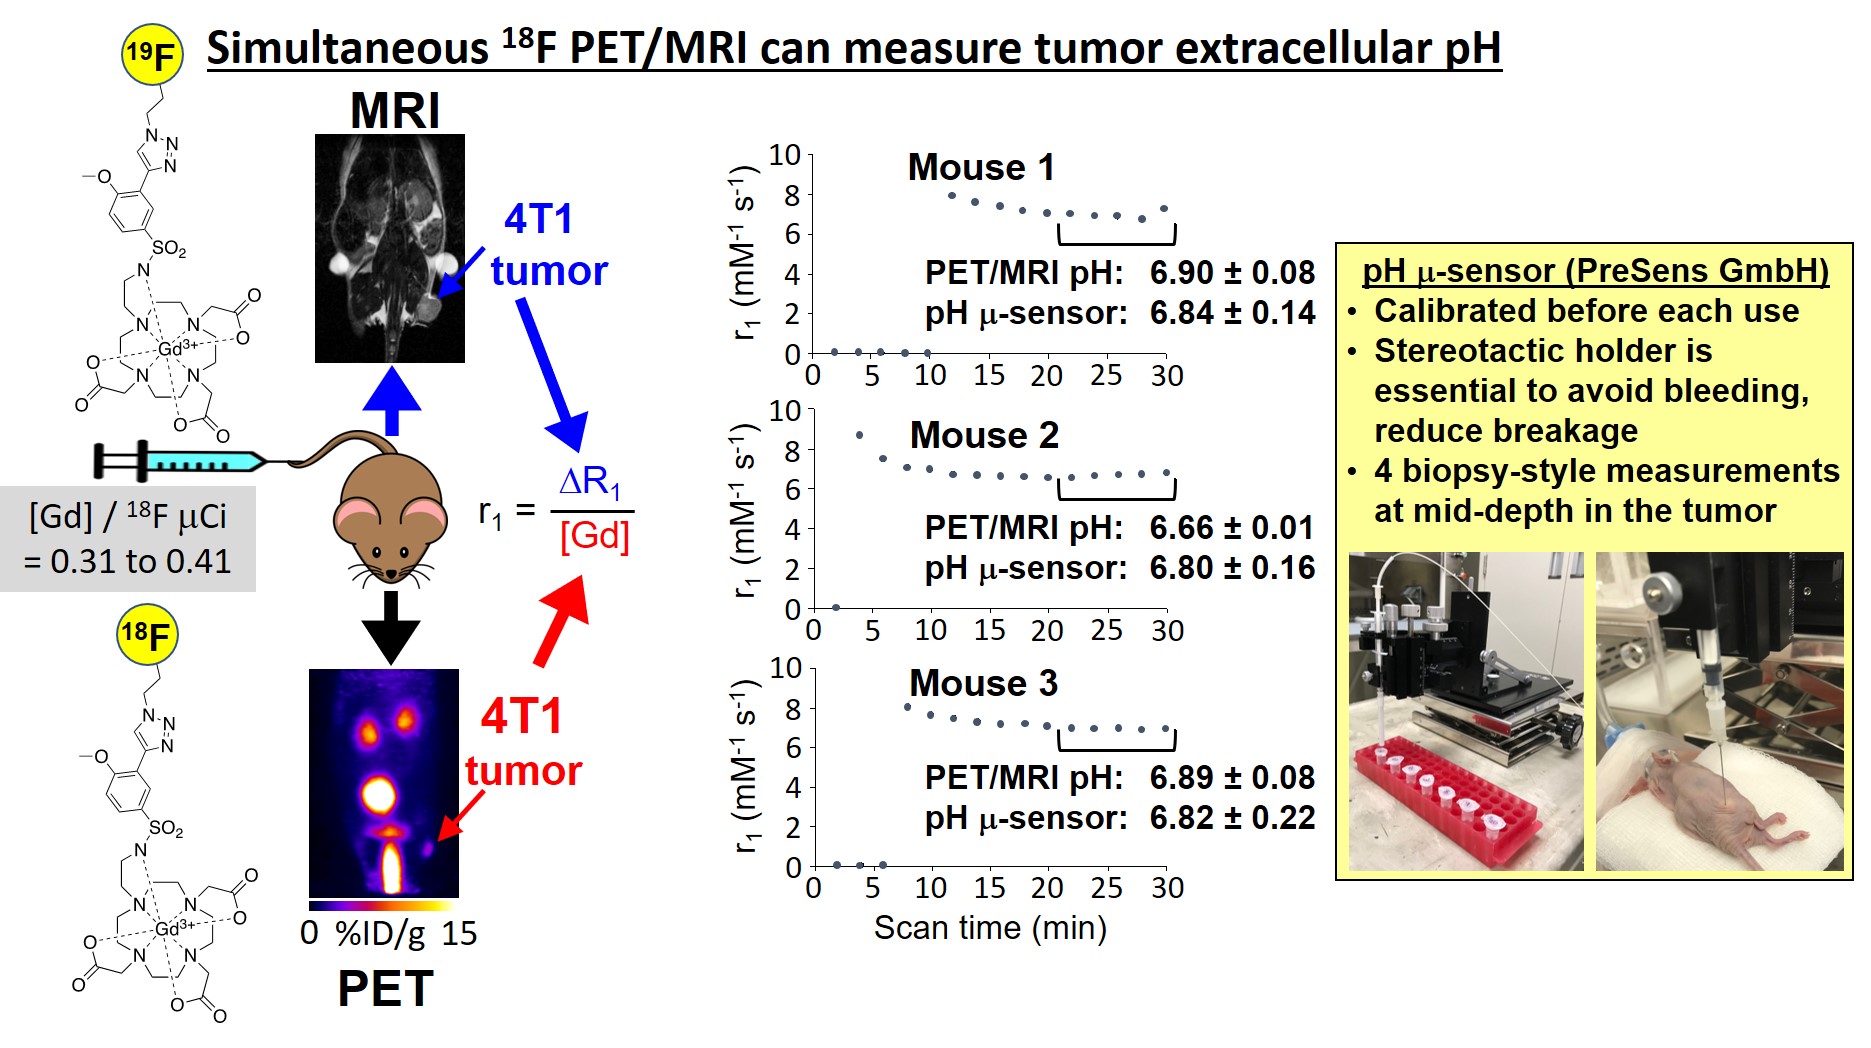
We used the same procedure in Figure 2 to show that the 18F/19F co-agents can measure pHe in vivo, in a MCF7 subcutaneous flank tumor model. The estimated pHe agreed with in vivo pH measurements with a pH microelectrode.CONCLUSIONS
PET/MRI with PET and MRI co-agents can measure tumor pHe. The 18F/19F co-agents are preferred for further development of this new approach for molecular imaging. The solubility of these co-agents should be improved, and a more precise method for measuring R1 relaxation times will improve the precision of pHe measurements.Acknowledgements
Our research is supported by the NIH/NCI through grants R01 CA231513 and P30 CA016672.References
1. Warburg, O. On the Origin of Cancer Cells. Science 1956, 123, 309–314.
2. Yoo, B.; Pagel, M. D. An overview of responsive MRI contrast agents for molecular imaging. Front Biosci 2008, 13, 1733–1752.
3. Hingorani, D. V.; Bernstein, A. S.; Pagel, M. D. A review of responsive MRI contrast agents: 2005–2014. Contrast Media Molec Imaging 2015, 10, 245–265.
4. Ekanger, L. A.; Allen, M. J. Overcoming the Concentration-Dependence of Responsive Probes for Magnetic Resonance Imaging. Metallomics 2015, 7, 405–421.
5. Frullano, L.; Catana, C.; Benner, T.; Sherry, A. D.; Caravan, P. Bimodal MR–PET Agent for Quantitative pH Imaging. Angew Chem Int Ed 2010, 49, 2382–2384.
6. Lowe, M. P.; Parker, D.; Reany, O.; Aime, S.; Botta, M.; Castellano, G.; Gianolio, E.; Pagliarin, R. pH-Dependent Modulation of Relaxivity and Luminescence in Macrocyclic Gadolinium and Europium Complexes Based on Reversible Intramolecular Sulfonamide Ligation. J Am Chem Soc 2001, 123, 7601–7609.
Figures