0888
Mapping the vascular reserve in white matter and basal ganglia using Ferumoxytol-enhanced MRI at 7T1Department of Radiology, NYU Grossman School of Medicine, New York, NY, United States, 2Vilcek Institute of Graduate Biomedical Sciences, NYU Grossman School of Medicine, New York, NY, United States, 3Department of Neurology, Wayne State University School of Medicine, Detroit, MI, United States, 4Department of Radiology, Wayne State University School of Medicine, Detroit, MI, United States
Synopsis
Keywords: Blood vessels, Susceptibility, Cerebral blood volume
In this work, we use high resolution susceptibility weighted imaging (SWI) and ΔR2* to investigate the cerebral blood volume (CBV) in white matter tracts and basal ganglia after the administration of blood-pool contrast agent Ferumoxytol. Utilizing the merit of ultrahigh field and strong T1 and T2* shortening contrast agent, we further probe the effect of microvascular density on capillary CBV in white matter tracts and basal ganglia, which provides additional insights to the vascular reserve at capillary level in white matter and basal ganglia.Introduction
Vascular reserve or capillary cerebral blood volume (CBV) is a crucial hemodynamic parameter of energy supply and tissue viability1. To quantify CBV with MRI, an intravascular contrast agent is often utilized with dynamic susceptibility contrast (DSC) or dynamic contrast-enhanced MRI (DCE)2,3; however, one limitation of these methods is that they overestimate the vascular reserve by including CBV from tissue vascular network beyond capillary level. CBV is an important measurement that could reveal the vascular origin of pathophysiology in tissue such as white matter (WM) and basal ganglia (BG). However, it is challenging to fully disentangle the capillary network in those regions on either DSC or DCE MRI due to the presence of small vessels under submillimeter range or poor vascular contrast. High resolution SWI combined with infusion of Ferumoxytol at ultrahigh field enables us to extract small vessels (~50-100µm) that are not invisible using conventional perfusion method due to amplified T2* dephasing or blooming effect. Moreover, although not directly visible from MRI including Ferumoxytol-enhanced MRI, CBV coming from capillary bed can be measured through the difference of tissue T2* relaxation between pre-contrast and post-contrast scans if the magnetic susceptibility induced by the contrast agent is known4-6. Therefore, in this study, we aim to explore the relationship of vascular density to CBV and characterize the CBV (by removing visible vessels on post-contrast SWI) from different fiber tracts in WM and BG, which may shed new light on pathophysiology in WM and BG in terms of the vascular contribution at capillary level.Methods
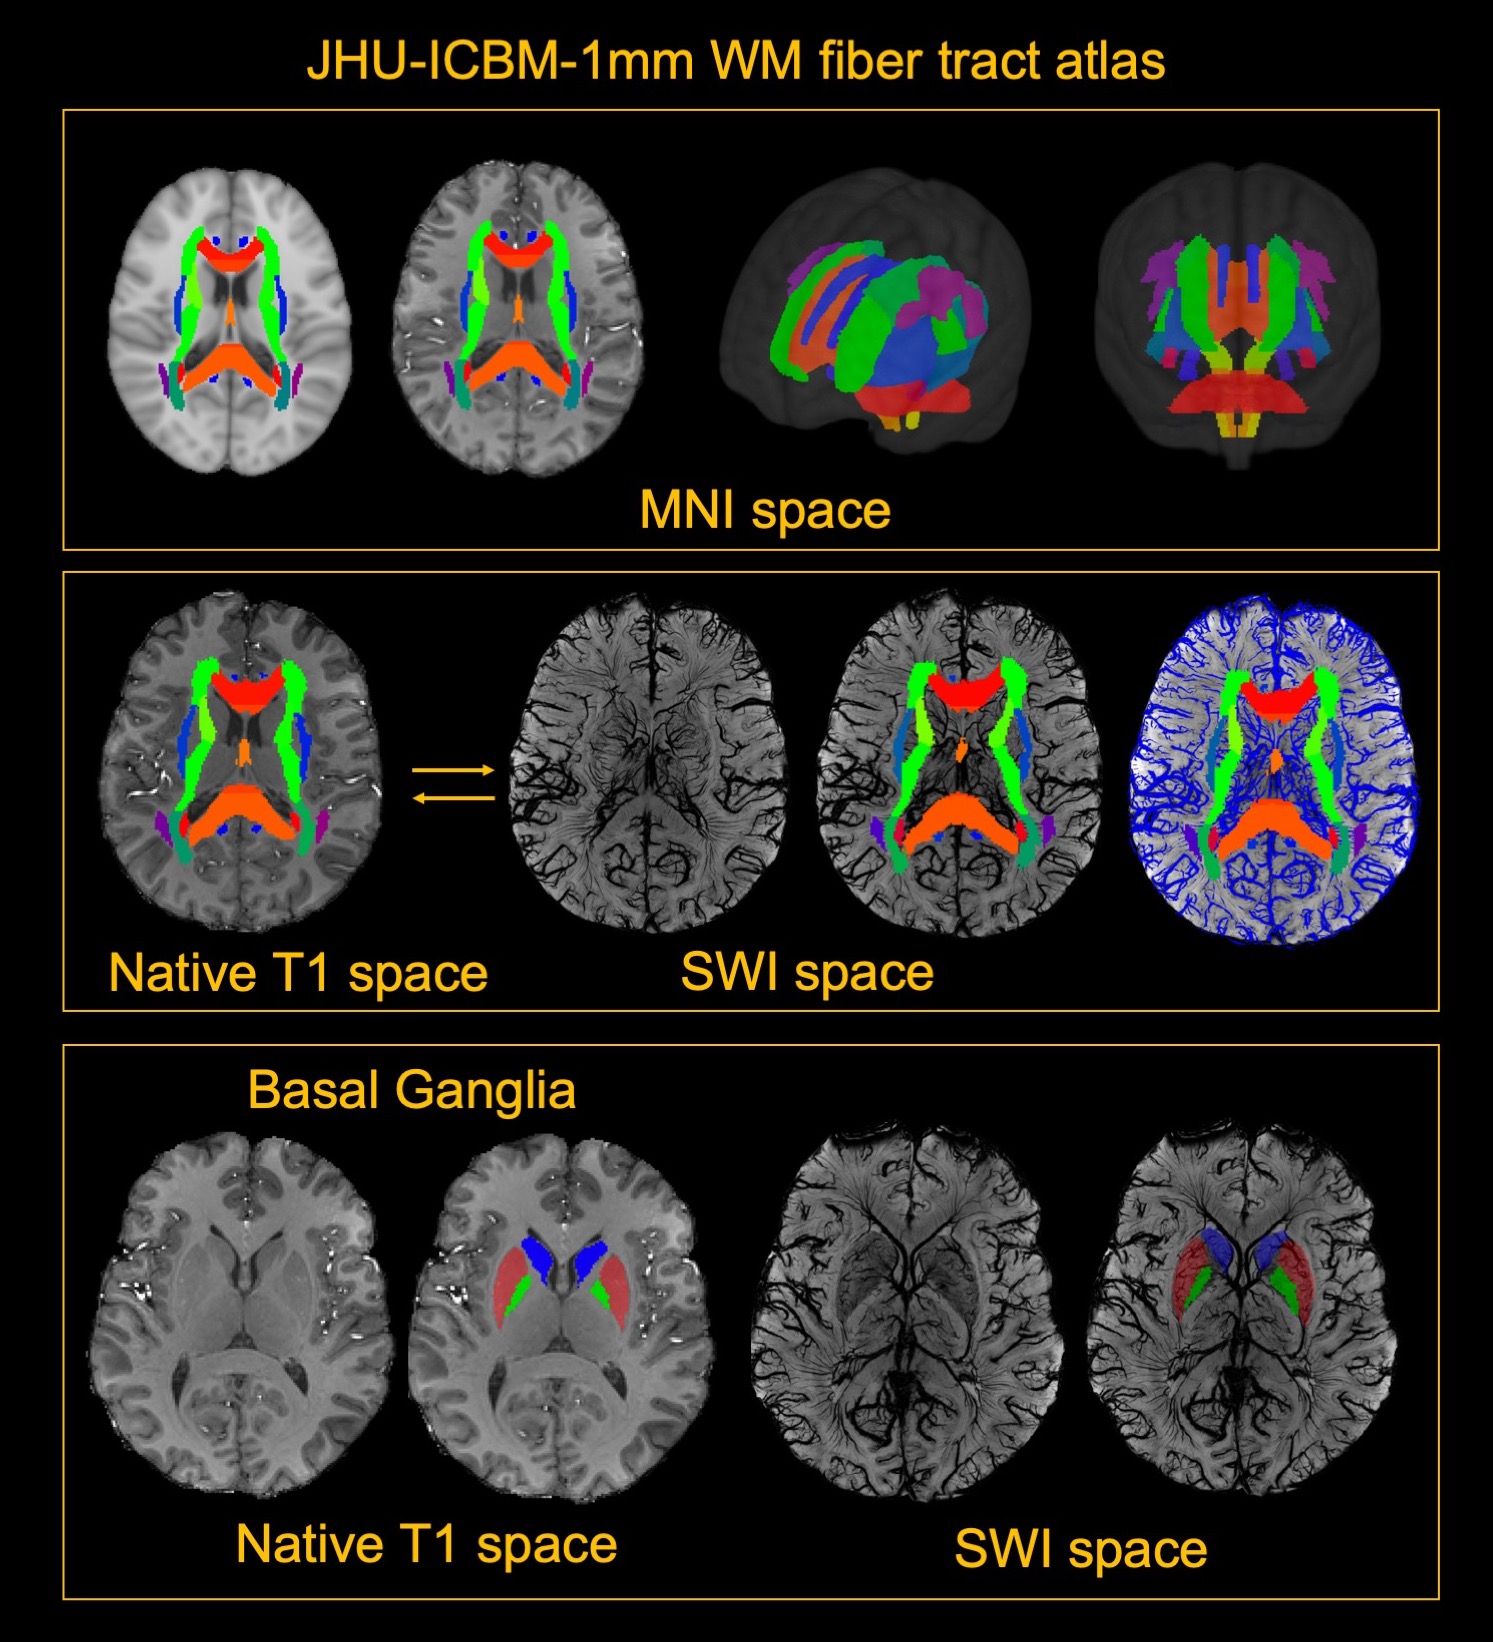
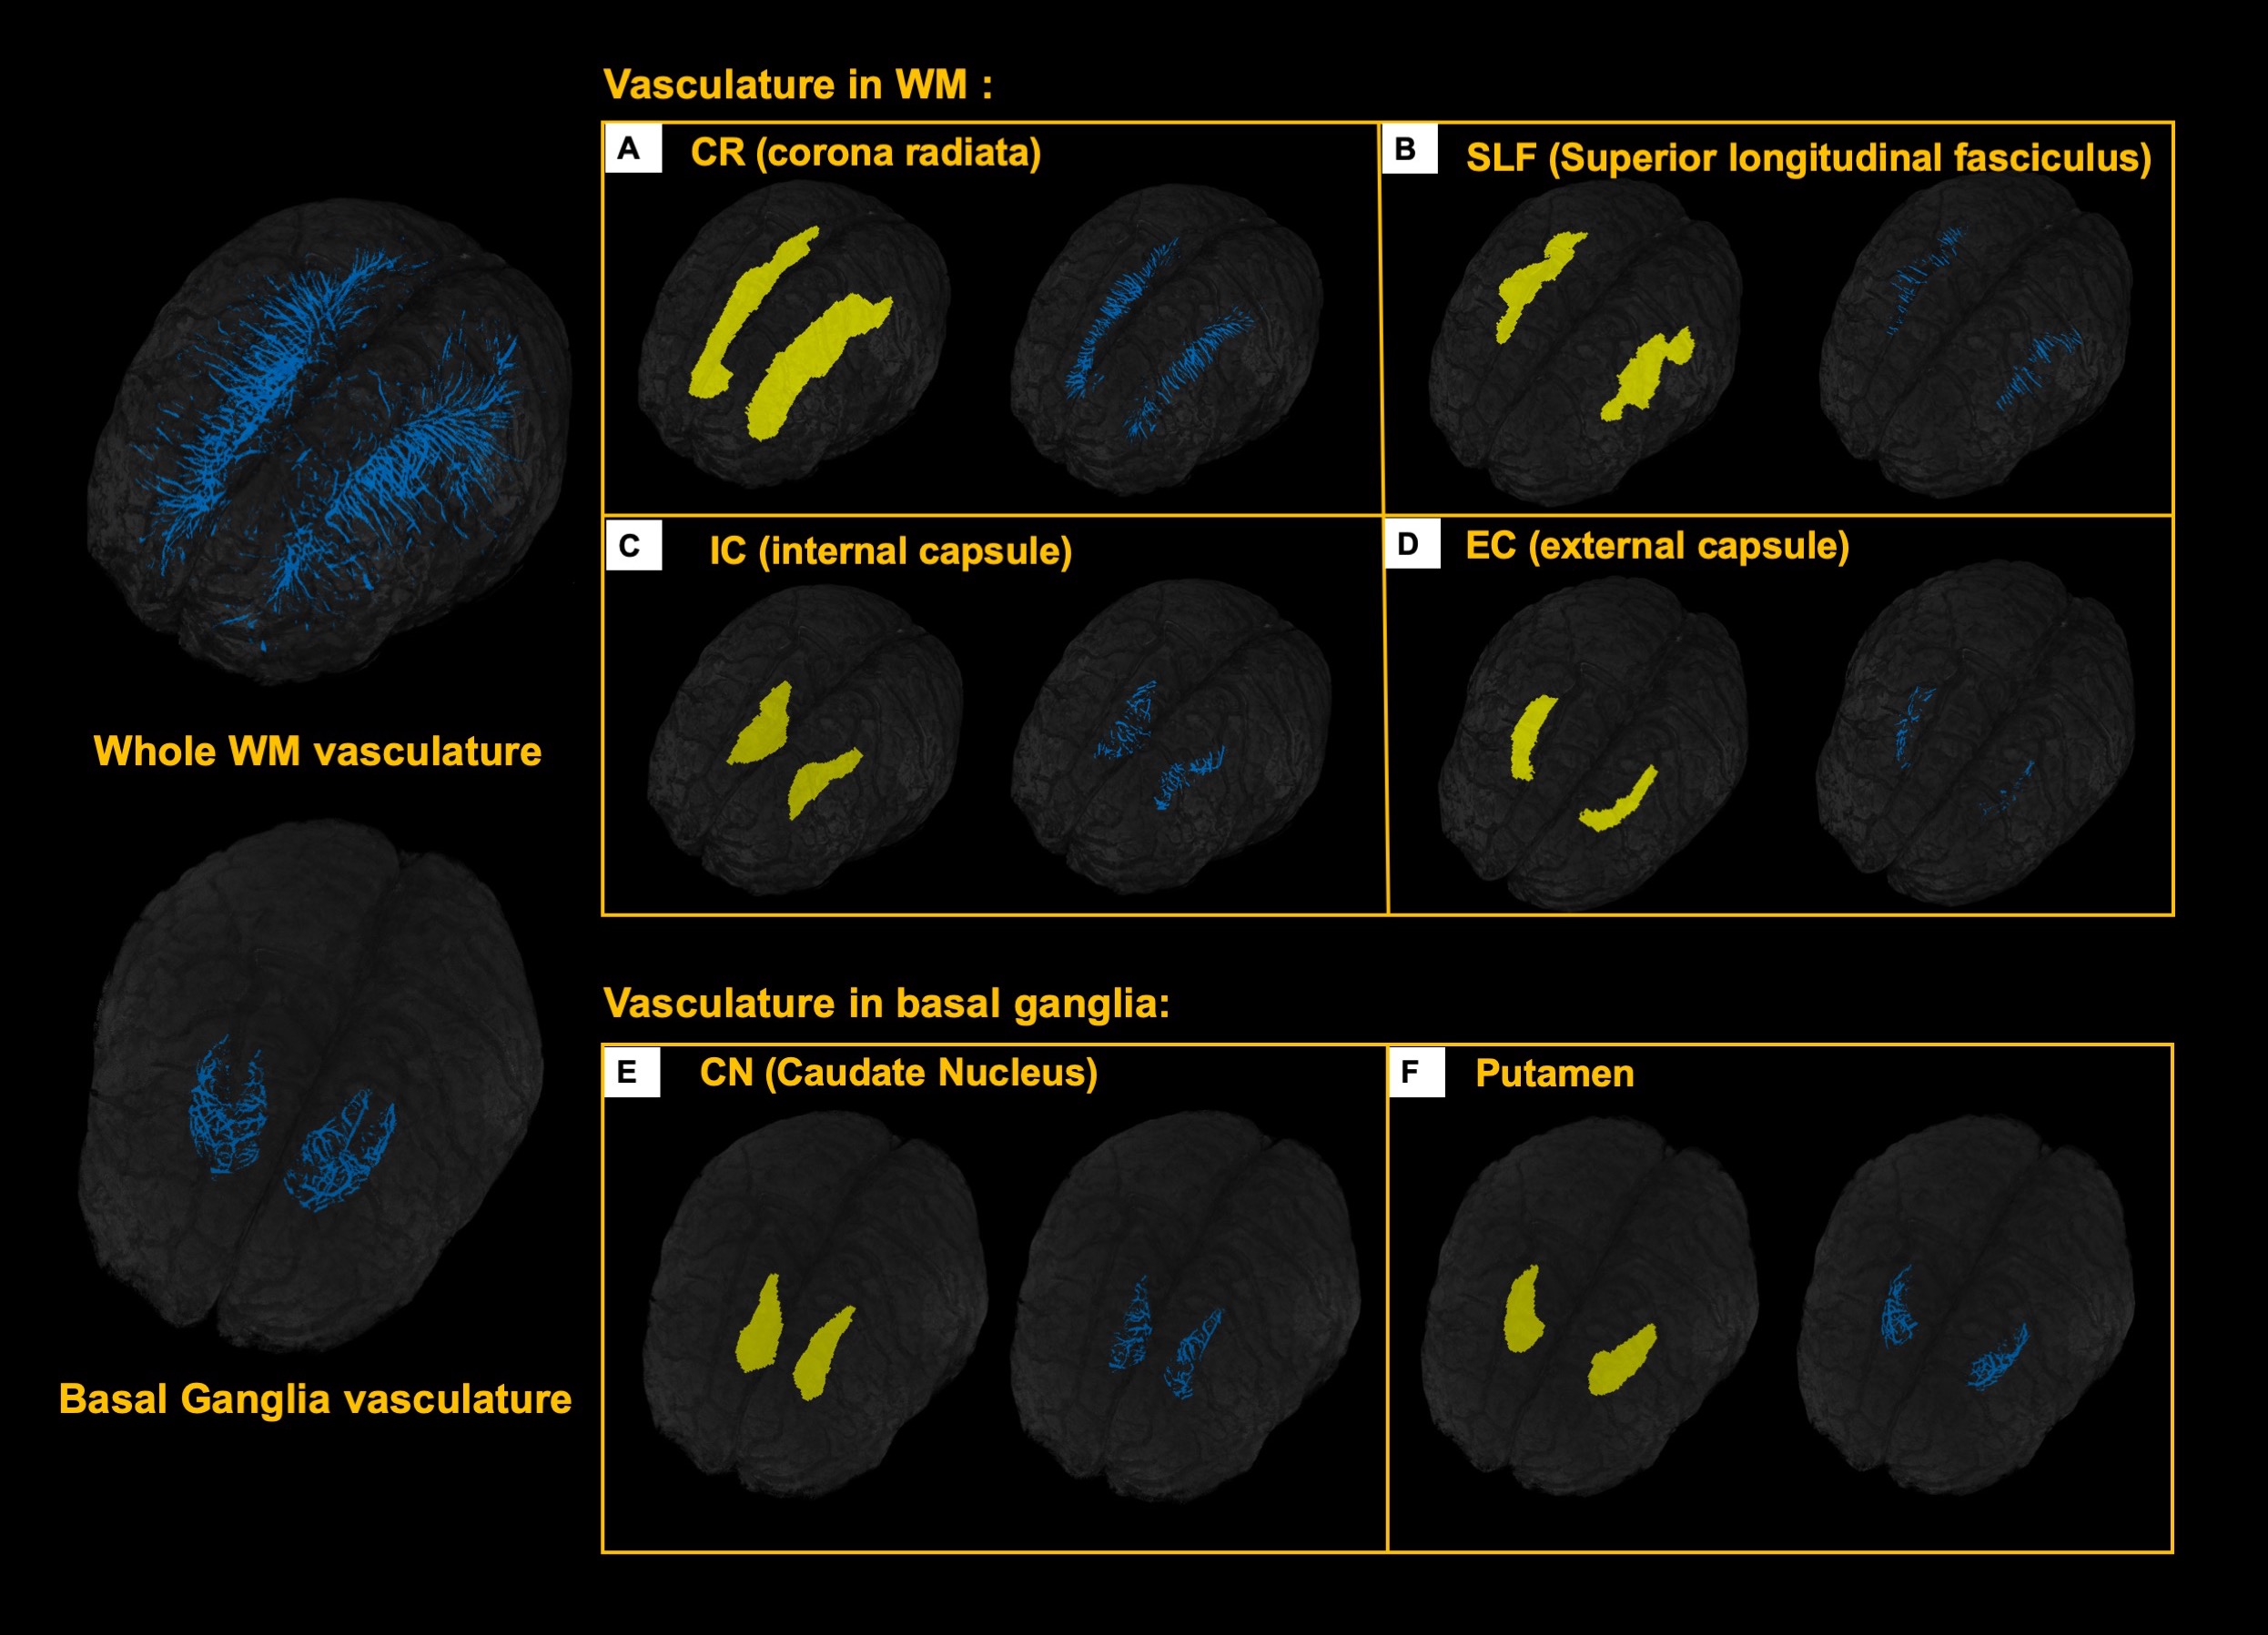
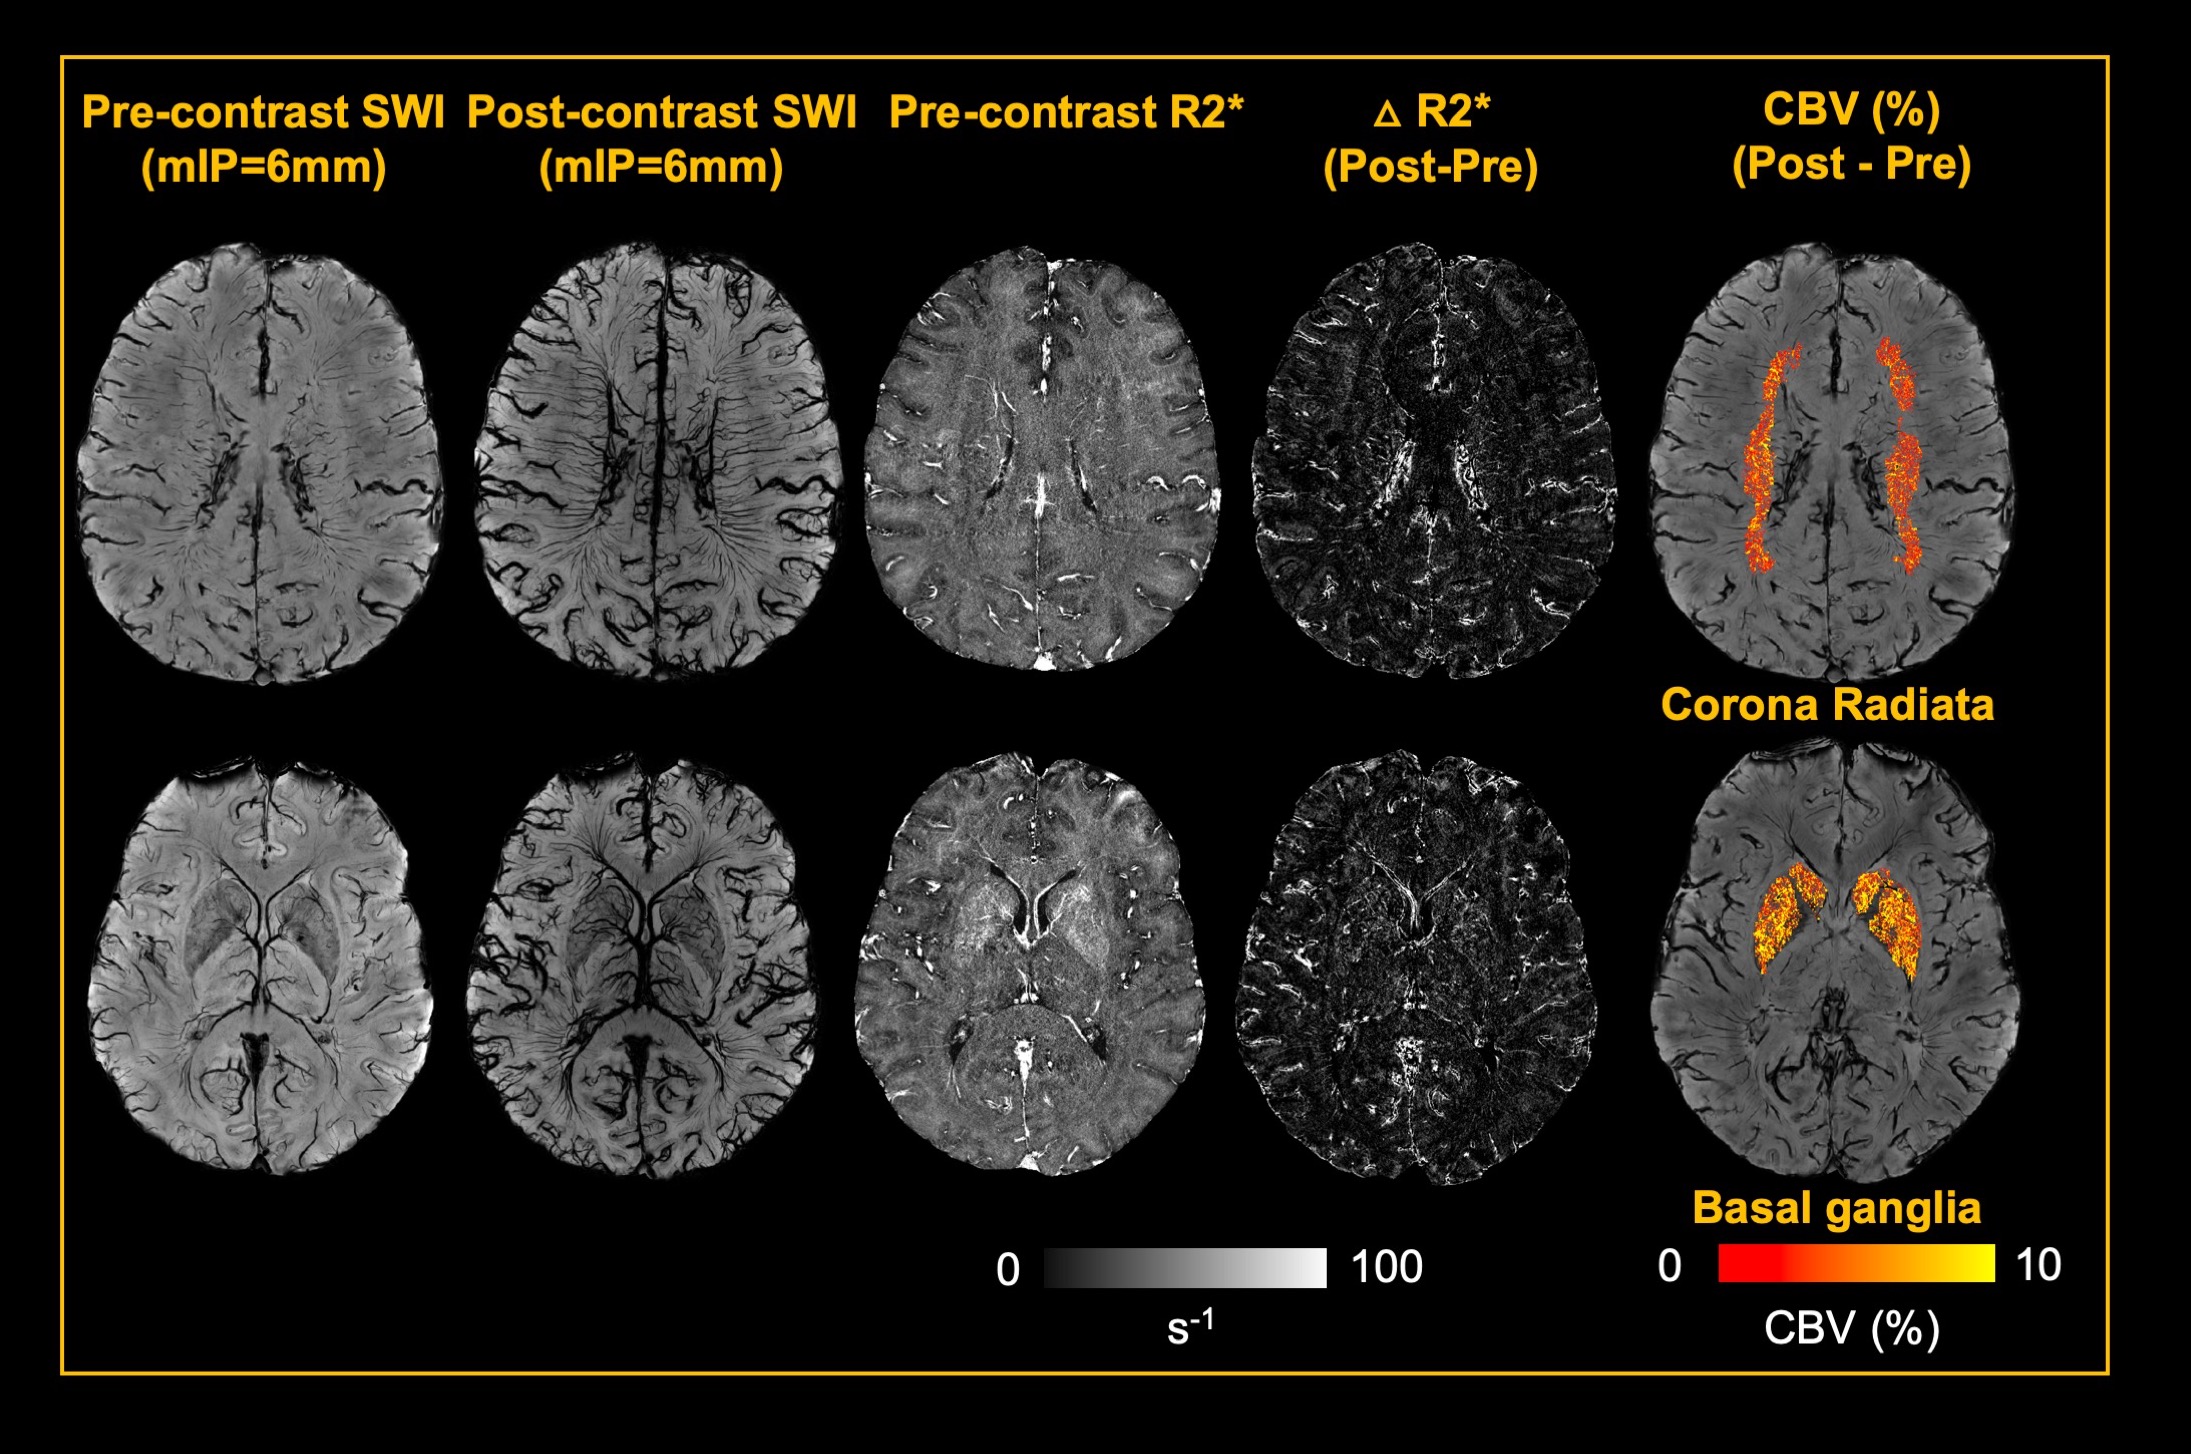
5 healthy volunteers (Age: 33.2±11.9 years, M/F=4/1) were participated in this study. Pre- and Post- dual-echo gradient echo SWI images were acquired with infusion of 3mg/kg Ferumoxytol (TE1/TE2/TR=7.5/15/22 ms, matrix size: 176×216×256, voxel size: 0.25×0.25×1mm3). MPRAGE images were acquired using the following parameters (TE/TR=3.24/2300ms, matrix size: 176×216×256, voxel size: 1mm isotropic). For post-processing, The T1 images were segmented using a multi-atlas based segmentation and non-linearly co-registered to MNI space7. Moreover, the T1 images were also registered to magnitude image of SWI, where the WM fibers from MNI space can be back-projected to SWI space (Fig. 1). The cerebral vasculature was segmented using a multiple scale Frangi filter and vessel enhancing diffusion filter8. The vasculature from each WM fiber tracts and BG were then extracted (Fig. 2). The pre- and post- R2* map was fitted using the signal attenuation of two TEs (7.5ms/15ms) data. The CBV percentage from each structure was calculated based on the tissue ΔR2* and concentration of the Ferumoyxtol in the total blood estimated using Nadler’s equation2,9.Results
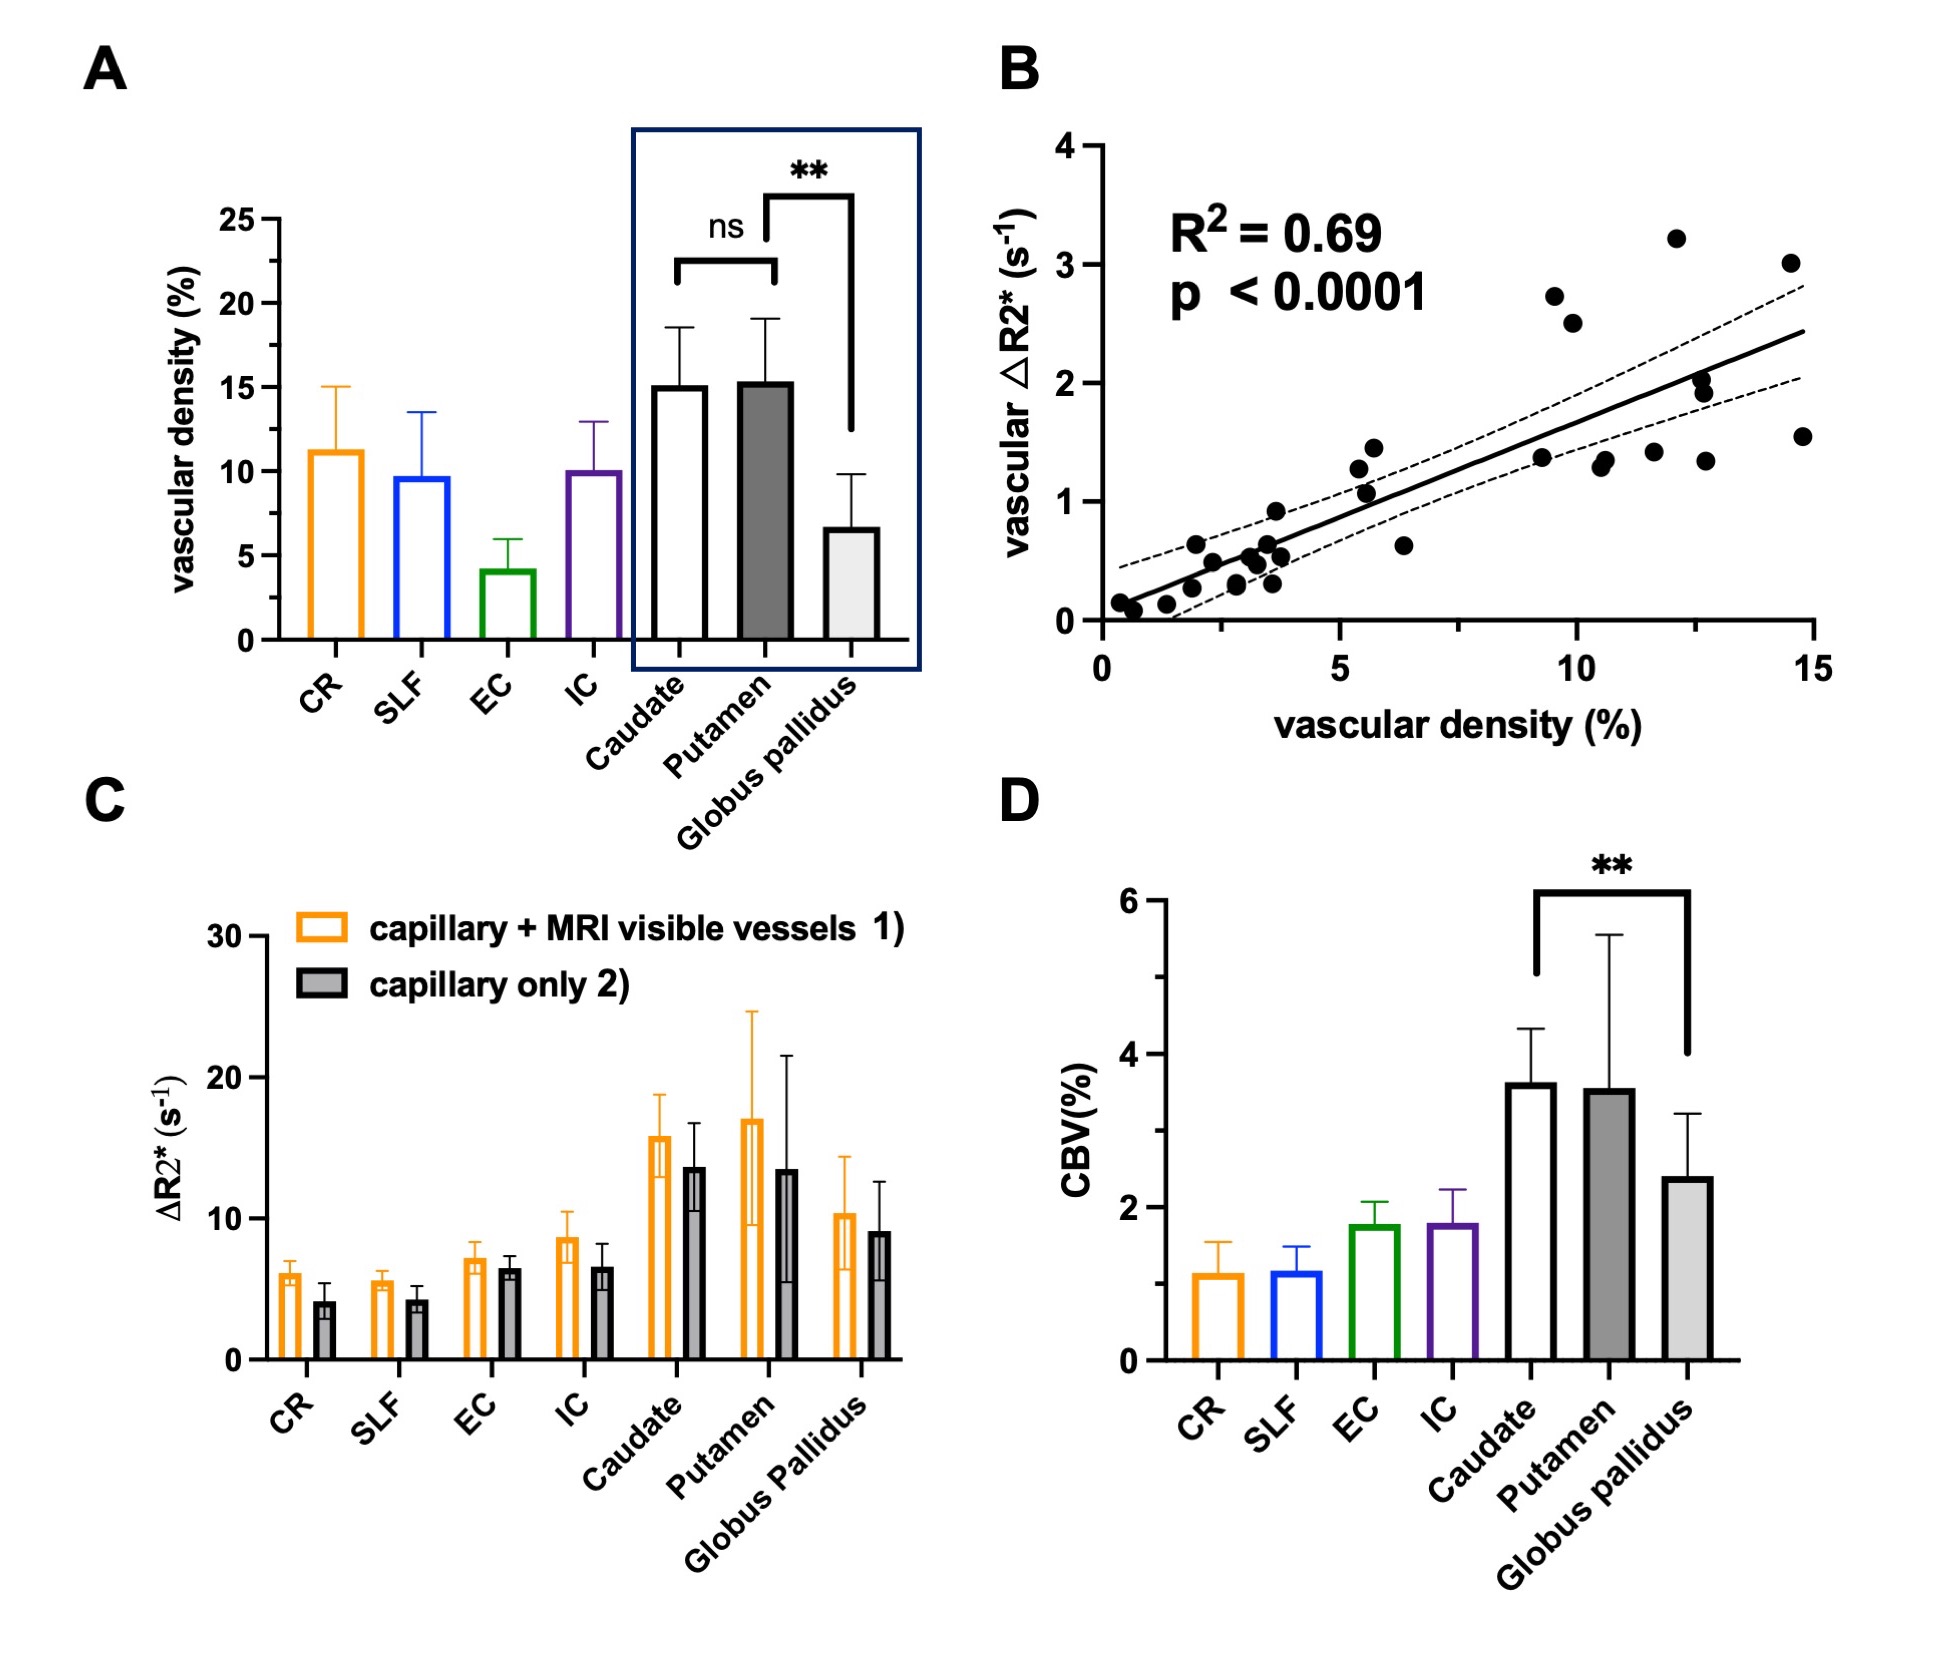
Our results showed that, in white matter, the vascular density varied across different fiber structures, while in basal ganglia, putamen and caudate nucleus showed higher vascular density compared to white matter and the globus pallidus showed lowest vascular density. In addition, The ΔR2* value in white matter and BG is in consistency with previous studies5,10. Interestingly, Fig. 4B revealed a strong correlation between vascular density and apparent ΔR2* contributed from vascular components, implying the effects of microvascular contribution to the overestimation of ΔR2* in tissue. Fig 4. C showed that ΔR2* value with 1) capillary (tissue) and all MRI visible vessels and 2) capillary (tissue) only. In addition, Higher tissue ΔR2* value is observed in the BG regions, which shows higher CBV (%) in BG compared to WM (Fig 4.D).Discussion and conclusions
In this study, we mapped out the detailed vasculature in WM tracts and BG using Ferumoxytol-enhanced MRI at ultrahigh field to estimate capillary CBV in WM and BG without vessel contamination. In white matter, the vascular density varied among different tracts. Although in some white matter tracts (e.g. corona radiata) showing higher vascular density, the CBV in corona radiata was lower. It is worth mentioning that corona radiata is within the periventricular region, where the ischemic lesion such as white matter hyperintensities are frequently occurred. This finding may explain that the periventricular WM region is more vulnerable to the reduced blood supply. On the other hand, in basal ganglia, higher vascular density and CBV were founded compared to white matter structures. Notably, the lowest vascular density and CBV has been observed in globus pallidus, which may be related to high iron content and potentially linked to age-related iron deposition in elderly. In summary, dual-echo Ferumoxytol-enhanced MRI offers a new tool for improved quantification of regional vascular reserve by removing small vessels in the region. The findings from this study may also be useful to characterize the vulnerability of different tissue structures to ischemic insult, which lay foundation for studies on age-related vascular degeneration in neurodegenerative diseases such as Alzheimer’s Disease (AD) and dementia.Acknowledgements
We acknowledge the funding sources for this study: RF1 NS110041, R01 NS 108491, and R13 AG067684 from National Institutes of Health (NIH).References
1. Ostergaard L. Principles of cerebral perfusion imaging by bolus tracking. J Magn Reson Imaging 2005;22(6):710-717.
2. Rivera-Rivera LA, Schubert T, Knobloch G, et al. Comparison of ferumoxytol-based cerebral blood volume estimates using quantitative R1 and R2* relaxometry. Magn Reson Med 2018;79(6):3072-3081.
3. Rivera-Rivera LA, Schubert T, Johnson KM. Measurements of cerebral blood volume using quantitative susceptibility mapping, R2 * relaxometry, and ferumoxytol-enhanced MRI. NMR Biomed 2019;32(12):e4175.
4. Varallyay CG, Nesbit E, Horvath A, et al. Cerebral blood volume mapping with ferumoxytol in dynamic susceptibility contrast perfusion MRI: Comparison to standard of care. J Magn Reson Imaging 2018;48(2):441-448.
5. Christen T, Ni W, Qiu D, et al. High-resolution cerebral blood volume imaging in humans using the blood pool contrast agent ferumoxytol. Magn Reson Med 2013;70(3):705-710.
6. Tropres I, Grimault S, Vaeth A, et al. Vessel size imaging. Magn Reson Med 2001;45(3):397-408.
7. Wu D, Ma T, Ceritoglu C, et al. Resource atlases for multi-atlas brain segmentations with multiple ontology levels based on T1-weighted MRI. Neuroimage 2016;125:120-130.
8. Bernier M, Cunnane SC, Whittingstall K. The morphology of the human cerebrovascular system. Hum Brain Mapp 2018;39(12):4962-4975.
9. Nadler SB, Hidalgo JH, Bloch T. Prediction of blood volume in normal human adults. Surgery 1962;51(2):224-232.
10. Rivera-Rivera LA, Johnson KM, Turski PA, Wieben O, Schubert T. Measurement of microvascular cerebral blood volume changes over the cardiac cycle with ferumoxytol-enhanced T2 (*) MRI. Magn Reson Med 2019;81(6):3588-3598.
Figures