0884
Quantitative evaluation of mannitol induced effects on ischemic rat brains using free water elimination and mapping with explicit T2 attenuation
Chia-Wen Chiang1, Ezequiel Farrher2, Kuan-Hung Cho1, Sheng-Min Huang1, N. Jon Shah2,3,4,5,6, Chang-Hoon Choi2, and Li-Wei Kuo1,7
1Institute of Biomedical Engineering and Nanomedicine, National Health Research Institutes, Miaoli, Taiwan, 2Institute of Neuroscience and Medicine – 4, Medical Imaging Physics, Forschungszentrum Jülich, Jülich, Germany, 3Department of Neurology, Faculty of Medicine, RWTH Aachen University, Aachen, Germany, 4JARA – BRAIN – Translational Medicine, RWTH Aachen University, Aachen, Germany, 5Institute of Neuroscience and Medicine – 11, Forschungszentrum Jülich, Jülich, Germany, 6Monash University, Melbourne, Australia, 7National Taiwan University College of Medicine, Taipei, Taiwan
1Institute of Biomedical Engineering and Nanomedicine, National Health Research Institutes, Miaoli, Taiwan, 2Institute of Neuroscience and Medicine – 4, Medical Imaging Physics, Forschungszentrum Jülich, Jülich, Germany, 3Department of Neurology, Faculty of Medicine, RWTH Aachen University, Aachen, Germany, 4JARA – BRAIN – Translational Medicine, RWTH Aachen University, Aachen, Germany, 5Institute of Neuroscience and Medicine – 11, Forschungszentrum Jülich, Jülich, Germany, 6Monash University, Melbourne, Australia, 7National Taiwan University College of Medicine, Taipei, Taiwan
Synopsis
Keywords: Stroke, Treatment
Cerebral edema occurs after stroke. Mannitol is commonly used dehydrating agent for effectively improving cerebral edema. However, the edema state after mannitol administration and its effectiveness at the post-acute stages remain unclear. Recently, we have demonstrated free-water elimination and mapping (FWET2) can be used to characterize vasogenic edema in stroke animal models. The aim of this study was to quantitatively evaluate mannitol-induced effects on ischemic rat brains at different time points by using FWET2. We attempted to examine if free water fraction change could reflect mannitol-induced effects on infraction and correlate free water fraction change with total infarct volume.Introduction
Cerebral edema typically occurs after acute stroke, which is defined as an excess fluid accumulation within brain parenchyma.1,2 Mmannitol, hyperosmolar agents, is commonly used as treatment to reduce brain edema.3,4 However, the edema state after mannitol administration and its effectiveness administrated in the post-acute period remain unclear. Recently, we have demonstrated FWET2-provided free water fraction (fw) associates with the pathological changes linked to vasogenic edema evolution in ischemic rat brain.5 Therefore, this aim of the study was to evaluate the mannitol-induced effects on brain infarction at acute and post-acute stages of stroke rats using FWET2. We attempted to examine if free water fraction change (Δfw) could reflect mannitol-induced effects on ischemic infraction and correlate the free water fraction change with total infarct volume.Methods
Twelve adult SD rats (300-450 g) underwent 90 minutes of right MCA occlusion.6 Rat was injected with a single dose of 20 % mannitol solution8 through intravenous injection. For each experiment, two MRI scans were performed, before and 20 minutes after mannitol (MTL) injection. MRI were performed on day 1 (n=5), day 5 (n=6), and day 26 (n=6) after stroke on an in-house 3T MRI system.7 An ultra-high-strength gradient coil with a maximum strength of 675 mT/m (Resonance Research Inc., MA, USA) and a custom transmit/receive surface coil were utilized. Diffusion-weighted images were acquired using a Stejskal-Tanner EPI pulse sequence implemented with the b-value (ms/μm2)/number of diffusion directions: 0/8, 0.5/12, 1.0/26, and 2.0/40 (b = 2.0 ms/μm2 was not used in this work). The acquisition parameters were TR=9 s; TE=50, 100 ms; Δ=24 ms; δ= 3 ms; one repetition. Addition eight b=0 images (eight repetitions) with TE=70, 90, 110, 130 ms were collected. Other parameters were: FOV = 25× 25 mm2; matrix-size = 96 ×96; voxel-size = 0.26 × 0.26 ×1 mm3; 20 image slices. T2-weighted images were also acquired. FWET2-DTI model analysis was performed as previously described.5 All datasets were first denoised, corrected for EPI, eddy-current distortions, and with linear and non-linear registrations by ANTs software.6 Maps of fraction anisotropy (FA), mean diffusivity (MD), T2 and fw were reconstructed. The difference map of free water fraction (Δfw) between after and before MTL was calculated. Regions-of-interest (ROIs) of whole cortical infarction were determined considering both FA, MD, and T2 maps before MTL. Total infarction volume was multiplication of total infarct area with slice thickness. Whole infarction fw and ∆fw histograms were analyzed. The free water fraction change (∆fw) were evaluated. Correlation analysis between ∆fw and total infarction volume was performed. Two-tailed paired t-test was performed for statistics.Results
Figure 1 shows representative fw maps before and after MTL, and ∆fw maps at different time points. On day 1, fw was increased particularly in core lesion followed by dehydrated after MTL. On day 5, fw was heterogeneously increased in lesion followed by a rapid rebound in cerebral edema after MTL. Finally, on day 26, fw was great in lesion followed by an minor increase with large variation after MTL. Figure 2 shows quantification assessments of fw_mean (mean value of fw histogram) before and after MTL, and ∆fw_mean (mean value of ∆fw histogram) at different time points. Before MTL, fw_mean shows significant differences from day 1 vs. 26 and day 5 vs. 26. After MTL, fw_mean shows significant differences between either two of three time points (all p<0.005, Fig. 2A). In addition, ∆fw_mean was calculated to examine the mannitol-induced effects on infarction. With time course, ∆fw_mean was -0.013±0.009, 0.014±0.012, and 0.010±0.035 for day 1, 5, and 26, respectively (Fig. 2B). ∆fw_mean shows significant difference from day 1 vs. 5 (p<0.005, Fig. 2B). Table 1 listed the comparison of other variables from ∆fw histograms at different time points. Note that standard deviation (SD) of ∆fw histograms (i.e., ∆fw_SD) was around twice larger on day 26, as compared with that on day 1 and 5. Figure 3 shows the association between ∆fw and total infarction volume. The Pearson correlation coefficients (r) were 0.23, -0.64, and 0.39 for day 1, 5, and 26, respectively.Discussion and Conclusions
We have demonstrated that FWET2 revealed spatialtemporal characterization of free water fraction in ischemic infarction before mannitol injection at different stages, consistent with our previously published paper.5 Evaluation of ∆fw_mean revealed that dehydration at acute and a rapid rebound of cerebral edema at subacute, while evaluation of ∆fw_SD revealed large variation at chronic. It is known that mannitol has action effect (dehydration) and adverse effect (rebound water due to mannitol accumulation). In addition, blood-brain barrier (BBB) pathology and its permeability was developed and varied throughout the different stages of ischemic stroke.9 Our results suggest the free water fraction change may reflect mannitol-induced effect on cortical infarction at different stages, which were associated with BBB disruption and its permeability. Interestingly, the mannitol-induced rehydration within ischemic lesion correlates with total infarct volume at subacute stage. It may relate to the development of tissue pathological heterogeneity of lesion. In summary, importantly, FWET2-provided free water fraction is reliable for evaluating and reflecting mannitol-induced effects on cerebral infarction in stroke rats. This work may promote the management and improvement of treatment strategies.Acknowledgements
No acknowledgement found.References
- Bansal S et al., Drug Treatment of Acute Ischemic Stroke. Am J Cardiovasc Drugs. 2013; 13(1): 10.1007/s40256-013-0007-6
- Jha SK, Cerebral Edema and its Management. MJAFI 2003; 54(4):326-331.
- Knapp JM, Hyperosmolar therapy in the treatment of severe head injury in children: mannitol and hypertonic saline. AACN Clin Issues. 2005; 16(2):199-211.
- Diringer MN et al., Osmotic therapy. Neurocritical Care. 2004; 1(2):219-233.
- Farrher E. et al., Spatiotemporal characterisation of ischaemic lesions in transient stroke animal models using diffusion free water elimination and mapping MRI with echo time dependence. Neuroimage. 2021 Dec 1;244:118605.
- Wu KJ et al., Transplantation of Human Placenta-Derived Multipotent Stem Cells Reduces Ischemic Brain Injury in Adult Rats. Cell Transplantation. 2015; 24(3): 459–470.
- Paczynski RP et al., Multiple-Dose Mannitol Reduces Brain Water Content in a Rat Model of Cortical Infarction. Stroke. 1997; 28(7):1437–1444.
- Cho KH et al., Development, integration and use of an ultrahigh-strength gradient system on a human size 3T magnet for small animal MRI. PLoS ONE. 2019; 14(6):e0217916.
- Bernardo-Castro S et al., Pathophysiology of Blood-Brain Barrier Permeability Throughout the Different Stages of Ischemic Stroke and Its Implication on Hemorrhagic Transformation and Recovery. Front Neurol. 2020 Dec 9;11:594672.
Figures
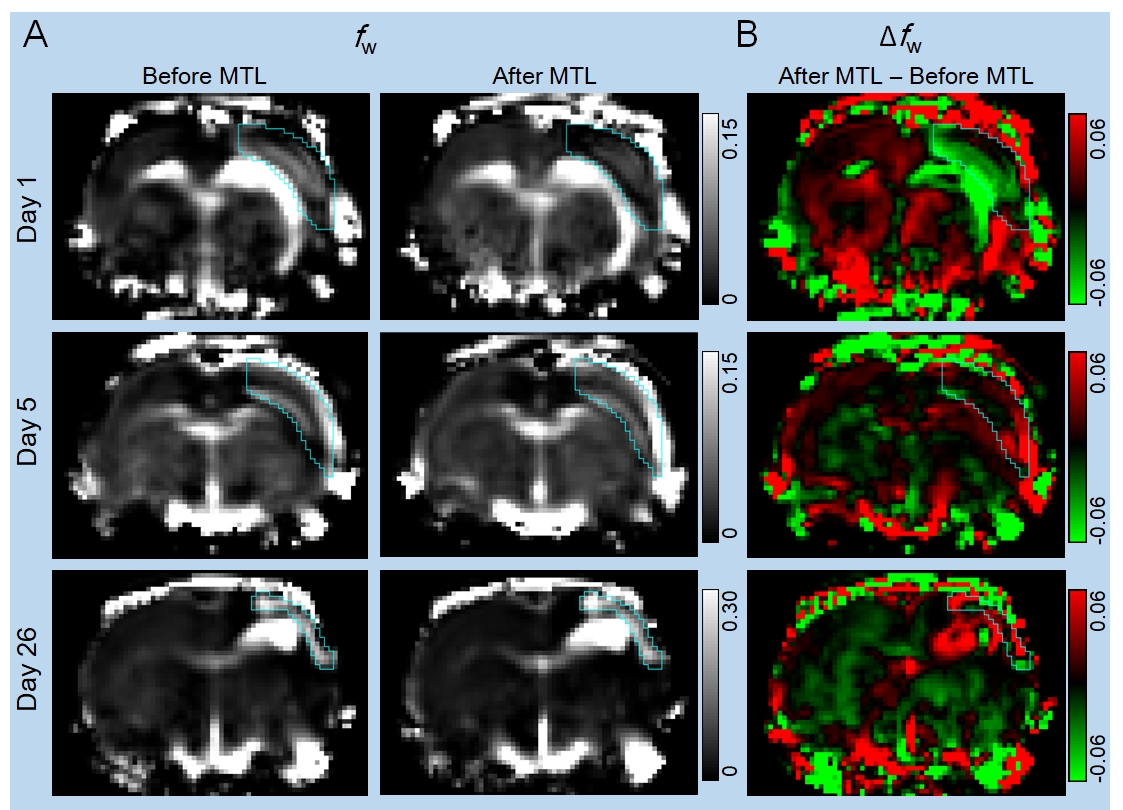
Figure 1. (A) Free water fraction (fw) maps from one slice of stoke
rat brains on day 1, 5, and 26 before and 20 minutes after mannitol (MTL) injection
showing the spatialtemporal characterization of fw in cortical
lesions (ROIs overlaid). (B) The difference maps of free water fraction (i.e., free
water fraction change, Δfw) between after and before MTL showing
mannitol-induced lesion dehydration at acute, but a rebound of free water at subacute
and chronic stages.
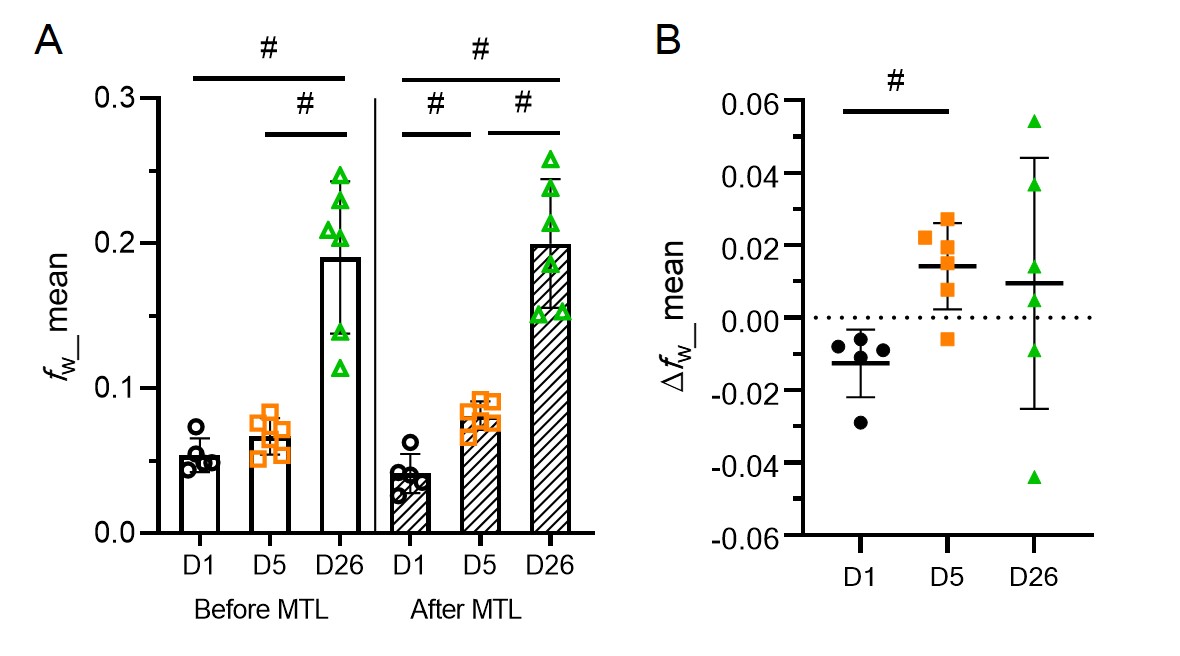
Figure 2. Quantitative assessments of free water fraction (fw) and
free water fraction change (Δfw) within whole infarction. (A) fw altered after mannitol (MTL) injection at different time points. Notably,
there was a significant difference from day 1 vs 5 after MTL. (B) With time
course, Δfw was negative at acute, and then positive at subacute,
and finally positive with large variation at chronic. Together, Δfw reflects mannitol-induced effects on cortical infarctions at the
different stages. D, day; #, p<0.005; Mean±SD.
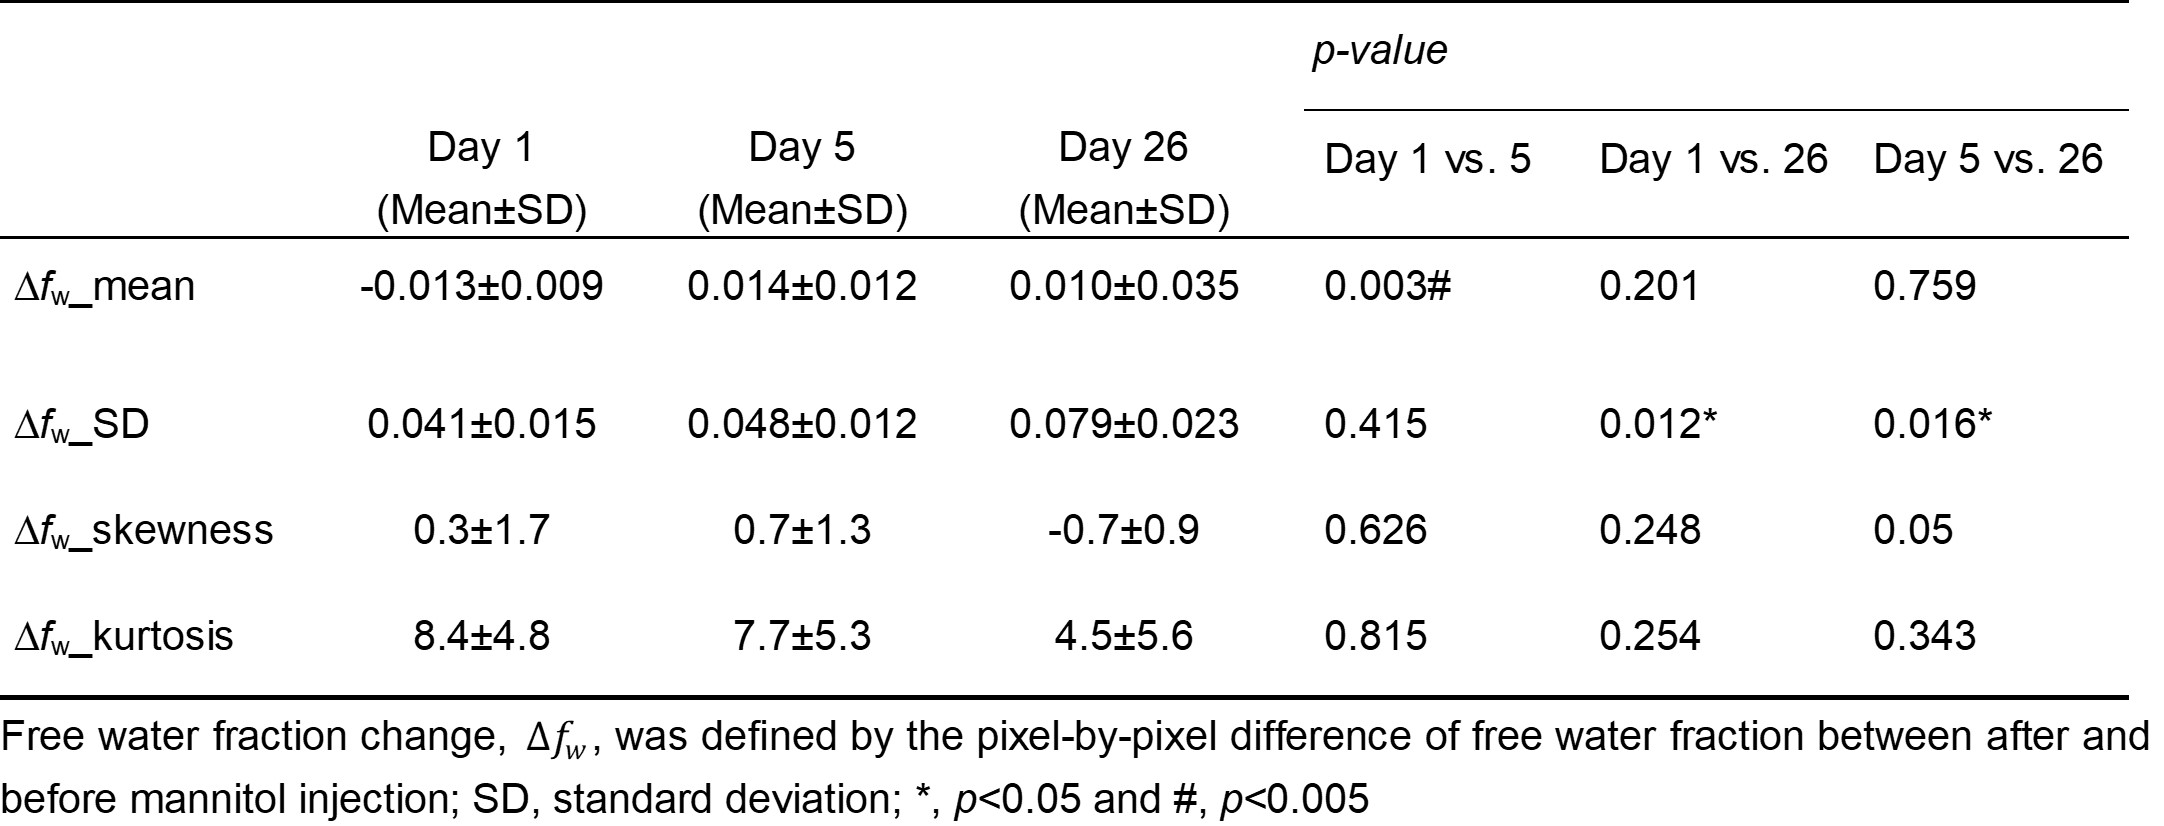
Table
1. Comparisons of variables from histograms of free water fraction change (Δfw) at different time points
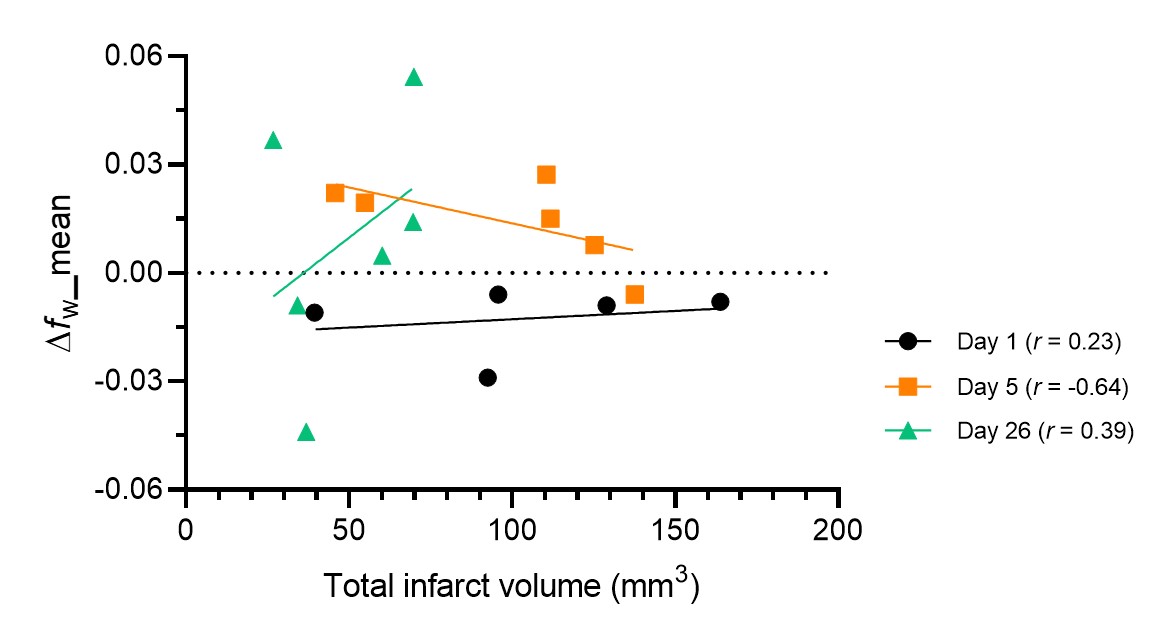
Figure 3. Scatter plot of free
water fraction change (Δfw) vs. total infarction volume. Stroke rats show that Δfw negatively
correlates with total infarct volume (r = -0.65) on day 5, relating to the development of tissue pathological heterogeneity
DOI: https://doi.org/10.58530/2023/0884