0883
Microvascular response of an oxygen carrier in the penumbral tissue of fast and slow progressors in a canine large vessel occlusion model1University of Massachusetts Chan Medical School, Worcester, MA, United States, 2Omniox, Inc., Palo Alto, CA, United States, 3Oryn Therapeutics, Redwood City, CA, United States
Synopsis
Keywords: Stroke, Diffusion/other diffusion imaging techniques
In acute ischemic stroke due to large vessel occlusion (LVO), information about the penumbral tissue can be vital in making decisions on how to treat ischemic stroke patients in the clinic. This study investigated the use of intravoxel incoherent motion (IVIM) MRI in a canine LVO model to quantify the perfusion information in penumbral tissue of fast and slow progressors that received an oxygen carrier drug. The IVIM parameters were assessed to predict the onset of penumbral tissue death. The IVIM parameters showed a better utility in predicting penumbral tissue death in fast progressors compared to slow progressors.Introduction
In acute ischemic stroke, the penumbra constitutes of viable tissue that can be rescued and surrounds the area of the ischemic region. Depending on progression of the stroke, information about the penumbra can be vital in making decisions on how to treat ischemic stroke patients in the clinic. A major factor determining the speed by which the penumbra is converted into the infarct core is the existence and recruitment of collateral vessels1. A recent study demonstrated that the robustness of collaterals modified the efficacy of a novel oxygen carrier drug in delaying the ischemic lesion evolution in a canine stroke model2. In this study, we sought to employ intravoxel incoherent motion (IVIM)3 MRI to quantify microvascular perfusion to define tissue at risk for irreversible injury in the canine stroke model. Specifically, we quantified the perfusion information in the penumbral tissue of fast progressors (FP; poor collaterals) versus slow progressors (SP; good collaterals) to understand the microvascular physiology and its effect on the macroscopic infarct expansion. This information could be used to determine whether the IVIM parameters can predict the onset of penumbral tissue death and identify subjects likely to benefit from pharmaceutical or mechanical interventions aimed at improving tissue perfusion and neuronal survival.Methods
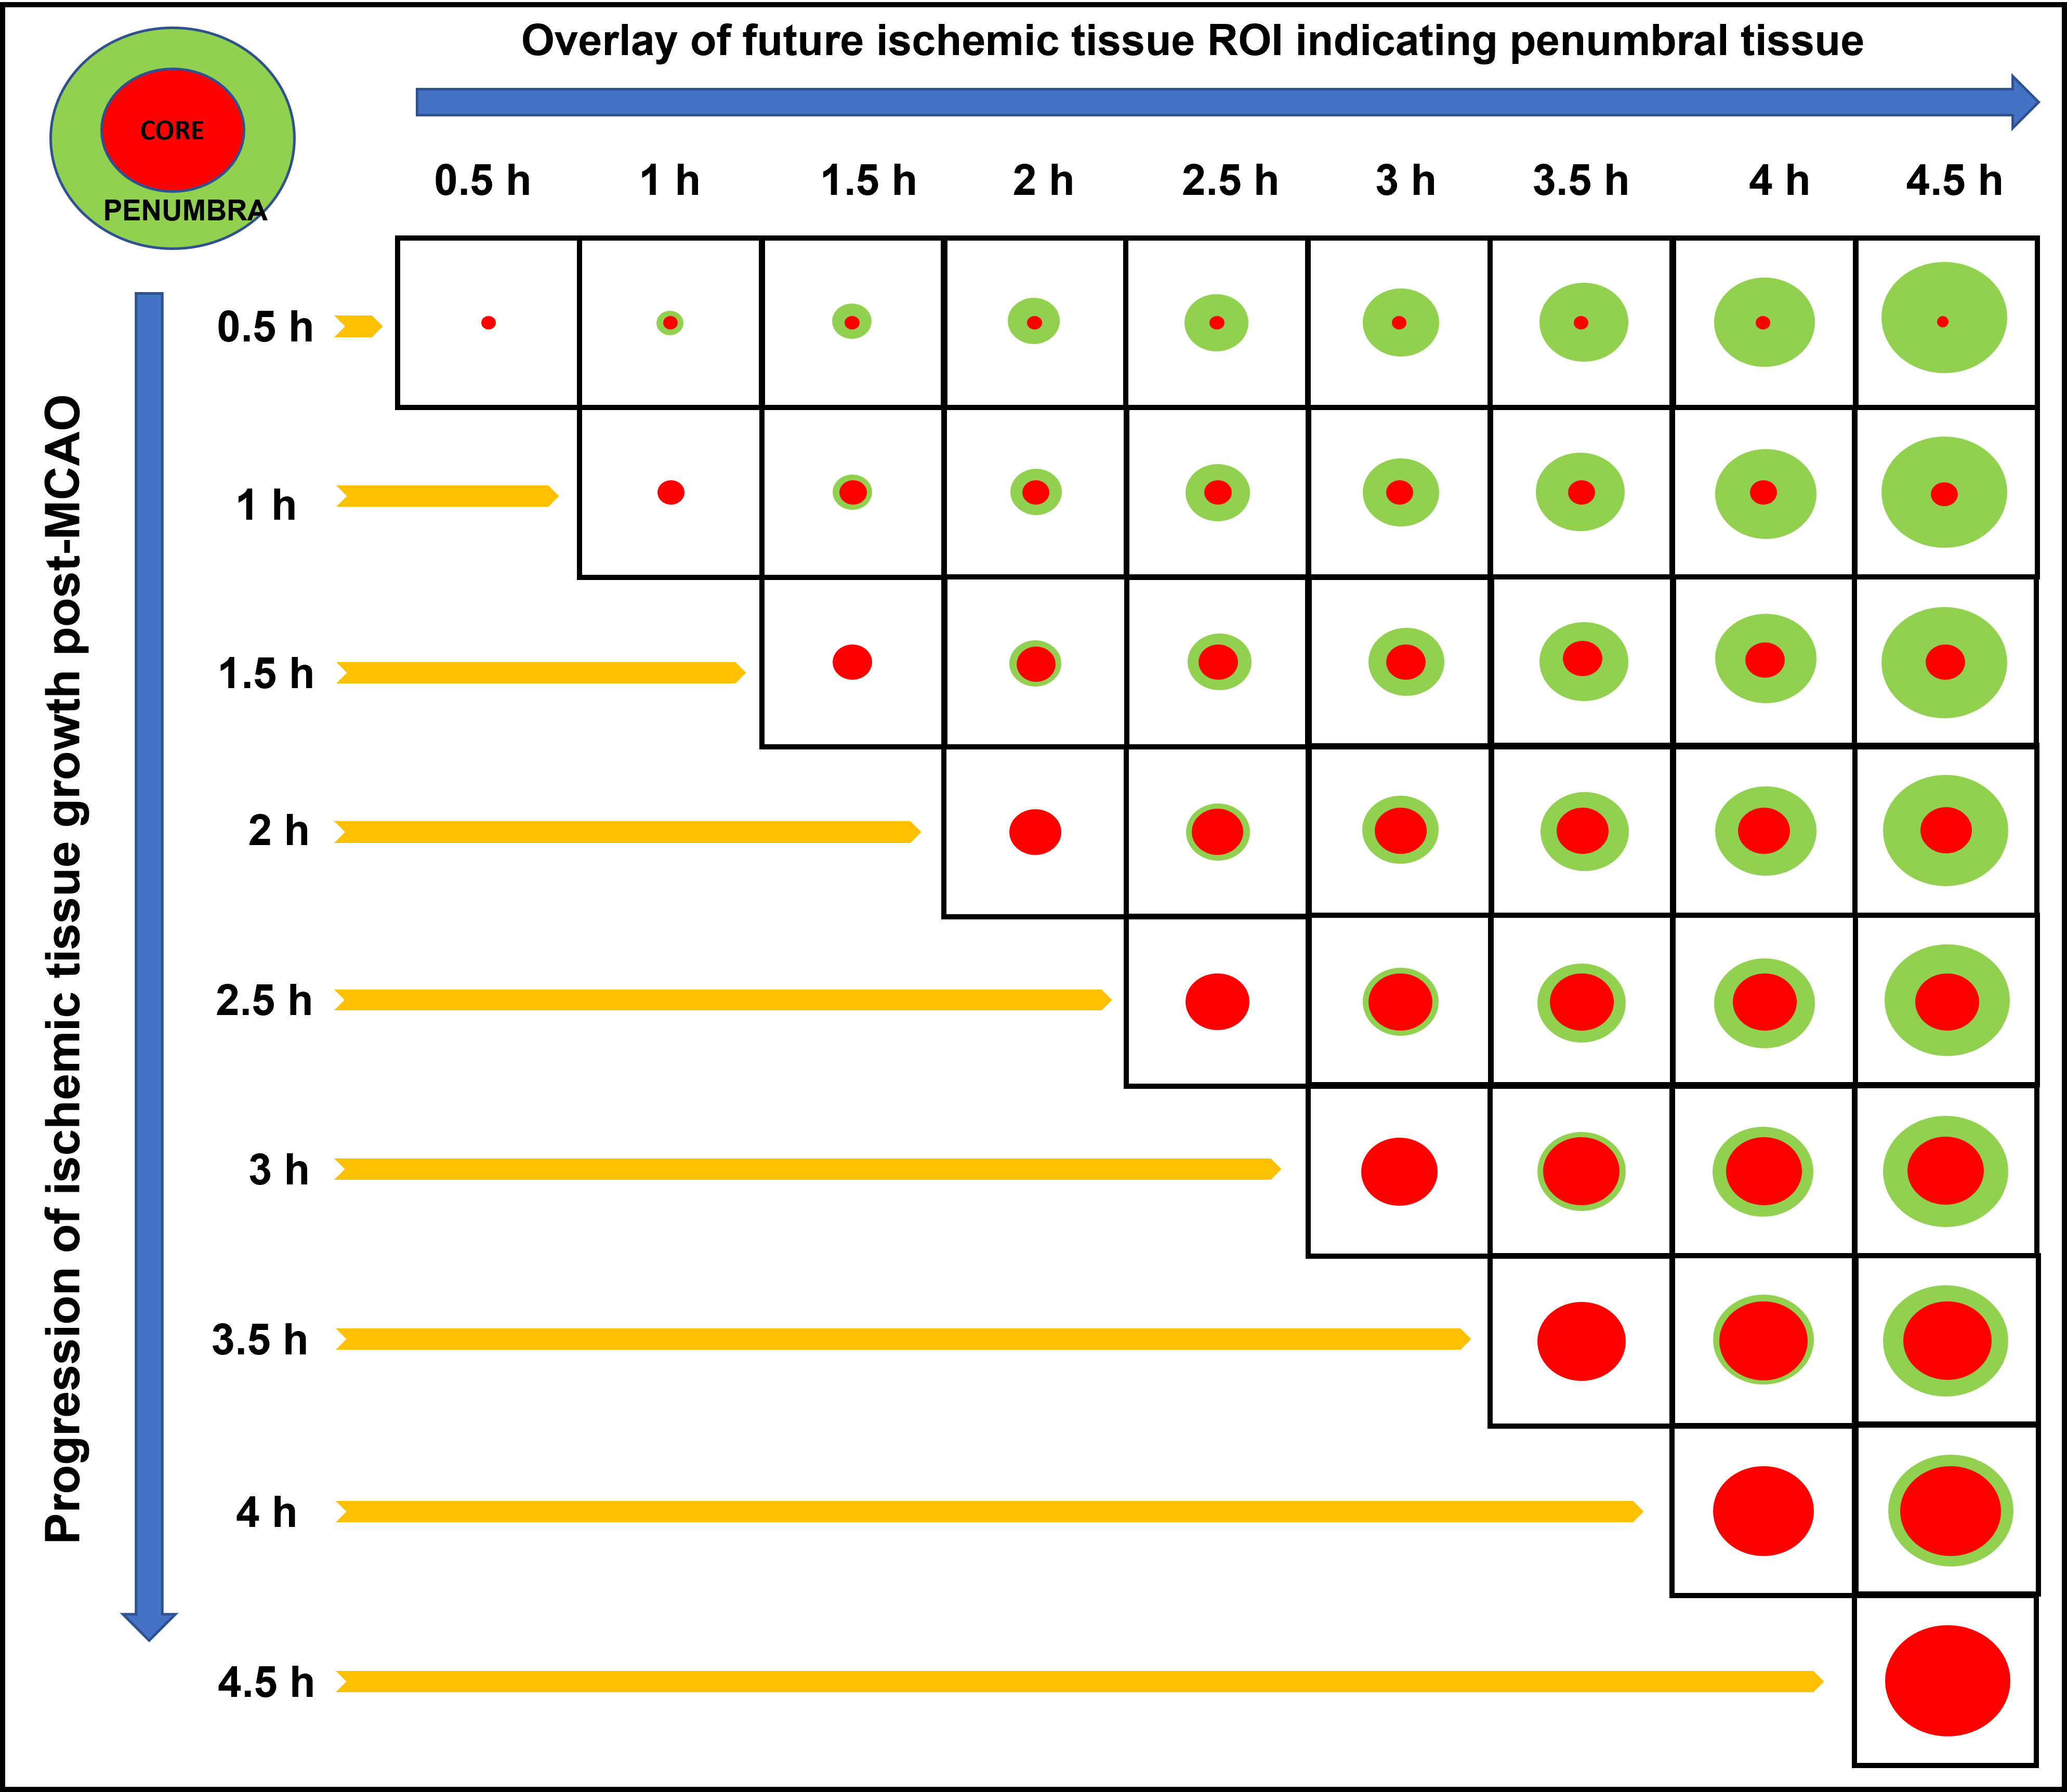
An autologous clot was injected into the middle cerebral artery (MCA) of 12 dogs to cause an occlusion and subsequent infarction as previously described4,5. After confirming the MCA occlusion (MCAO) using angiography, each dog was imaged using MRI. Imaging protocol included perfusion-weighted MRI (PW-MRI, TR/TE=1500/20.1ms, FA=40o, 60 dynamics, matrix=144x201), which was performed using Magnevist (0.2 mmol/kg) at ~30 min post-MCAO, and diffusion-weighted MRI (DW-MRI, TR/TE=3200/76ms, FA=90o, b-values = 0, 50, 100, 150, 200, 250, 300, 500, 700, and 900 s/mm2, NEX=4, matrix=128x128), which was performed after PW-MRI and every 30 min up to 5 h post-MCAO. Each dog received an oxygen carrier drug, which involved an intravenous bolus at ~45 min post-MCAO followed by slow infusion for ~2 h. Histology was performed post-mortem using triphenyltetrazolium chloride (TTC) to confirm the brain infarct region. IVIM analysis was performed in a two-step fitting approach6 using: S(b)/S0=(1-f)*exp[-bD]+f*exp[-b(D*+D)], where S(b) is the signal intensity at the respective b value, S0 is the signal at b = 0, f is the perfusion fraction, D is the molecular diffusion coefficient, and D* is the pseudo-diffusion coefficient related to microvascular perfusion. Infarct regions of interest (ROI) were based on apparent diffusion coefficient (ADC) maps where ADC values < 0.533 × 10⁻³ mm2/s was considered infarcted tissue. The ROIs from later timepoints were superimposed on earlier timepoints to delineate the penumbra region (Fig. 1). The time it took for the ADC values of the penumbra to reduce to 0.533 × 10⁻³ mm2/s was considered to be the time prior to penumbral death. Normal tissue was assessed by selecting contralateral ROIs in the unaffected hemisphere. Analysis of variance (ANOVA) for mixed models was used to determine if there was a significant change in the IVIM parameters between FP/SP and across timepoints.Results and Discussion
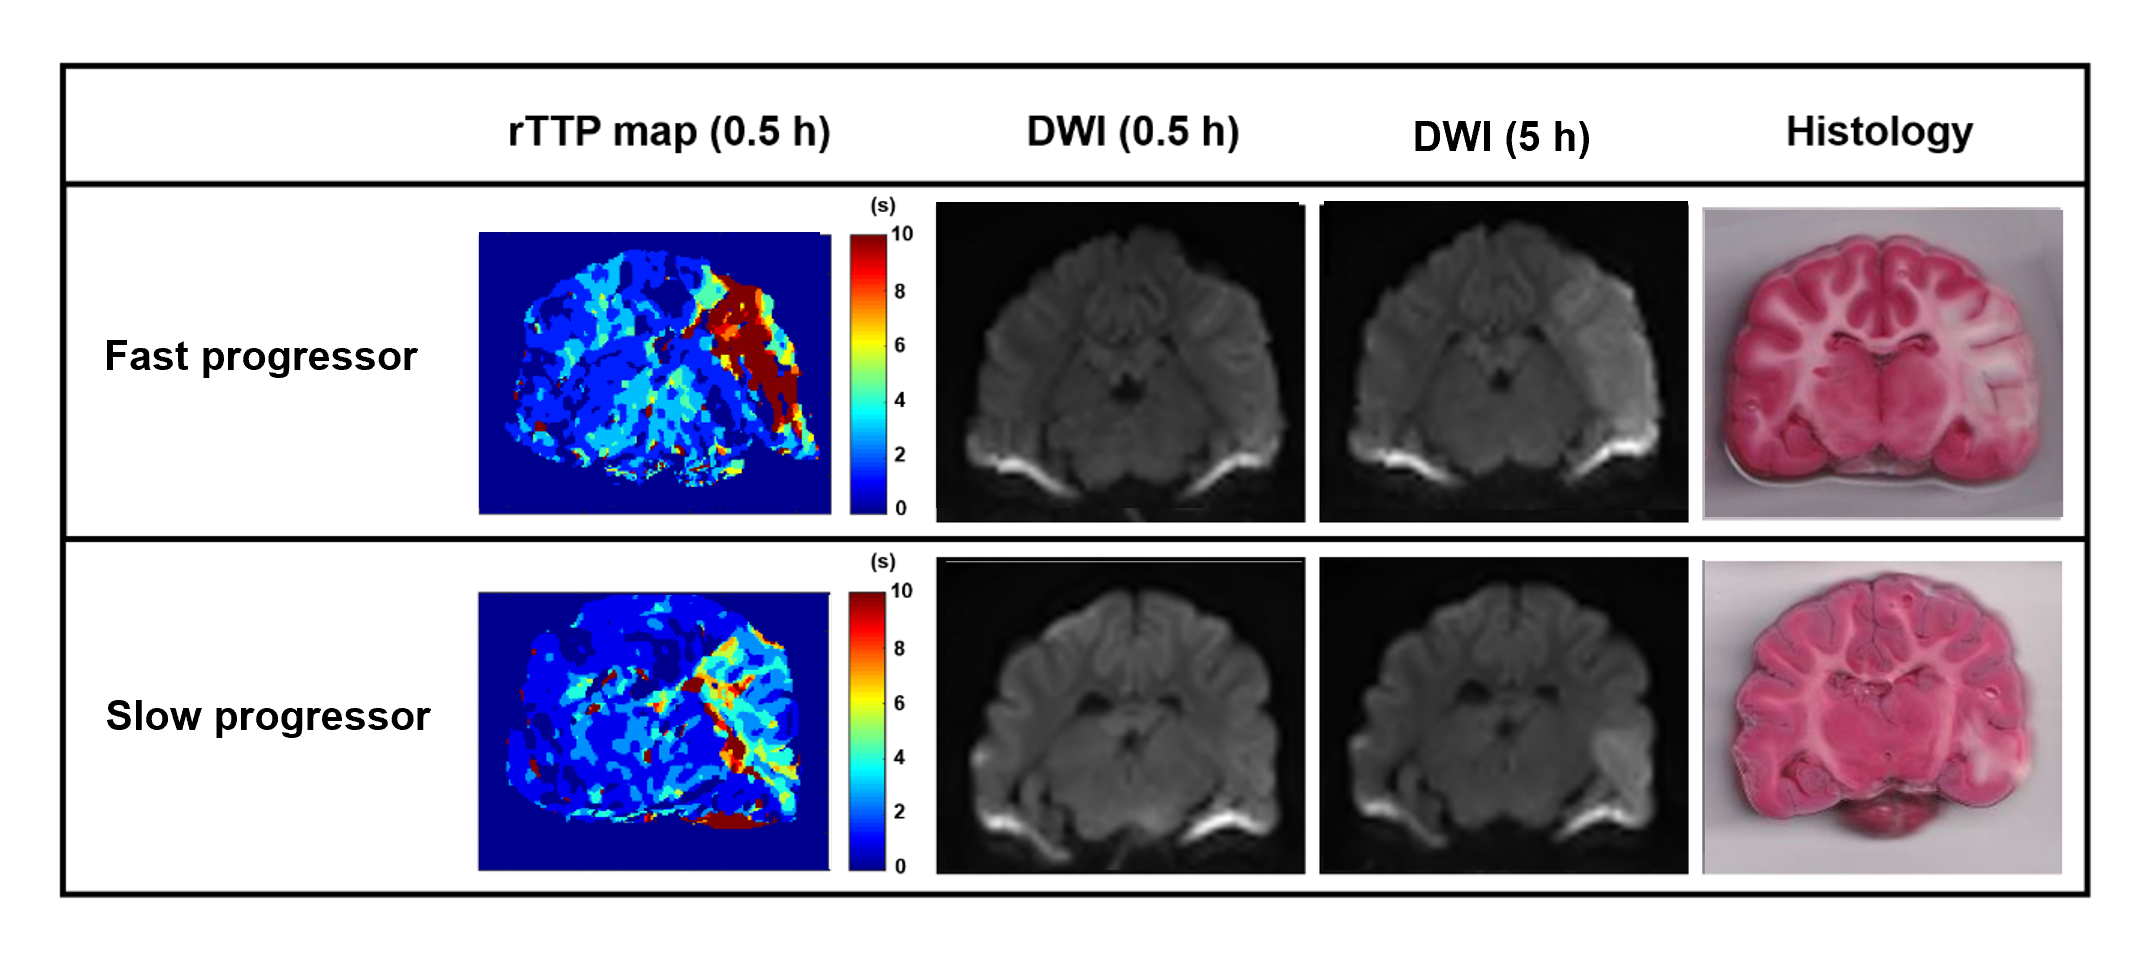
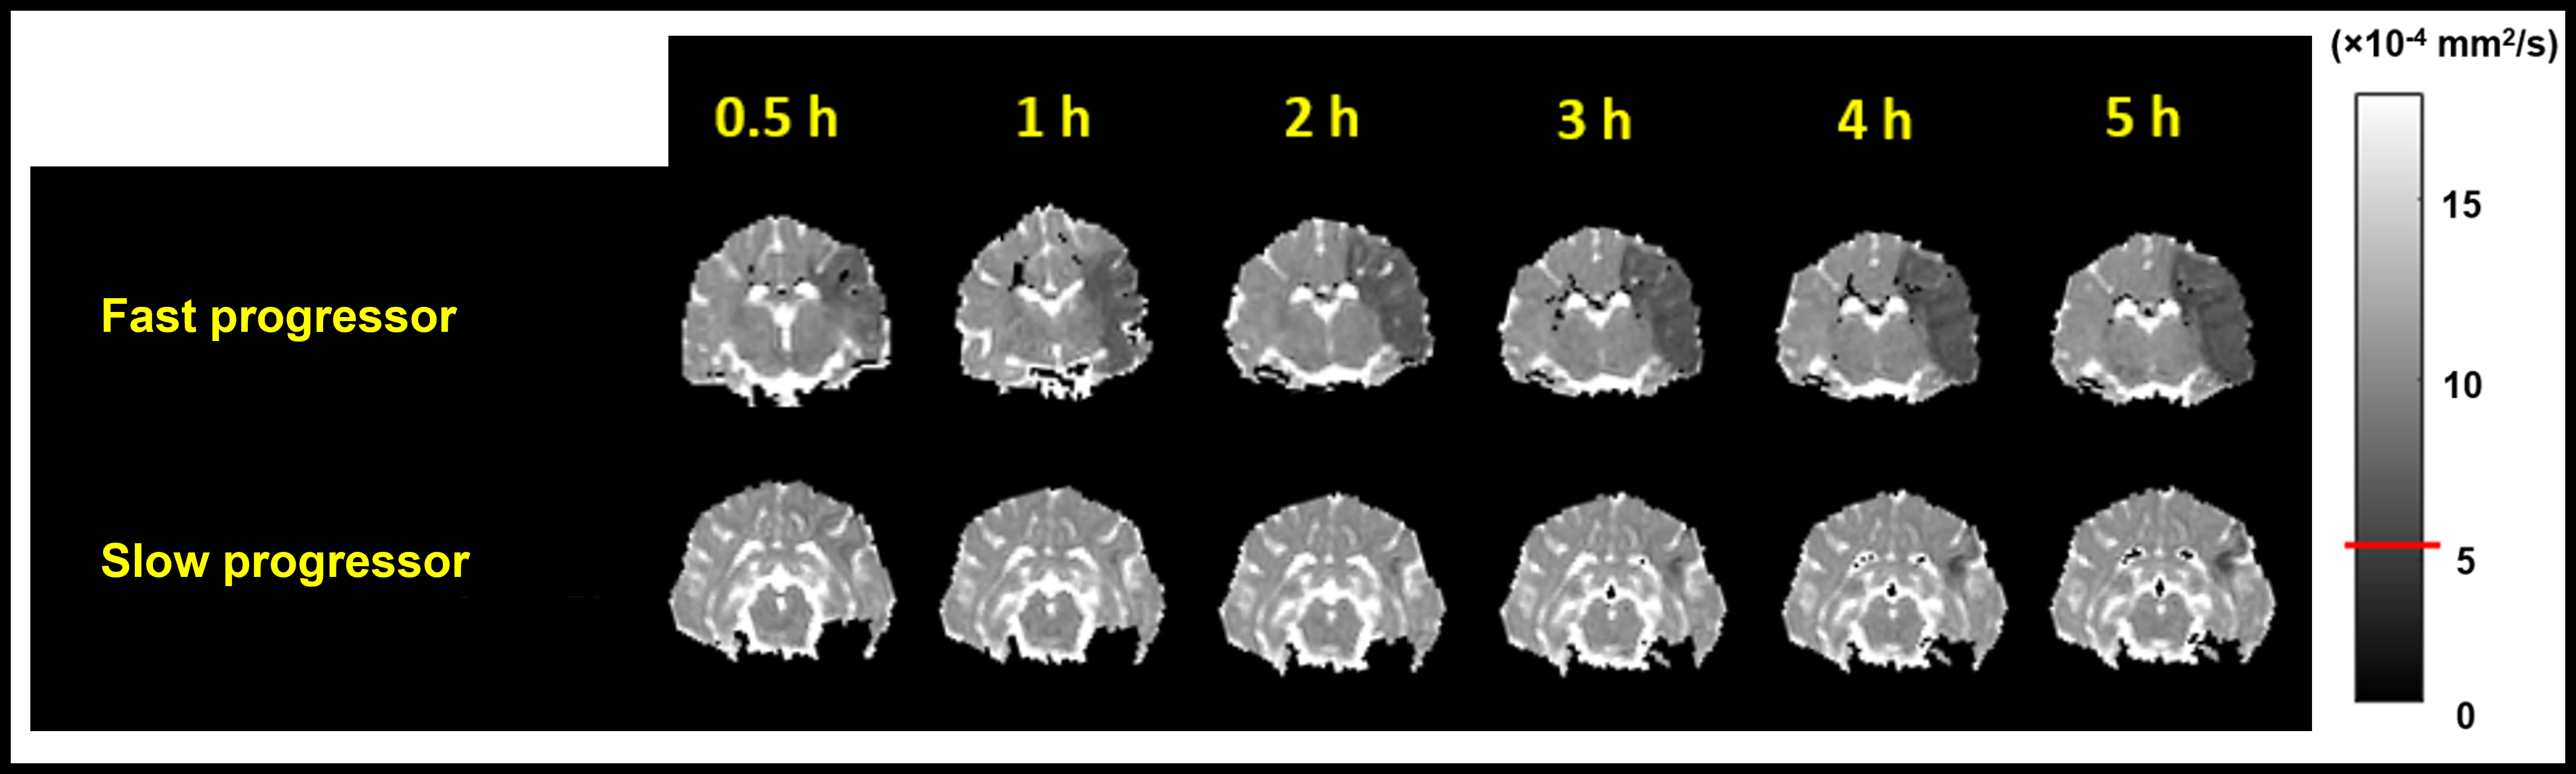
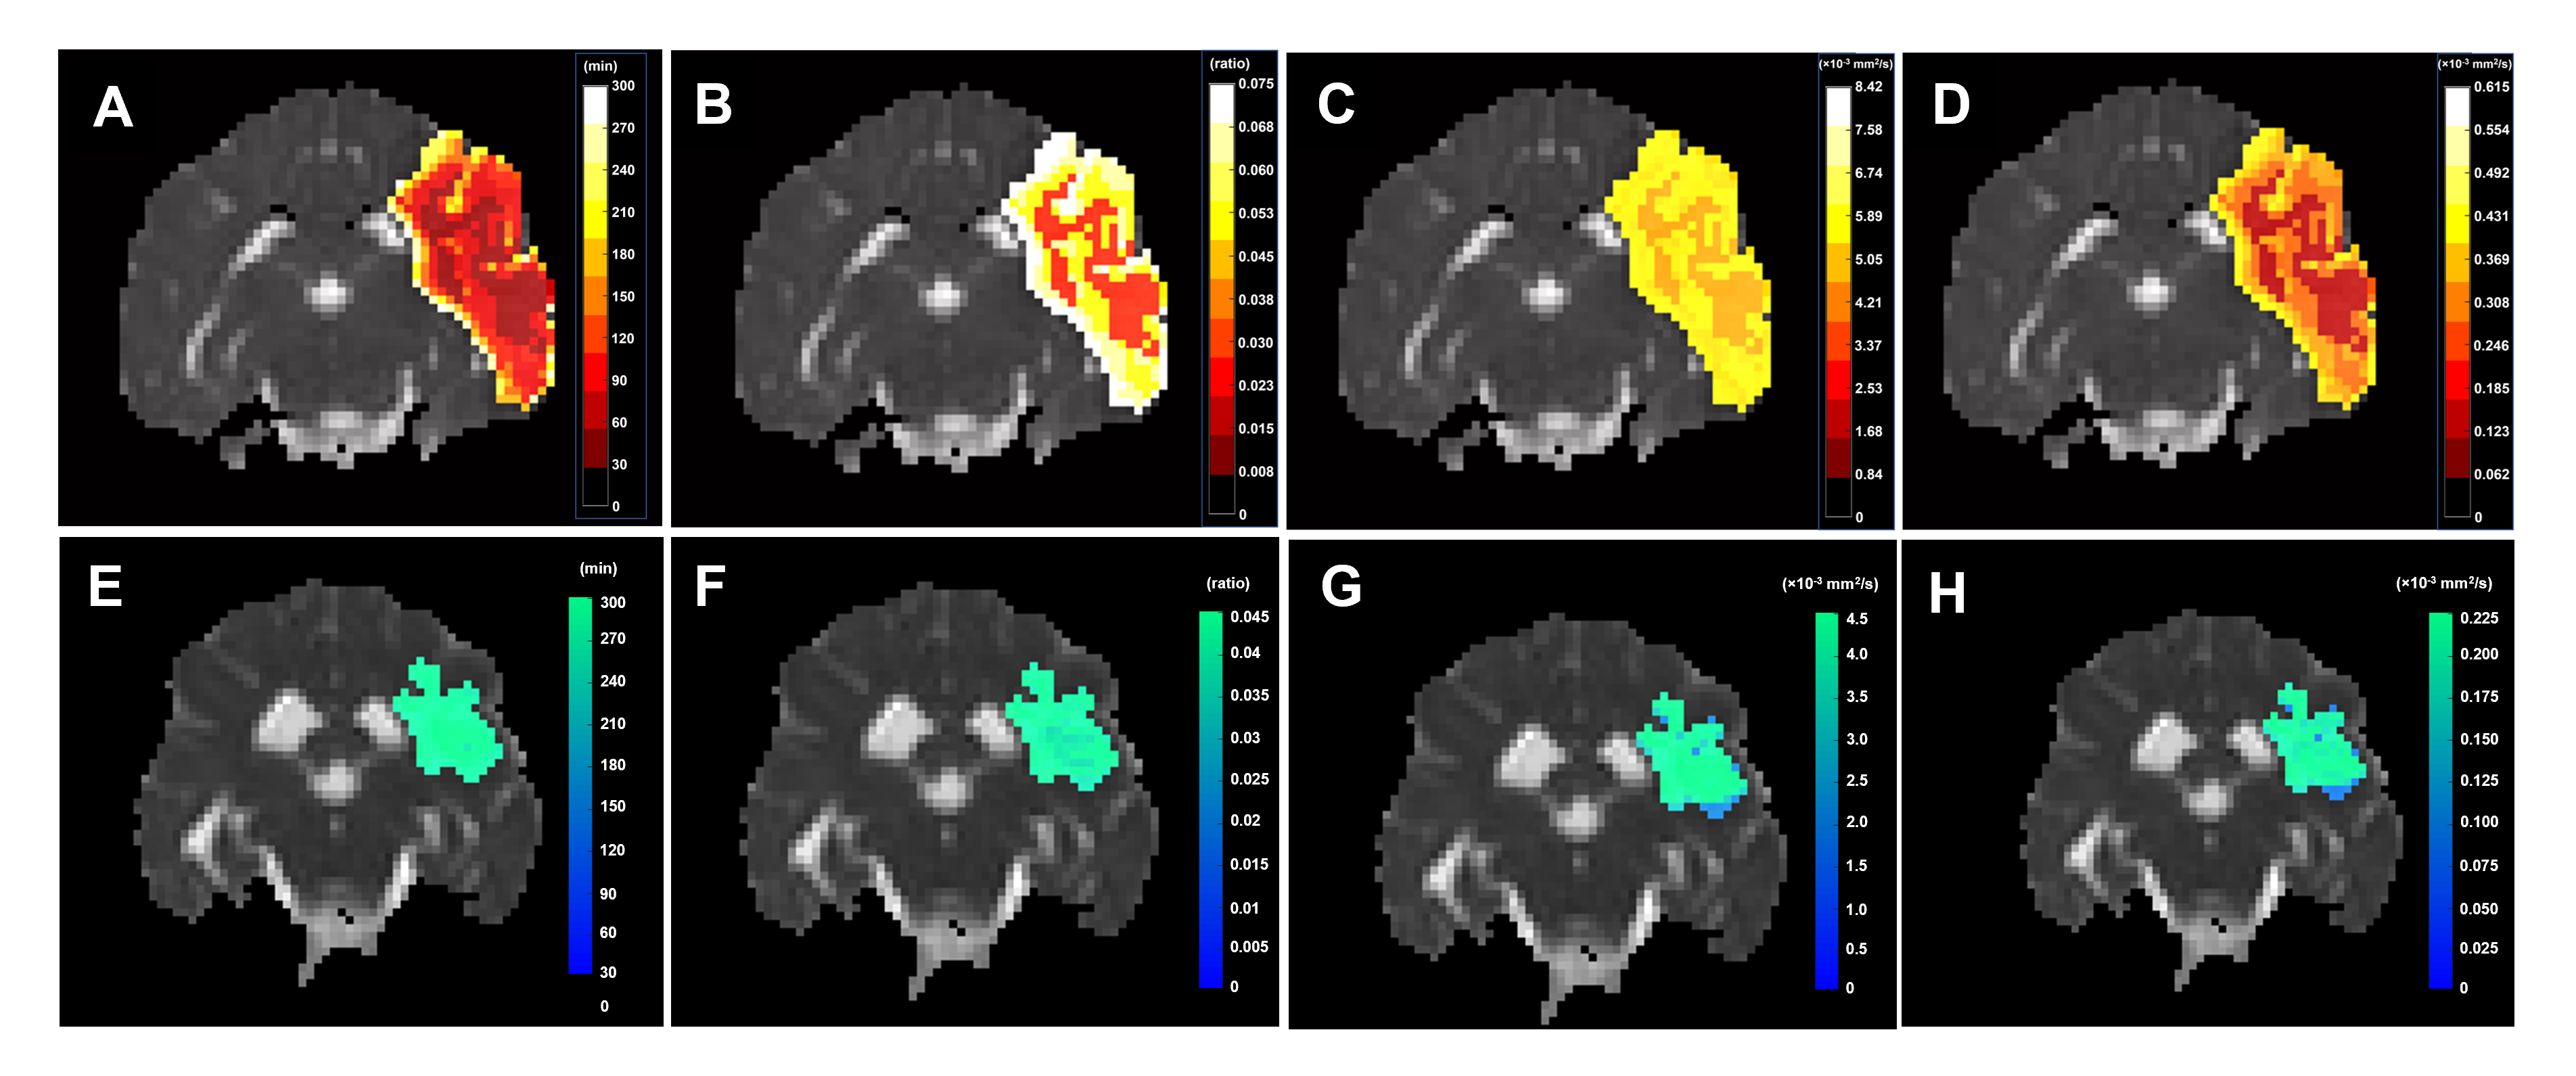
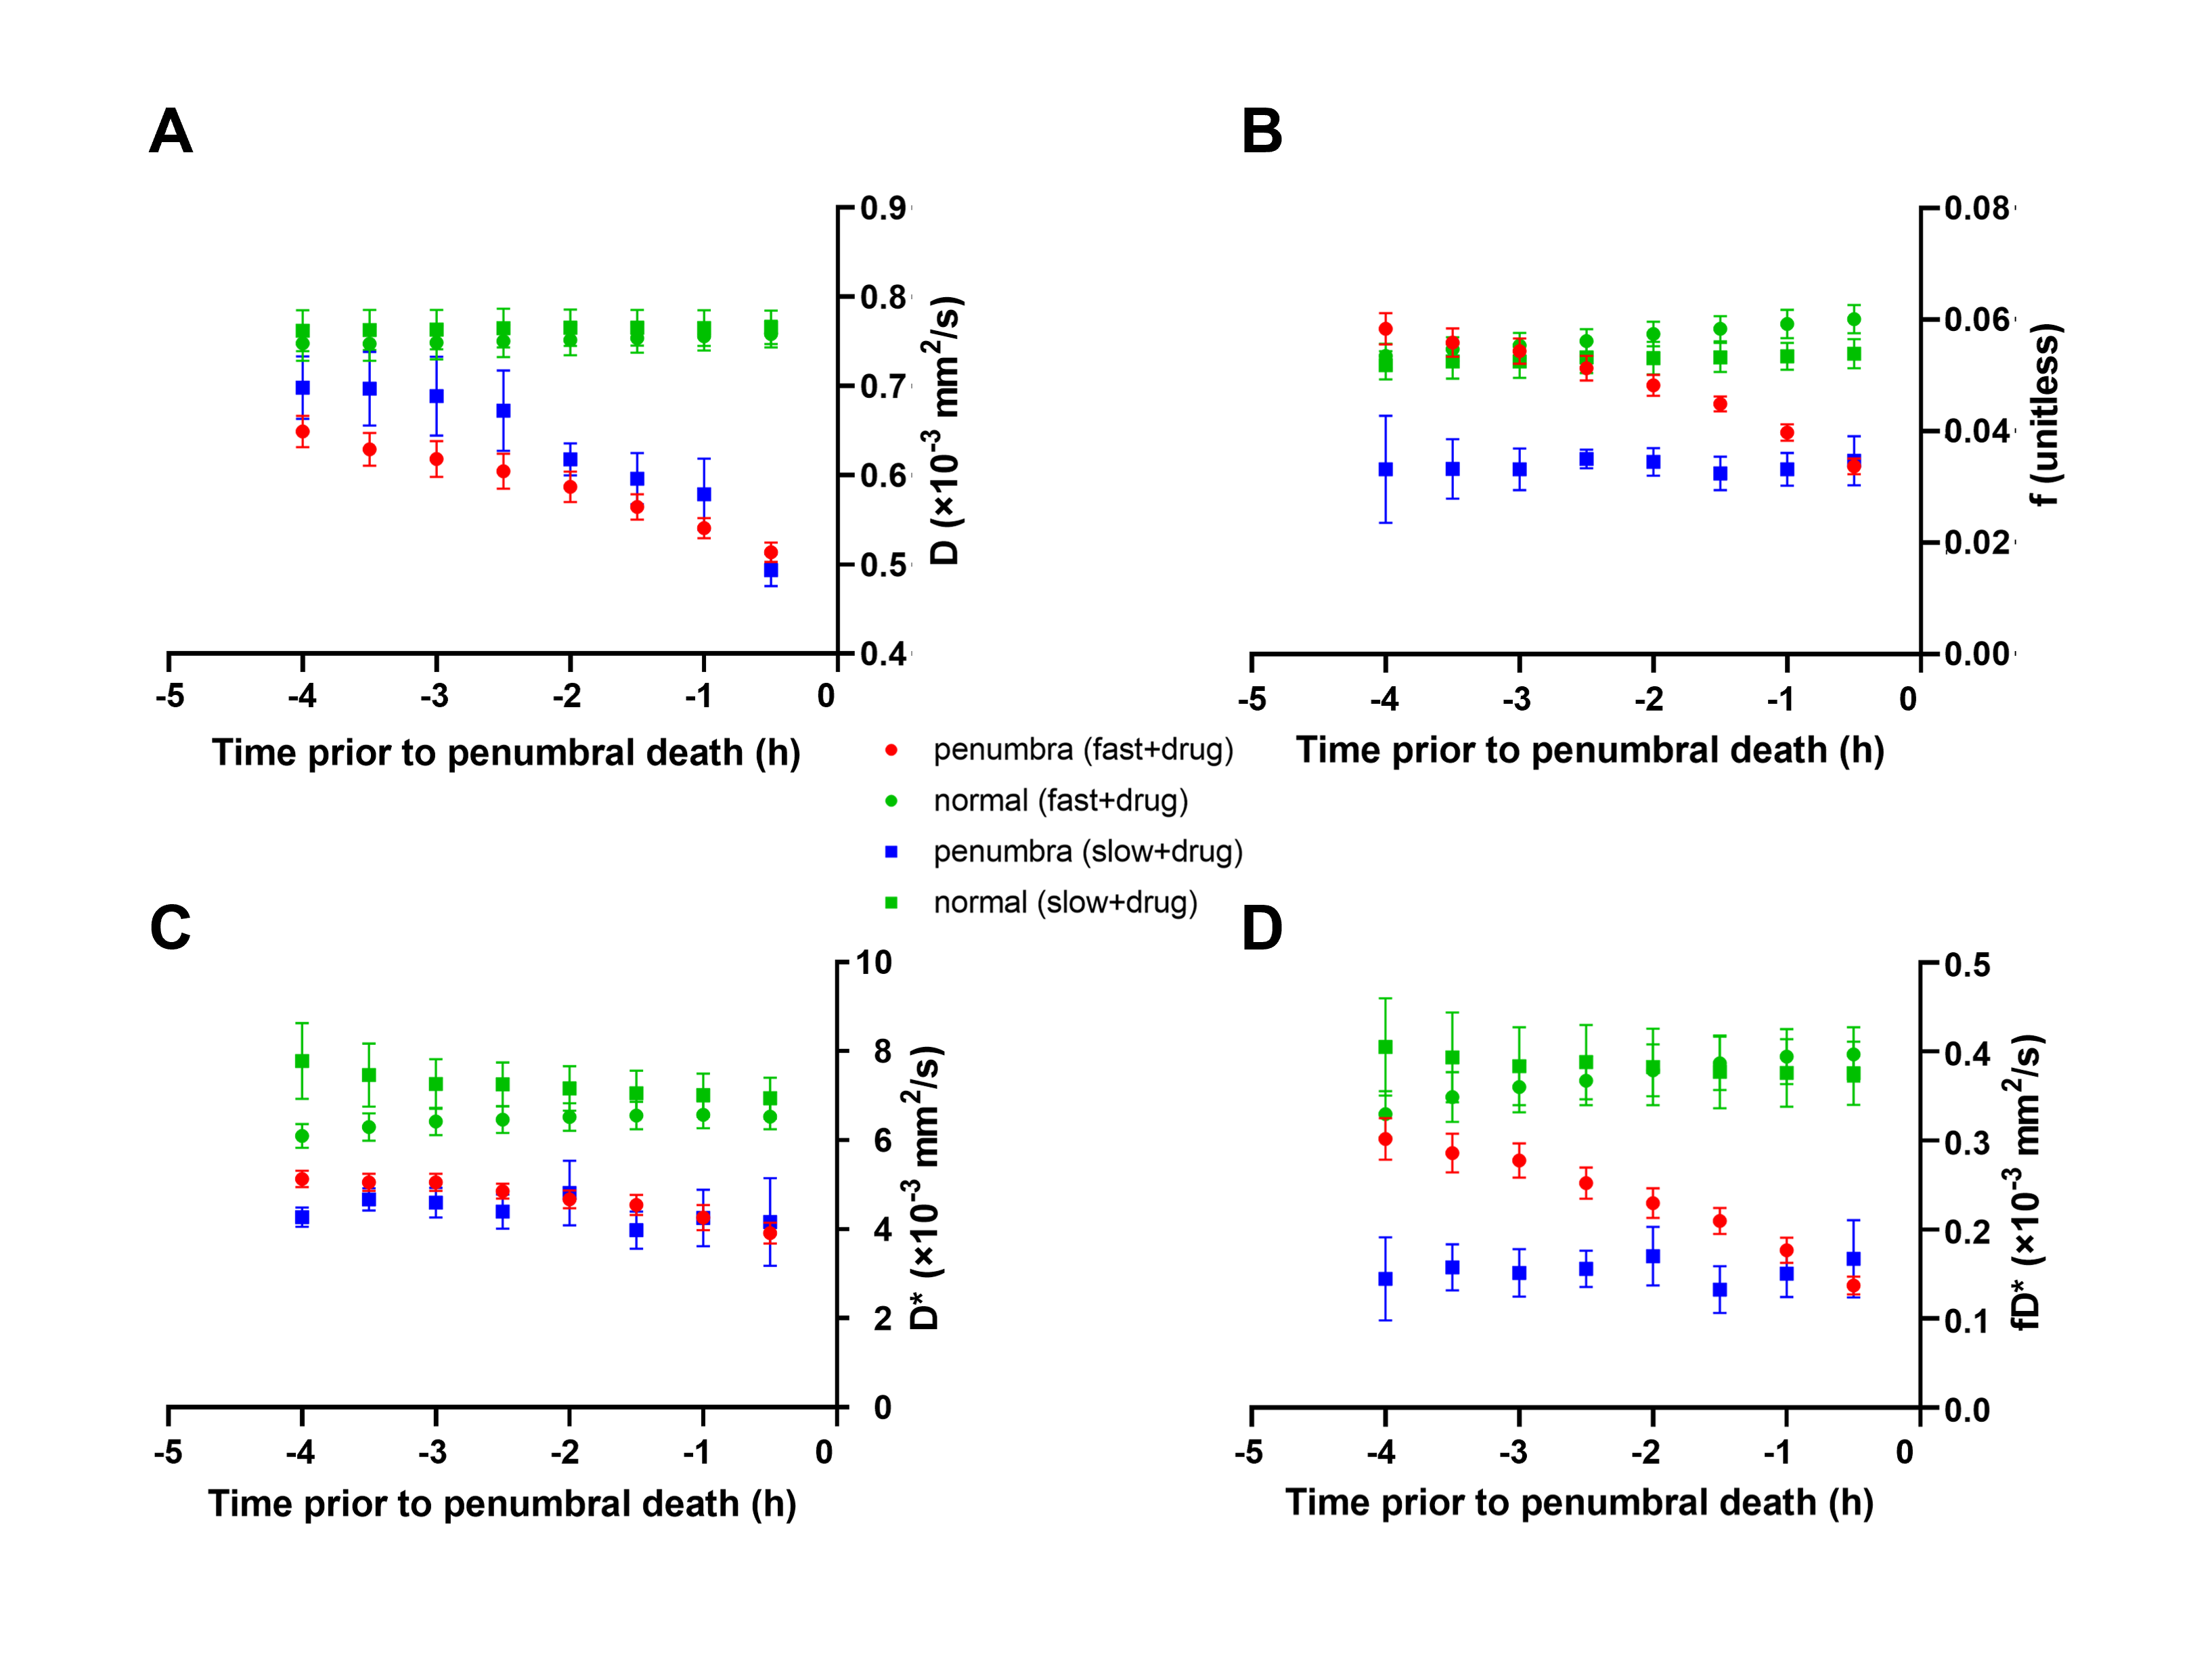
Of the 12 dogs, 9 were FP and 3 were SP with final DWI infarct sizes of 6.9±2.8 cm3 and 2.1±0.4 cm3, respectively. Figure 2 shows examples of FP/SP with an infarct region as indicated in the PW-MRI, DW-MRI, and histology. Figure 3 depicts the infarct growth as assessed by ADC maps of FP/SP. Figure 4 indicates the correlation of IVIM parameters with the final infarct distribution seen in the FP ADC map with the colormap indicating time to tissue death (Fig. 4A). Figures 4BCD show the f, D*, and fD* values, respectively, in the penumbral region at the first 0.5 h timepoint, where f (microvascular volume fraction) and fD* (microvascular perfusion) show a good prediction of infarct progression. In the SP, homogeneous delay of infarct in the ADC map (Fig. 4E) makes the IVIM parameter maps (Fig. 4FGH) less reliable in predicting the infarct delay pattern. Figure 5 shows the quantification of all IVIM parameters in the penumbra and normal tissue of FPs/SPs grouped by time prior to penumbral death. The normal tissue shows a horizontal line indicating minimal changes. The FP penumbra shows a decrease in all IVIM parameters as penumbra tissue got closer to penumbral death (ANOVA p<0.01). In comparison, the SPs show a relatively low and constant level from the onset for f and fD* perhaps due to vasoconstriction induced by the oxygen carrier7. This might indicate that the oxygen carrier was more active in the hypoxic tissue of FPs compared to that of SPs in the microvascular level, which resulted in a greater effect of delaying stroke onset in FPs compared to SPs2.Conclusion
The perfusion information obtained from IVIM identified differential microvascular behavior in the ischemic penumbra of FP versus SP treated with an oxygen carrier. The FPs demonstrated a favorable utility of IVIM parameters in predicting the timeline of decline in the penumbral tissue compared to the SPs, which can be useful information in patient selection for interventions.Acknowledgements
This work was funded by NINDS 5R44NS076272-03. The content is solely the responsibility of the authors and does not represent the official views of the NIH.References
1. Leibeskind DS, Saber H, Xiang Bm et al. Collateral Circulation in Thrombectomy for Stroke After 6 to 24 Hours in the DAWN Trial. Stroke. 2021; doi: 10.1161/STROKEAHA.121.034471.
2. Shazeeb MS, King RM, Anagnostakou V et al. Novel oxygen carrier slows infarct growth in large vessel occlusion dos model based on magnetic Resonance Imaging Analysis. Stroke. 2022;53:1363-1372.
3. Le Bihan D, Breton E, Lallemand D et al. MR imaging of intravoxel incoherent motions: applications to diffusion and perfusion in neurologic disorders. Radiology. 1986;161:401-407.
4. Kang BT, Lee JH, Jung DI et al. Canine model of ischemic stroke with permanent middle cerebral artery occlusion: clinical and histopathological findings. J Vet Sci. 2007;8:369-376.
5. Shazeeb MS, King RM, Brooks OW et al. Infarct Evolution in a Large Animal Model of Middle Cerebral Artery Occlusion. Transl Stroke Res. 2019; doi: 10.1007/s12975-019-00732-9.
6. Zhu G, Federau C, Wintermark M et al. Comparison of MRI IVIM and MR perfusion imaging in acute ischemic stroke due to large vessel occlusion. Int J Stroke. 2019; doi: 10.1177/1747493019873515.
7. Taverne YJ, de Wijs-Meijler D, Hekkert ML et al. Normalization of hemoglobin-based oxygen carrier-201 induced vasoconstriction: targeting nitric oxide and endothelin. J Appl Physiol. 2017;122:1227-1237.
Figures