0882
Relationship between Lenticulostriate Arteries Numbers and White Matter Changes in Cerebral Small Vessel Disease Patients1the First Affiliated Hospital of Dalian Medical University, Dalian, China, 2Clinical and Technical Support, Philips Healthcare, shanghai, China, 3Clinical and Technical Support, Philips Healthcare, beijing, China
Synopsis
Keywords: Stroke, White Matter, Cerebral Small Vessel Disease
In this study, according to the number of lenticulostriate arteries (LSAs), cerebral small blood vessel disease (CSVD) was divided into three groups. Differences of typical CSVD markers and whole brain analysis based on diffusion tensor imaging (DTI) were explored among three groups. It was found that with the decrease of the number of LSAs, the volume of WMH and the scope and extent of fiber tract damage increased. Results show that the change of LSAs have the potential to represents extensive subcortical microvascular damage of brain tissues in CSVD.Introduction
Cerebral small blood vessel disease (CSVD) was a dynamic and whole-brain disorder. Quantitative MRI methods such as DTI, T1 mapping, and dynamic contrast-enhanced MRI, reveal increasingly abnormal tissue (increased MD, reduced FA, reduced network efficiency, and increased absolute T1 values) in a perilesional zone of normal appearing white matter around white matter hyperintensities and lacunes 1-3. However, the typical six MRI markers only show the results caused by small vascular lesions, but cannot directly show the small vessel themselves. This study aims to explore the correlation between the number of lenticulostriate arteries (LSAs) by high-resolution vessel-wall imaging and imaging markers by diffusion tensor imaging (DTI) and typical MRI, and to demonstrate the preliminary feasibility of LSAs as a CSVD marker.Methods
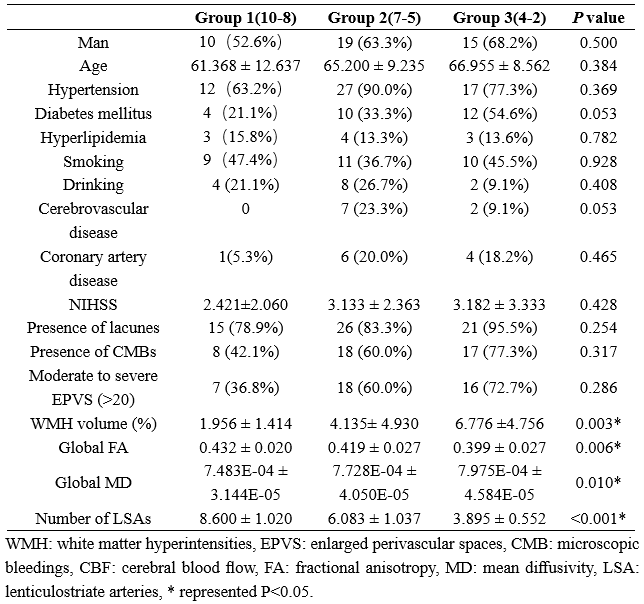
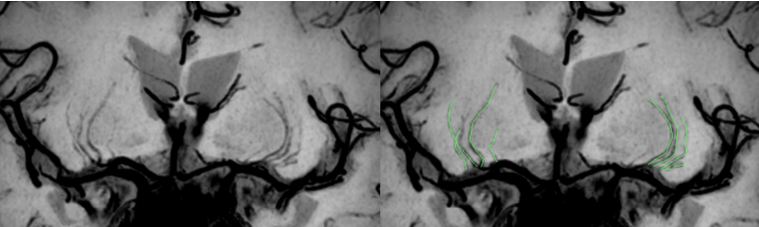
Seventy-one patients with CSVD were prospectively enrolled to perform multiparametric magnetic resonance imaging (MRI) examination. The number of LSAs were obtained by high-resolution vascular wall MRI (HR VMI), and CSVD patients were divided into three groups according to number of LSAs on both sides of the brain (group 1: 10~8; group 2: 7~5; group 3: 4~2)4 (Fig 1). Proportion of WMH volume was obtained on T2 Flair images using a fully automated procedure and was determined as the ratio of White Matter Hyperintensity (WMH) volume to normalized brain volume. Based on DTI and tract-based spatial statistics (TBSS) analysis, differences of white matter fiber indicators among three groups were compared, including fractional anisotropy (FA) and mean diffusivity (MD)5.Results
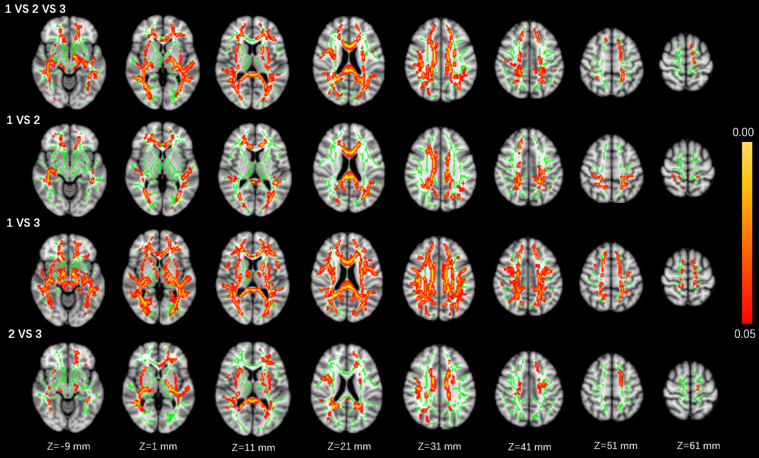
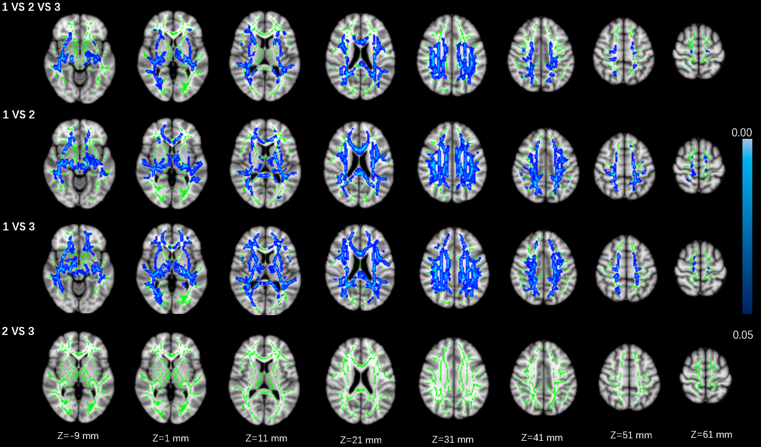
Statistical differences were observed in the WMH volume (P=0.003), global FA value (P=0.006), and global MD value (P=0.010) among three groups. Significant correlations were observed between MR parameters and the number of LSAs, including: WMH volume (r = − 0.319, P = 0.016), global FA (r = 0.319, P = 0.016), and global MD (r = − 0.298, P = 0.026) (Fig. 1). Group differences involved most parts of the brain were found in DTI indicators (p < 0.05) based on TBSS analysis, after adjusting for age and gender (Figures 2 and 3; Table 2).Discussion
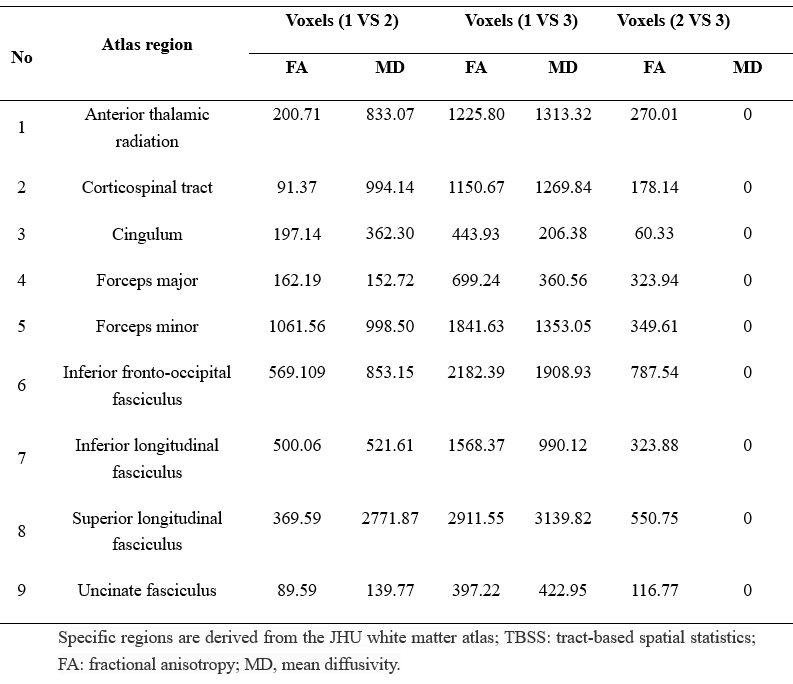
This study found that with the decrease of the number of LSAs in CSVD patients, the WMH volume gradually increased, the FA value of the whole brain decreased, and the MD value of the whole brain increased. WMH and DTI parameters (FA and MD) reflect the damage of the WM. MD is a marker of WM ultrastructure independent to orientation, which could describe the overall extent of water diffusion, and FA provides information on the directionality of the diffusion tensor and therefore shows the organization and damage of the ultrastructure 6. As the progress of CSVD, cerebrovascular autoregulation (CA) regulation and cerebrovascular reactivity (CVR) function cloud not be maintained, diffuse endothelial failure occurs, arteriosclerosis, lipohyalinosis and fibrinoid degeneration get worse. These will lead to vessel walls thickened and lumen occlusion of small vessels in cerebral cortex, deep medulla and basal ganglia regions, which could contribute reduced perfusion and concomitant demyelination, axon loss, and gliosis. Eventually, the corresponding WMH appeared on imaging7, 8.For FA and MD based on TBSS analysis, comparison among the three groups and pairwise comparison showed different degrees of damage to fiber tracts in almost all parts of the brain, including association fibers (cingulum, inferior fronto-occipital fasciculus, inferior longitudinal fasciculus, superior longitudinal fasciculus, and uncinate fasciculus), commissural fibers (forceps major and forceps minor), projection fibers (anterior thalamic radiation and corticospinal tract). Compared with comparison between groups 2 vs. 3 or between groups 1 vs. 2, the comparison between groups 1 vs. 3 involved a larger range of damage of fiber tracts, which proved that the fewer the number of LSAs, the more serious of WM ultrastructure damage. However, although the damage to these WM fibers should be caused by the stenosis and occlusion of the perforated arteries and arterioles that supply the corresponding areas, which were not directly related to the LSAs supplying the ganglia area, this suggests that the change in the number of LSAs may represent the functional status of the whole brain perforator artery and arteriole. Therefore, visualization by LSAs makes it possible to capture early microvascular pathological changes before permanent parenchymal damage occurs in the CSVD 9.
Conclusion
Decrease in the number of LSAs may lead to increased volume of WMH and increased degree of fiber tract damage in most brain regions of CSVD, which were manifested as a decrease in FA value and an increase in MD value. This study demonstrates that the number of LSAs have the potential to serve as a CSVD imaging marker to represents extensive subcortical microvascular damage of brain tissue.Acknowledgements
No acknowledgement found.References
1. Munoz Maniega S, Chappell FM, Valdes Hernandez MC, et al. Integrity of normal-appearing white matter: Influence of age, visible lesion burden and hypertension in patients with small-vessel disease [J]. J Cereb Blood Flow Metab, 2017, 37(2): 644-656.
2. van Leijsen EMC, Bergkamp MI, van Uden IWM, et al. Progression of White Matter Hyperintensities Preceded by Heterogeneous Decline of Microstructural Integrity [J]. Stroke, 2018, 49(6): 1386-1393.
3. Hinman JD, Lee MD, Tung S, et al. Molecular disorganization of axons adjacent to human lacunar infarcts [J]. Brain, 2015, 138(Pt 3): 736-745.
4. Chen YC, Li YH, Lu J, et al. Correlation Between the Reduction in Lenticulostriate Arteries Caused by Hypertension and Changes in Brain Metabolism Detected With MRI [J]. AJR Am J Roentgenol, 2016, 206(2): 395-400.
5. Gu Y, Zhao P, Feng W, et al. Structural brain network measures in elderly patients with cerebral small vessel disease and depressive symptoms [J]. BMC Geriatr, 2022, 22(1): 568.
6. Beaulieu C. The basis of anisotropic water diffusion in the nervous system - a technical review [J]. NMR Biomed, 2002, 15(7-8): 435-455.
7. Sam K, Crawley AP, Conklin J, et al. Development of White Matter Hyperintensity Is Preceded by Reduced Cerebrovascular Reactivity [J]. Ann Neurol, 2016, 80(2): 277-285.
8. Promjunyakul NO, Dodge HH, Lahna D, et al. Baseline NAWM structural integrity and CBF predict periventricular WMH expansion over time [J]. Neurology, 2018, 90(24): e2119-e2126.
9. van den Brink H, Doubal FN, Duering M. Advanced MRI in cerebral small vessel disease [J]. Int J Stroke, 2022, 17474930221091879.
Figures