0881
Quantification of oxygen metabolism in acute ischemic stroke with multi-parametric quantitative BOLD MRI
Hongwei Li1, Ying-Hua Chu2, Yu Luo3, and He Wang1,4,5
1Institute of Science and Technology for Brain-Inspired Intelligence, Fudan University, Shanghai, China, 2MR Collaboration, Siemens Healthineers Ltd., Shanghai, China, 3Department of Radiology, Shanghai Fourth People's Hospital Affiliated to TongjiUniversity School of Medicine, Shanghai, China, 4Human Phenome Institute, Fudan University, Shanghai, China, 5Key Laboratory of Computational Neuroscience and Brain-Inspired Intelligence (Fudan University), Ministry of Education, Shanghai, China
1Institute of Science and Technology for Brain-Inspired Intelligence, Fudan University, Shanghai, China, 2MR Collaboration, Siemens Healthineers Ltd., Shanghai, China, 3Department of Radiology, Shanghai Fourth People's Hospital Affiliated to TongjiUniversity School of Medicine, Shanghai, China, 4Human Phenome Institute, Fudan University, Shanghai, China, 5Key Laboratory of Computational Neuroscience and Brain-Inspired Intelligence (Fudan University), Ministry of Education, Shanghai, China
Synopsis
Keywords: Stroke, Oxygenation
Multi-parametric quantitative BOLD (Mq-BOLD), a biophysical model-based technology, has shown promising results for measuring brain oxygenation in healthy subjects. Our purpose is to explore Mq-BOLD in evaluating the changes of oxygen metabolism in early stage of acute ischemic stroke. There is compensatory elevated oxygen extraction fraction (OEF) in the hypoperfused tissue, but decreased cerebral metabolic rate of oxygen (CMRO2) present in the central part of the infarct core. These alternative biomarkers may provide intuitive diagnostic information of ischemic penumbra in stroke. Moreover, Mq-BOLD only depends on standard clinical imaging protocols, which has a great potential for future routine application.Introduction
Early detection of the ischemic penumbra is critical to treatment strategies for patients with acute ischemic stroke (AIS)1. Quantitative brain oxygenation parameters, such as oxygen extraction fraction (OEF) and cerebral metabolic rate of oxygen (CMRO2), are now considered to be an important indicator for assessing salvageable tissue, which can be quantified by various MRI-based imaging techniques. In this study, multi-parametric quantitative BOLD (Mq-BOLD) was used to measure voxel-wise OEF mapping and we evaluate the potential clinical benefit of Mq-BOLD measurements in AIS.Materials and methods
Data acquisitionThis study was approved by the local institutional review board. Sixteen patients with distinct diffusion-perfusion mismatch but no severe head motion was selected from daily routine scans for the following qualitative analysis. All MR images were acquired on a 3.0-T MRI scanner (MAGNETOM Prisma, Siemens Healthcare) with a 32-channel head coil. The imaging protocol was composed of Strategically Acquired Gradient Echo (STAGE) imaging (resolution= 0.7×0.7×2.0mm3; STAGE-B1: TR/TE1/TE2=25.0/7.50/17.50ms, flip angle=6°; STAGE-B2: TR/TE1/TE2=25.0/8.75/18.75 ms, flip angle=24°; scan duration=5mins), Dynamic Susceptibility Contrast (DSC) spin-echo EPI sequence (resolution=1.7×1.7×5.0mm3, TR/TE=1500/30.0ms, measurements=60, EPI factor=128, scan duration=1min30s), 2D Multiple Spin-Echo (MSE) sequence, T2 Fluid Attenuated Inversion Recovery (T2-FLAIR), and Diffusion-Weighted Imaging (DWI). For the DSC examination, gadopentetate dimeglumine (Gd-DTPA) (Shanghai Pharmaceutical Corporation) was injected with a dose of 0.2 mmol/kg body weight and a saline flush of 30 mL at the same injection flow rate of 4 mL/s.
Image processing
Mq-BOLD relies on the analytical tissue model proposed by Yablonskiy and Haacke in 19942. The estimates of the transverse relaxation rates R2*=1/T2* and R2=1/T2 as well as the relative cerebral blood volume (rCBV), which directly determine the OEF value, are based on three separate measurements3,4. R2 maps were calculated from the even echoes relaxometry data to reduce stimulated echoes5. R2* maps were generated using the two echoes for each STAGE scan, then averaged6. DSC perfusion weighted imaging (PWI) analysis was followed the mature processes to calculate time-to-maximum (Tmax), relative cerebral blood flow (rCBF), and leakage corrected rCBV7. The perfusion parameters rCBF and rCBV values were then normalized to 50 mL/100g/min and 2.5% in a small region of non-hypoperfusion gray matter, respectively8. The oxygen extraction fraction was then calculated using:$$OEF=\frac{R_{2}^{*}-R_{2}}{\frac{4}{3}\cdot rCBV\cdot\pi\cdot\gamma\cdot\bigtriangleup\chi _{0}\cdot Hct\cdot B_{0} }$$where the introduced parameters are assumed to be constant ($$$\bigtriangleup\chi _{0}=0.246\times 10^{-6} $$$, $$$Hct=0.35$$$, $$$\gamma=2.675\times10^{8}s^{-1}T^{-1}$$$, $$$B_{0}=3T$$$)4. The CMRO2 maps were generated using the equation: CMRO2=CaO2×OEF×rCBF, where CaO2=8.68 μmol/mL is the arterial oxygen content. The apparent diffusion coefficient (ADC) map was used to predict the ischemic core (ADC<620×10-6mm2/s) and a threshold of Tmax greater than 6 seconds was used to define the hypoperfused tissue10 (Fig.1). The penumbra was identified by PWI-DWI mismatch regions.
Results
Example brain oxygenation maps are shown in Fig.2. Our data revealed that the absolute OEF in penumbra (42.8±10.3%) and hypoperfused tissue (43.5±11.1%) were higher than that of the contralateral hemisphere (27.7±6.5%), but there was no significantly difference between them. CBF in the ischemic core (10.2±4.68 mL/100g/min) was the lowest and significantly lower than that in the other three regions. Unlike OEF, the contralateral CBF was higher than that in the hypoperfused and penumbra regions. Also, CMRO2 showed the lowest mean value in the ischemic core (27.92±14.11μmol/100g/min), but the CMRO2 was significantly higher in hypoperfusion regions than in the opposite side (65.57±15.68μmol/100g/min).Discussion
Our study had demonstrated the feasibility of Mq-BOLD in a clinical setting. Despite limited data, the generated cerebral OEF mapping revealed a compensatory increase in the ischemic hemisphere. Meanwhile, CMRO2 also showed a clear demarcation between the internal ischemic core and the surrounding hypoperfused tissue, indicating the imbalance in oxygen metabolism. However, the value of OEF in penumbra was similar to that of the ischemic core defined by ADC threshold (Fig.3). The result wasn’t consistent with the previous MRI-based OEF research11. Since rCBV is a very small value, small variance of rCBV would significantly influence the OEF contrast, reflecting an inherited constraint of the model itself.Besides, only 16 patients with DWI-PWI mismatch remained in the analysis because relative high-quality images were necessary to measure the brain oxygenation maps. In the future, we have to expand sample size and test the Mq-BOLD approach in different groups of AIS patients because their hemodynamic, metabolic changes might be different and how to define the penumbra may need further discussion12. Accuracy of relaxation rates (R2*, R2) quantification directly determines the reliability of Mq-BOLD. Currently we use STAGE to replace the conventional multi-echo GRE just because of other ongoing stroke projects. STAGE provided T1-Weighted imaging and segmentation results, of course, simplifying the registration steps. Using two different flip angles, field correction was available for STAGE itself to calculate more accurate R2*. What’s more, 3D Gradient and spin echo sequence could reduce R2 related bias in Mq-BOLD3.
Conclusion
Different acute stroke lesions have different tissue outcomes. Our current results suggest that Mq-BOLD could capture the heterogeneity of brain oxygen metabolism in AIS patients. The calculated OEF and CMRO2 maps, combined with the DWI-PWI analysis, may help us to understand the underlying progress of hemodynamic changes in AIS and provide valuable information about regional oxygenation, but as for the definition of the stroke lesions, the thresholds of these brain oxygenation parameters need further discussion.Acknowledgements
This work was supported by the National Natural Science Foundation of China (No. 81971583), National Key R&D Program of China (No. 2018YFC1312900), Shanghai Natural Science Foundation (No. 20ZR1406400), Shanghai Municipal Science and Technology Major Project (No.2017SHZDZX01, No.2018SHZDZX01) and ZJLab.References
1. Wintermark, M. et al. Imaging recommendations for acute stroke and transient ischemic attack patients: A joint statement by the American Society of Neuroradiology, the American College of Radiology, and the Society of NeuroInterventional Surgery. AJNR Am J Neuroradiol 34, E117-E127, doi:10.3174/ajnr.A3690 (2013).2. Yablonskiy, D. A. & Haacke, E. M. Theory of NMR signal behavior in magnetically inhomogeneous tissues: The static dephasing regime. Magnetic Resonance in Medicine 32, 749-763, doi:https://doi.org/10.1002/mrm.1910320610 (1994).
3. Kaczmarz, S., Hyder, F. & Preibisch, C. Oxygen extraction fraction mapping with multi-parametric quantitative BOLD MRI: Reduced transverse relaxation bias using 3D-GraSE imaging. NeuroImage 220, 117095, doi:https://doi.org/10.1016/j.neuroimage.2020.117095 (2020).
4. Hirsch, N. M. et al. Technical considerations on the validity of blood oxygenation level-dependent-based MR assessment of vascular deoxygenation. NMR in Biomedicine 27, 853-862, doi:https://doi.org/10.1002/nbm.3131 (2014).
5. Pell, G. S. et al. Optimized clinical T2 relaxometry with a standard CPMG sequence. Journal of Magnetic Resonance Imaging 23, 248-252, doi:https://doi.org/10.1002/jmri.20490 (2006).
6. Chen, Y., Liu, S., Wang, Y., Kang, Y. & Haacke, E. M. STrategically Acquired Gradient Echo (STAGE) imaging, part I: Creating enhanced T1 contrast and standardized susceptibility weighted imaging and quantitative susceptibility mapping. Magnetic Resonance Imaging 46, 130-139, doi:https://doi.org/10.1016/j.mri.2017.10.005 (2018).
7. Kluge, A. et al. Analysis of three leakage-correction methods for DSC-based measurement of relative cerebral blood volume with respect to heterogeneity in human gliomas. Magnetic Resonance Imaging 34, 410-421, doi:https://doi.org/10.1016/j.mri.2015.12.015 (2016).
8. Carroll, T. J. et al. Quantification of cerebral perfusion using the “bookend technique”: an evaluation in CNS tumors. Magnetic Resonance Imaging 26, 1352-1359, doi:https://doi.org/10.1016/j.mri.2008.04.010 (2008).
9. Christen, T., Schmiedeskamp, H., Straka, M., Bammer, R. & Zaharchuk, G. Measuring brain oxygenation in humans using a multiparametric quantitative blood oxygenation level dependent MRI approach. Magnetic Resonance in Medicine 68, 905-911, doi:https://doi.org/10.1002/mrm.23283 (2012).
10. Lu, X. et al. Quantitative susceptibility-weighted imaging may be an accurate method for determining stroke hypoperfusion and hypoxia of penumbra. European Radiology 31, 6323-6333, doi:10.1007/s00330-020-07485-2 (2021).
11. Zhang, S. et al. Initial Experience of Challenge-Free MRI-Based Oxygen Extraction Fraction Mapping of Ischemic Stroke at Various Stages: Comparison With Perfusion and Diffusion Mapping. 14, doi:10.3389/fnins.2020.535441 (2020).
12. Fan, A. P. et al. Elevated brain oxygen extraction fraction measured by MRI susceptibility relates to perfusion status in acute ischemic stroke. J Cereb Blood Flow Metab 40, 539-551, doi:10.1177/0271678X19827944 (2020).
Figures
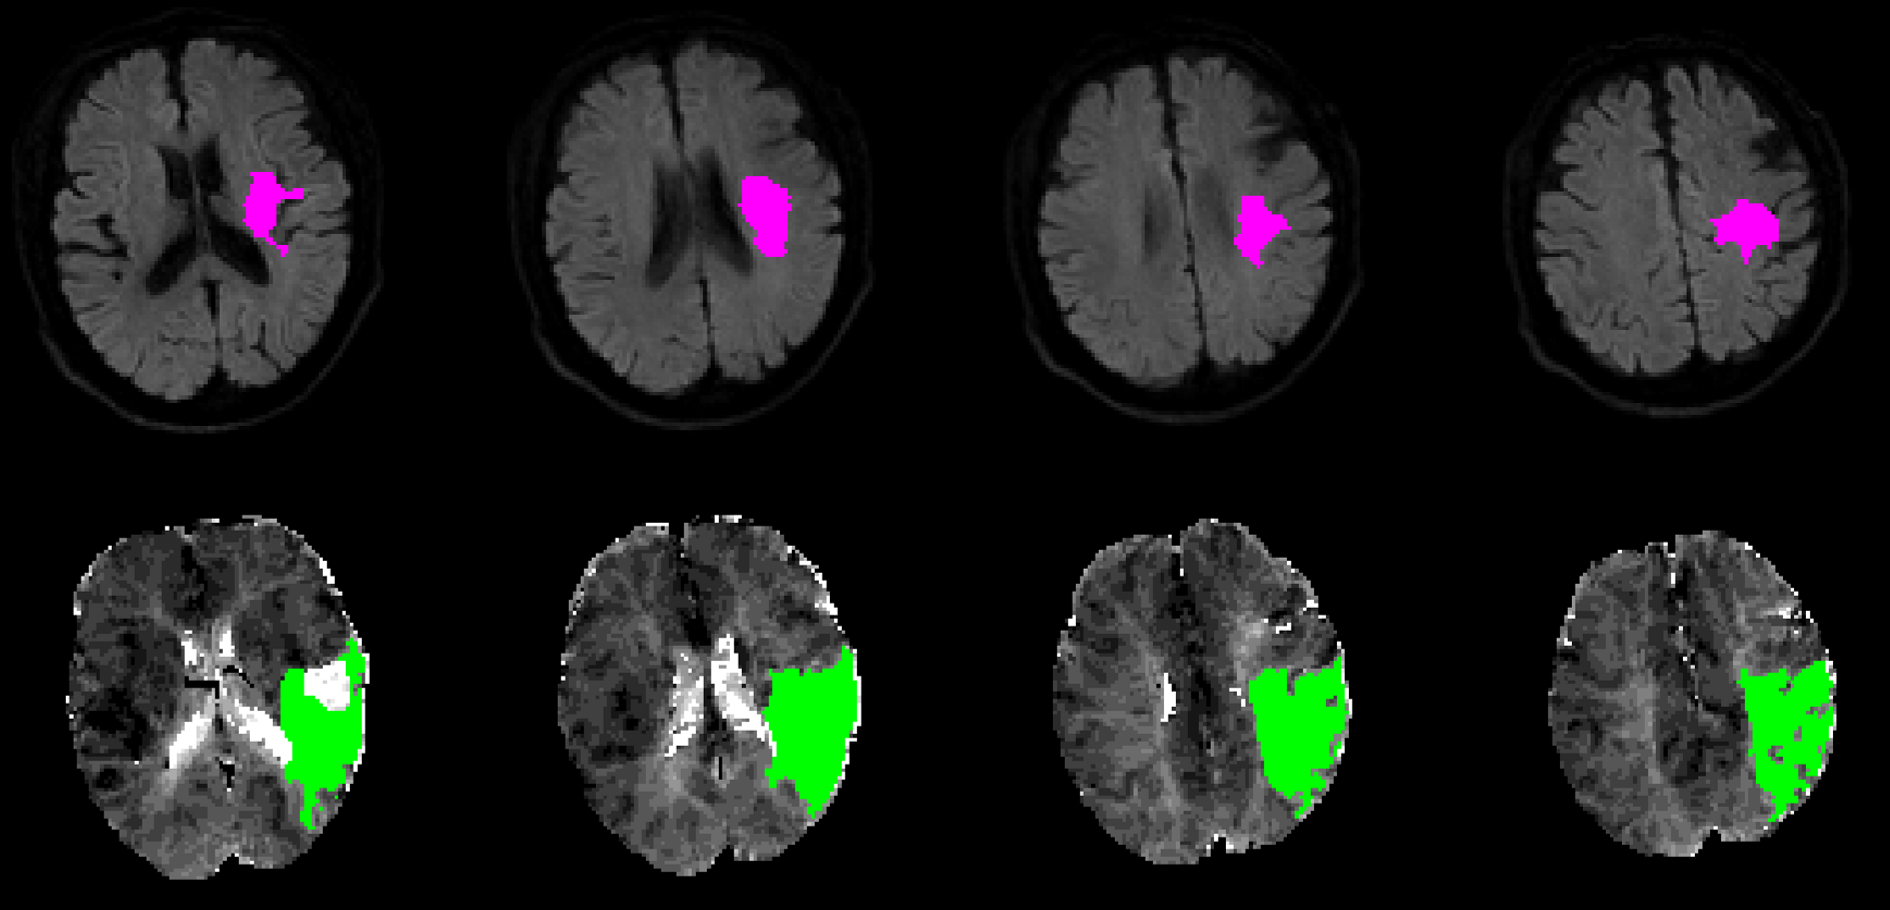
Figure 1. DWI lesion and PWI lesion automatically assessed with RApid processing of Perfusion and Diffusion (RAPID) in an AIS patient. Infarct core identified using ADC threshold (Upper row). The green regions indicate hypoperfused tissue (Bottom row). The lesion ROIs were selected by in-house MATLAB (MathWorks, Natick, MA, USA) scripts in the subsequent analysis.
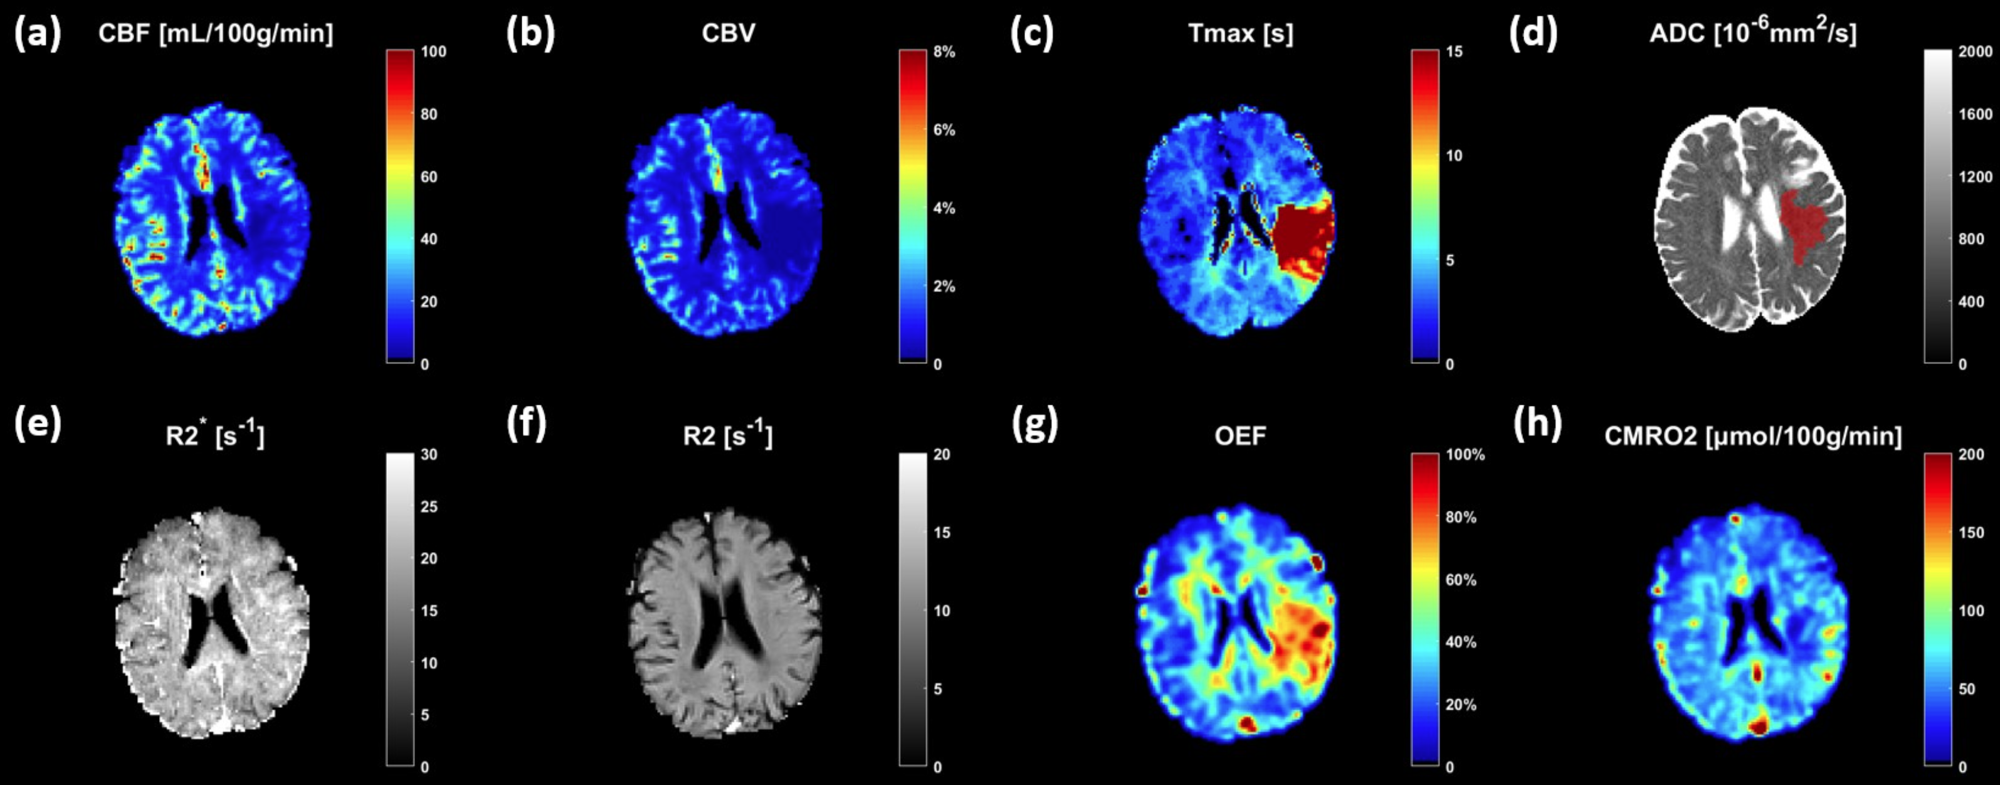
Figure 2. Representative images of a 72-year-old male patients (2 hours post-onset case). The PWI analysis showed hypoperfusion in left temporal, parietal lobe (a,b,c) and the infarct lesions were mainly in left periventricular white matter (shown in red, d); the tissue with elevated OEF was similar to the region of hypoperfusion (f); the area of reduced CMRO2 in the left hemisphere was considerably smaller than the hypoperfusion but comparable with infarct core defined by ADC (h).
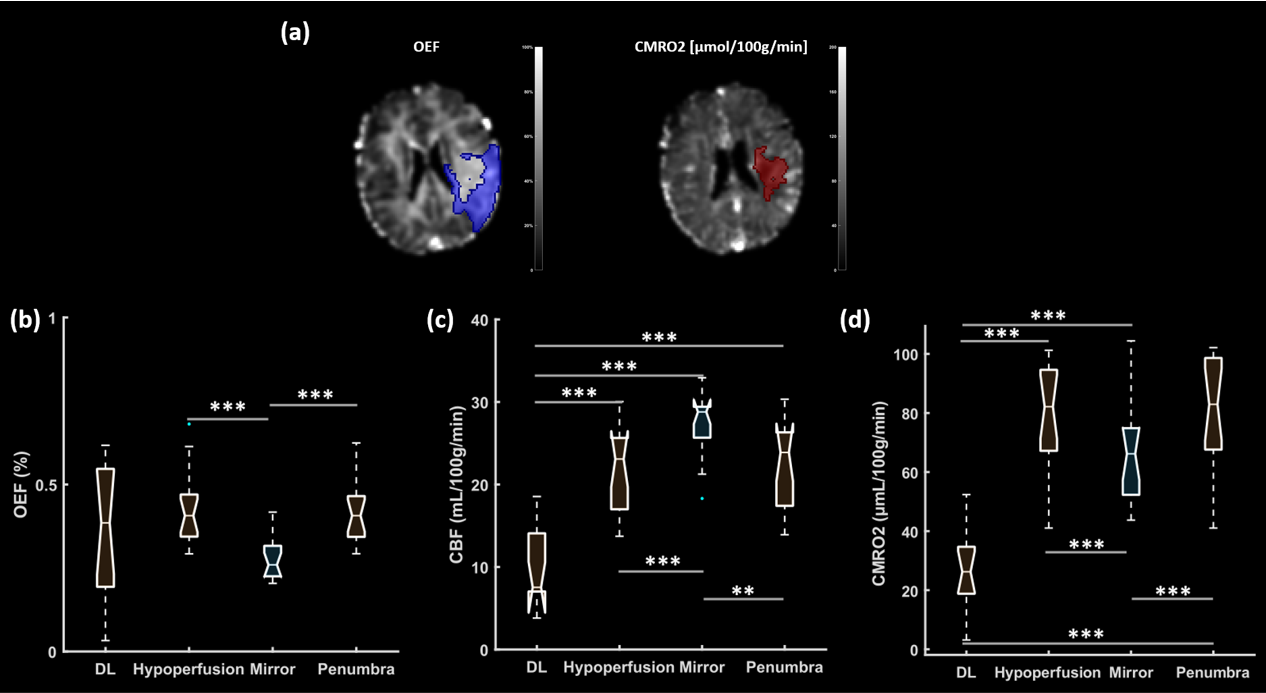
Figure 3. (a) Left side: OEF maps with blue overlay for mismatch region. Right side: CMRO2 maps overlaid with ischemic core identified using ADC threshold (shown in red); (b,c,d) OEF, CBF and CMRO2 in the ischemic core (diffusion lesion, DL), hypoperfusion, penumbra and contralateral area (mirror).
DOI: https://doi.org/10.58530/2023/0881