0880
Arterial transit artifacts may be easier to identify transient ischemic attack and stroke in intracranial stenosis than High-resolution MRI1Department of MRI, Shaanxi Provincial People's Hospital, Xi’an, China, 2Philips Healthcare, Xi’an, China
Synopsis
Keywords: Stroke, Arterial spin labelling, Arterial transit artifacts, transient ischemic attack, stroke
High-resolution magnetic resonance imaging (HRMRI) can be used to characterize the differences in plaque characteristics between transient ischemic attack (TIA) and stroke populations, but it is a time consuming and complicated method.. In this study, we compared the diagnostic performance of HRMRI and arterial spin labeling (ASL) with two post labeling delay times (PLD) combined with clinical risk factors to distinguish TIA and stroke in intracranial stenosis. The results showed that there was no statistical difference between the two methods. In addition, combined model has a good diagnostic performance in predicting stroke occurrence in TIA patients.Introduction
Transient ischemic attack (TIA) is a major precursor to impending stroke[1-2]. Early identification and timely management of high-risk populations can significantly reduce the incidence rate of stroke[3]. Intracranial atherosclerotic stenosis (ICAS) is the main cause TIA and stroke, and the middle cerebral artery (MCA) is most commonly involved part[4-5]. Previous studies used high-resolution magnetic resonance imaging (HRMRI) to characterize plaque features and dynamic sensitivity contrast-enhanced (DSC) perfusion-weighted imaging (PWI) to reflect hemodynamic injury[6]. However, this method takes a long time to check and the corresponding post-processing procedure is very complex. Besides, DSC PWI is an invasive method that is not suitable for some special patients. Different from DSC PWI, arterial spin labeling (ASL) can provide a convenient and non-invasive visual assessment of arterial transport artifacts (ATA) [7-8]. In order to find a more simple and effective way to identify high-risk TIA patients, we compared the diagnostic performance of HRMRI and ASL with two post-labeling delay times (PLD) combined with clinical risk factors to distinguish TIA and ischemic stroke caused by intracranial atherosclerotic stenosis. Furthermore, we established a predictive model for ischemic stroke prediction.Materials and Methods
Consecutive patients with sICAS were retrospectively collected from October 2020 to December 2021. All patients underwent MR imaging using a 3.0 T MR scanner (Ingenia CX, Philips Healthcare, the Netherlands) with a 32-channel head coil. Imaging sequences include: T1WI, T2WI, FLAIR, DWI, TOF-MRA, black-blood pre-contrast T1WI, contrast-enhanced T1WI, and pseudo-continuous ASL [post labeling delay (PLD): 1.5s and 2.5s]. Patients were divided into TIA group and stroke group according to whether cerebral infarction occurred in MCA area on DWI. A total of 85 participants were finally evaluated with 47/38 were assigned to TIA/stroke group. Two experienced neuroradiologists (12 and 6 years of experience, respectively), blinded to any clinical information, assessed vascular lumen and plaque features at the narrowest site of the MCA on HRMRI images and assessed whether the presence of ATA was appeared in 2-PLD (1.5s, 2.5s) ASL images. The intraclass correlation coefficient (ICC) was used to find the inter-observer reproducibility of the measurements. Logistic regression (binary variables) analyses were performed to assess the different features between TIA and stroke group. Receiver operating characteristic (ROC) curves were used to evaluate the diagnostic performance of different models. Z-test was used to compare the area under the curve (AUC) of each model. All tests were two-sided and performed by using SPSS (version 26) or R (version 4.0.4). The significant threshold was set to p < 0.05.Results
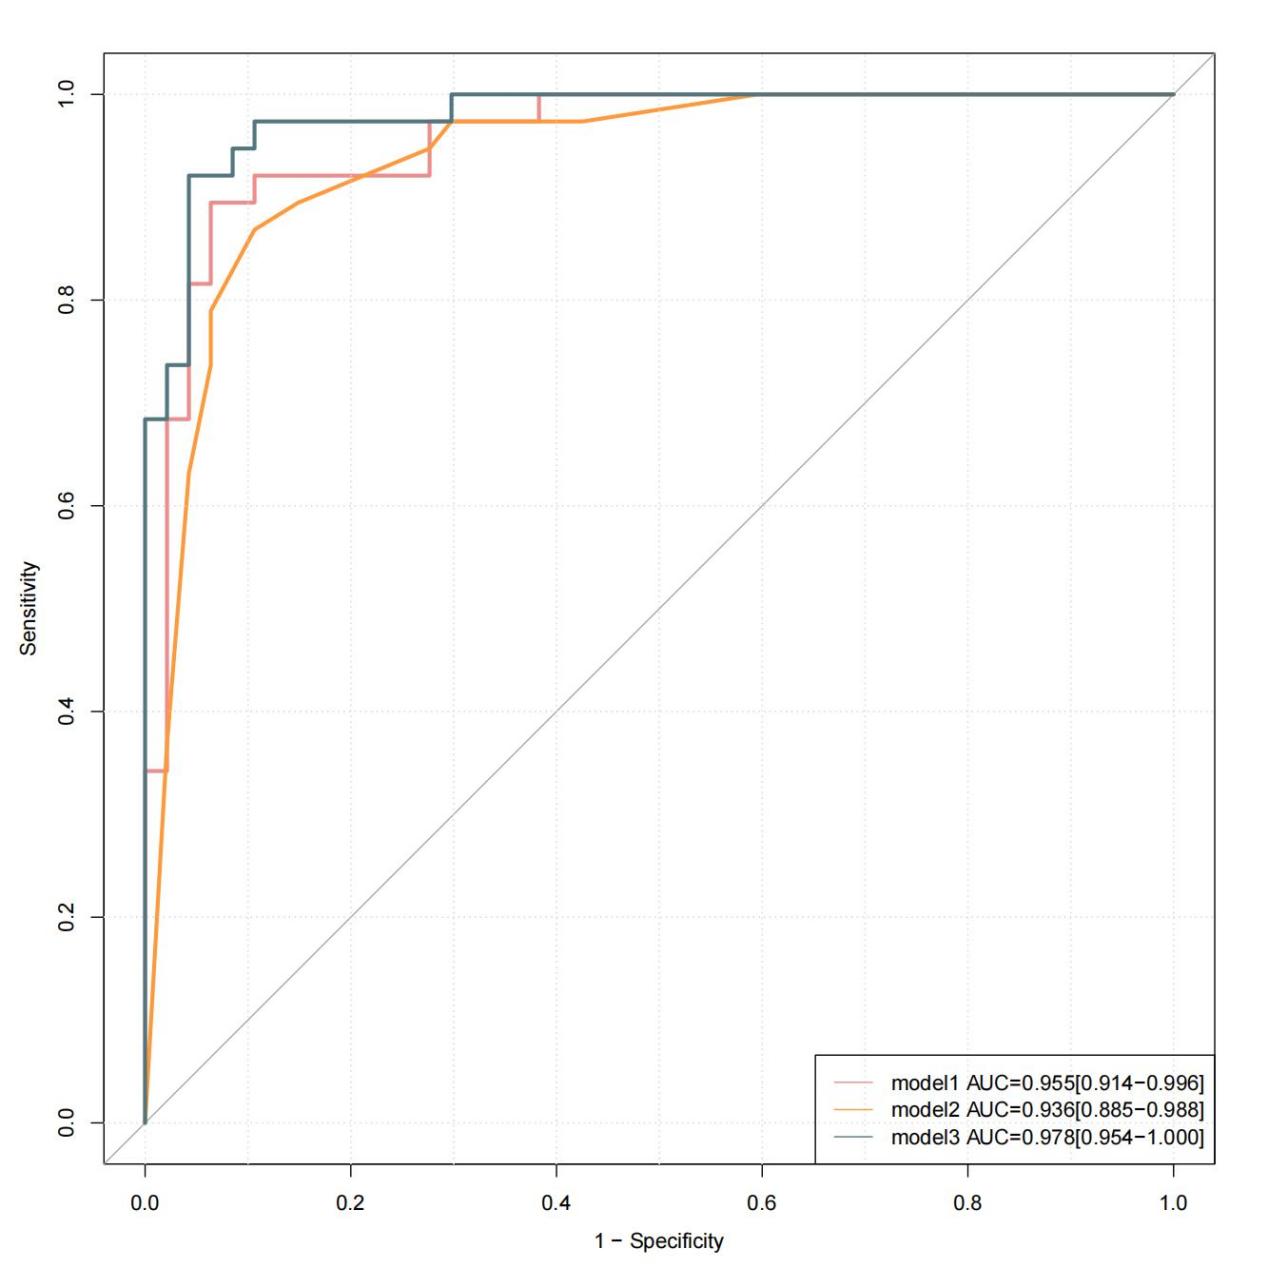
Figure 1 shown two typical examples of images and measurements. Good and excellent inter-reader agreements were obtained in the measurement of plaque characteristics and ASL (ICC = 0.796 - 0.966, p < 0.001). Compared with the TIA group, the stroke group had significantly more patients with hypertension, hyperlipidemia (Table 1). Plaque burden, degree of stenosis, enhanced ratio, prevalence of positive remodeling, intraplaque hemorrhage, 1.5s-ATA present and 2.5s-ATA present were significantly higher in stroke than those in the TIA group (Table 2). We combined the differential plaque characteristics and the presence of 2-PLD ATA with clinical factors to establish three models with model 1 (clinical risk factors + plaque characteristics), model 2 (clinical risk factors + 2-PLD ATA present), and model 3 (clinical risk factors + plaque characteristics +2-PLD ATA present) (Table 3). All three models showed excellent diagnostic performance in distinguishing between ischemic stroke and TIA patients. The diagnostic accuracy of model 3 was higher than that of model 1 and model 2 (Fig 2). The AUC shown no significant difference between model 1 and model 2 (95%CI -0.040-0.0764, Z=0.612, p=0.541). The sensitivity, specificity, positive predictive value, negative predictive value and accuracy of model 3 were 92.11%, 95.74%, 94.59%, 93.75% and 94.12%, respectively.Discussion
Conclusion
We demonstrate that ASL provides a simpler imaging assessment than HRMRI in predicting stroke. In addition, biological markers of plaque characteristics and hemodynamic differences between stroke and TIA patients were also effective distinguishing factors. With the combination of these features, the proposed model has a good predictive performance.Acknowledgements
No acknowledgement foundReferences
[1] Dennis M, Bamford J, Sandercock P, et al. Prognosis of transient ischemic attacks in the Oxfordshire Community Stroke Project. Stroke. 1990;21(6):848-853.
[2] Kleindorfer D, Panagos P, Pancioli A, et al. Incidence and short-term prognosis of transient ischemic attack in a population-based study. Stroke.2005;36(4):720-723.
[3] Johnston SC, Easton JD, Farrant M, et al; Clinical Research Collaboration, Neurological Emergencies Treatment Trials Network, and the POINT Investigators. Clopidogrel and aspirin in acute ischemic stroke and high-risk TIA. N Engl J Med.2018;379(3):215-225.
[4] Chen PH,Gao S,Wang YJ,et al.Classifying Ischemic Stroke, from TOAST to CISS.CNS Neurosci Ther. 2012;18(6): 452–456.
[5] Wong KS, Li H.Long-term mortality and recurrent stroke risk among Chinese stroke patients with predominant intracranial atherosclerosis. Stroke. 2003;34(10): 2361-6.
[6] Liu S , Tang R , Xie W, et al. Plaque characteristics and hemodynamics contribute to neurological impairment in patients with ischemic stroke and transient ischemic attack.[J]. European radiology. 2021; 31(4):2062-2072.
[7] Zaharchuk G. Arterial spin-labeled perfusion imaging in acute ischemic stroke. Stroke. 2014;45(4):1202–1207.
[8] Bang OY, Goyal M, Liebeskind DS. Collateral circulation in ischemic stroke: assessment tools and therapeutic strategies. Stroke. 2015;46(11):3302–3309.
Figures
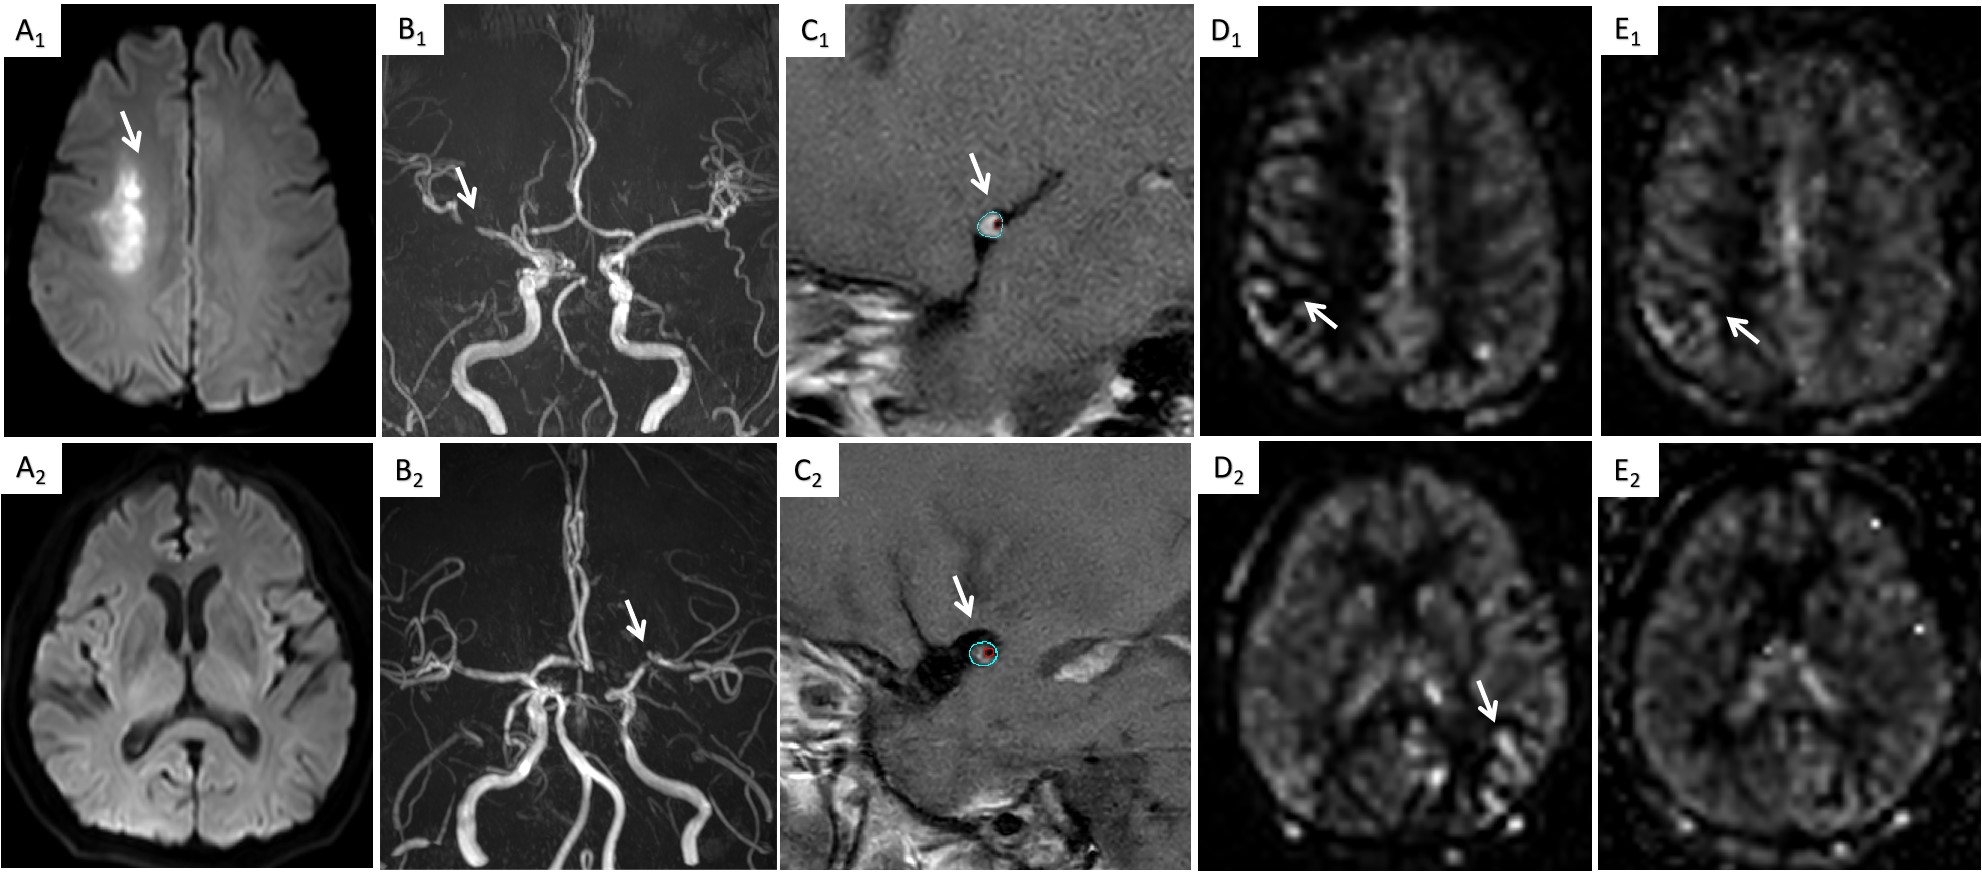
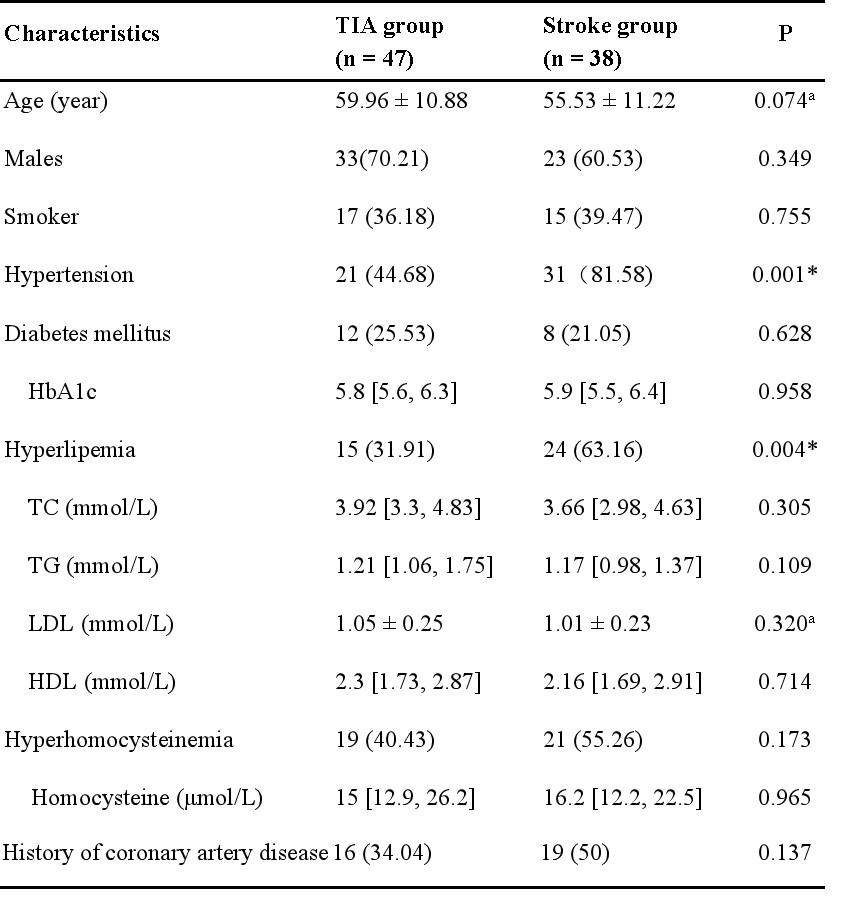
Table 1. Demographics and clinical characteristics of enrolled patients
All values represented as numbers (%) or or median [interquartile range] unless otherwise indicated
HbA1c = glycosylated hemoglobin; TC = total cholesterol; TG = triglyceride; HDL = high-density lipoprotein cholesterol; LDL = low-density lipoprotein cholesterol;
*p < 0.05 was recognized as statistically different from the two groups
aData presented as mean ± standard deviation
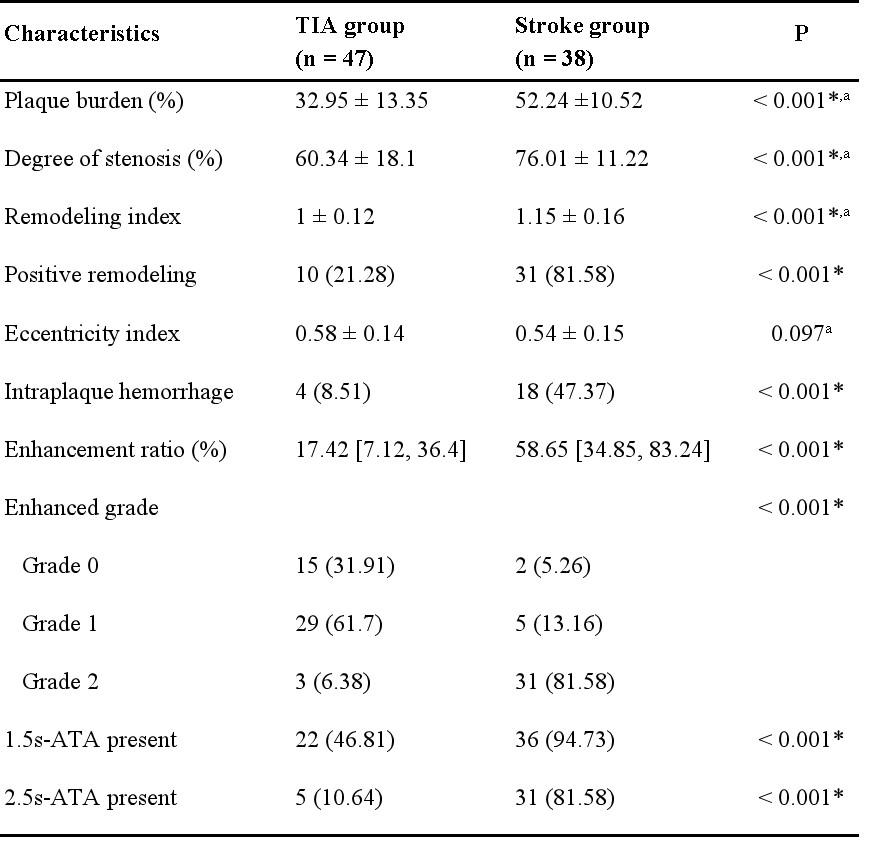
Table 2. Comparison of HRMRI Characteristics in two groups
All values represented as numbers (%) or or median [interquartile range] unless otherwise indicated
*p < 0.05 was recognized as statistically different from the two groups
aData presented as mean ± standard deviation
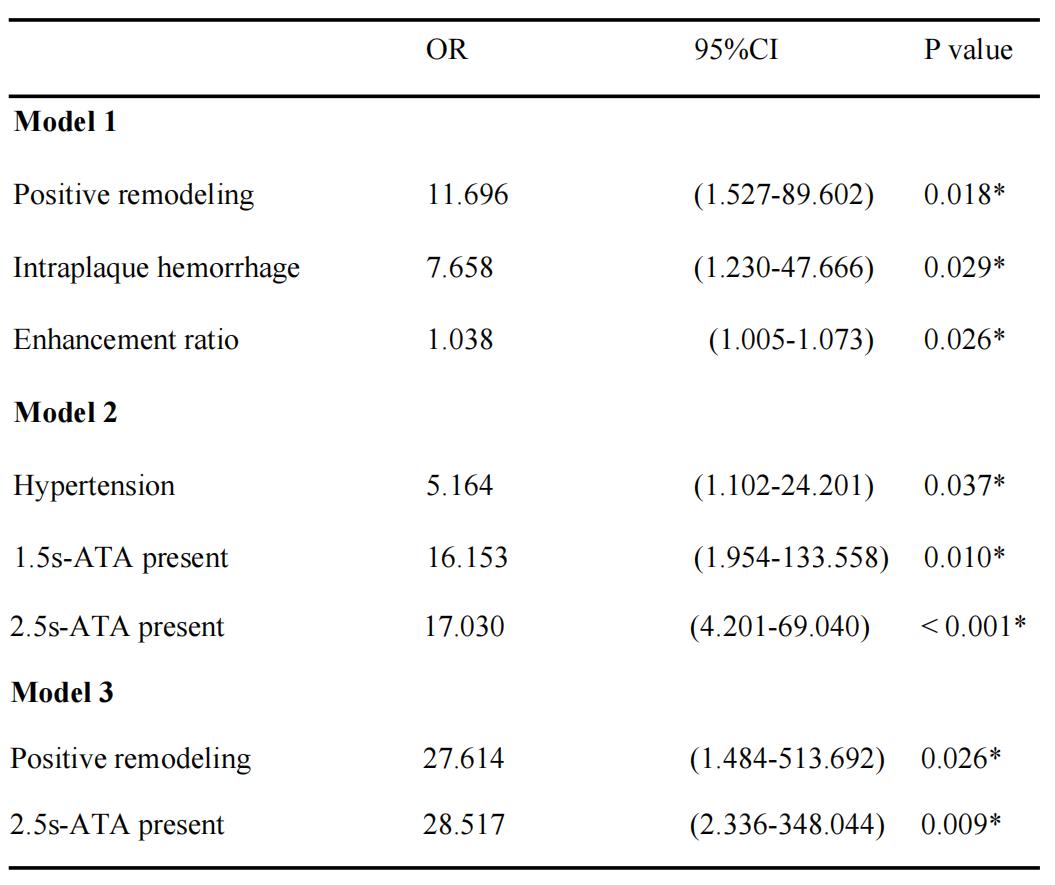
Table 3. Univariate and multivariate logistic analyses for ischemic stroke appearance
Model 1 (clinical risk factors + plaque characteristics), Model 2 (clinical risk factors + 2-PLD ATA present), and Model 3 (clinical risk factors + plaque characteristics +2-PLD ATA present).
*P < 0.05 indicates a significant difference;OR = odds ratio; CI = confidence interval; ATA = arterial transit artifact.